Here are the latest developments in global markets:
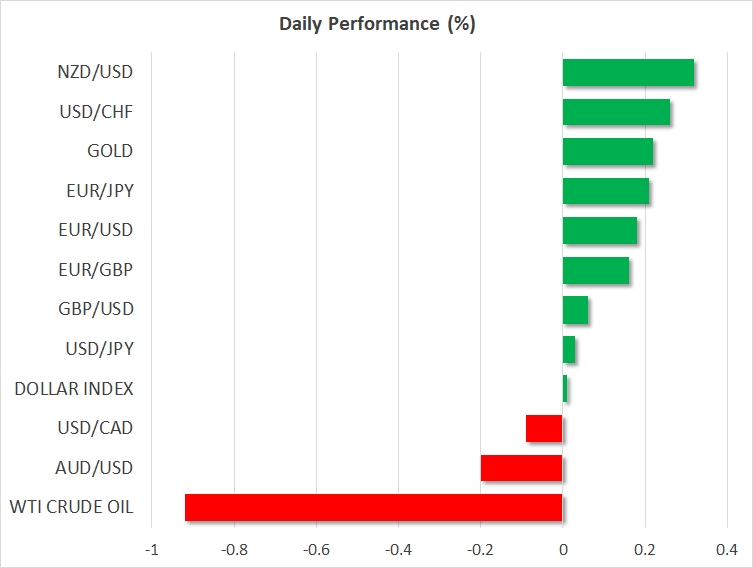
· FOREX: The dollar index was practically unchanged on Tuesday, after posting some gains yesterday. The currency’s broader decline appears to have been halted, at least for now, as investors appear to be focused more on the collapse seen in stock markets.
· STOCKS: US markets suffered one of their worst days on record yesterday. The Dow Jones led the collapse, falling by an astounding 4.6%. The S&P 500 was down 4.1%, its largest one-day decline since 2011, while the Nasdaq composite closed 3.9% down. According to futures, the Dow and the S&P could open lower today as well, though the same futures signal that the Nasdaq 100 may open slightly higher. The risk aversion rolled into the Asian trading session today as well. Japan’s Nikkei 225 and Topix indices fell by 4.7% and 4.3% respectively, while Hong Kong’s Hang Seng index is down 4.4%. European stocks are likely to feel the heat when they open today as well, with futures tracking the Euro Stoxx 50 currently down by 3.1%.
· COMMODITIES: The energy market did not escape unscathed either. Both WTI and Brent crude are lower by 0.9% today, as the risk-off sentiment probably weighed on demand for the precious liquid. The safe-haven Gold was one of the few winners today, up 0.2%, last trading near $1343 per ounce. Should risk aversion continue to prevail, the yellow metal could extend its gains. Immediate resistance may be found near $1350, with a potential upside break of that zone likely to open the way for gold’s recent highs at $1366.
Major movers: Equities suffer amid risk aversion; RBA stands pat
The collapse in major global equity markets accelerated yesterday. What is particularly interesting about the latest leg lower is that it appears to be driven primarily by risk aversion and a fear of loss, as opposed to rising US bond yields making bonds appear more attractive relative to equities. Whereas the last few days have been characterized by surging bond yields and falling equities, yesterday saw a simultaneous plunge in both stocks and Treasury yields. This implies that investors are becoming increasingly more concerned about the stock market and are seeking the safety of Treasuries, which is a typical market reaction in a risk-off environment.
Despite the big falls in major indices though, this still appears like a correction following an astonishing rally in equities, and not the beginning of a trend reversal. Indeed, it is not strange for stock markets to correct following such robust gains, especially as some investors may have taken the opportunity to take some profits off the table. The fact that it has been so long since a major correction occurred possibly plays into this as well.
The key question on everyone’s mind now should be: how low can equity markets go before willing buyers appear to halt the decline? It is important to note that with bond yields being on the rise overall, and equities falling, money is flowing out of both the bond and the stock markets. Thus, it appears some investors may be sitting on more and more cash, which will probably be looking to reenter the market at more favorable levels.
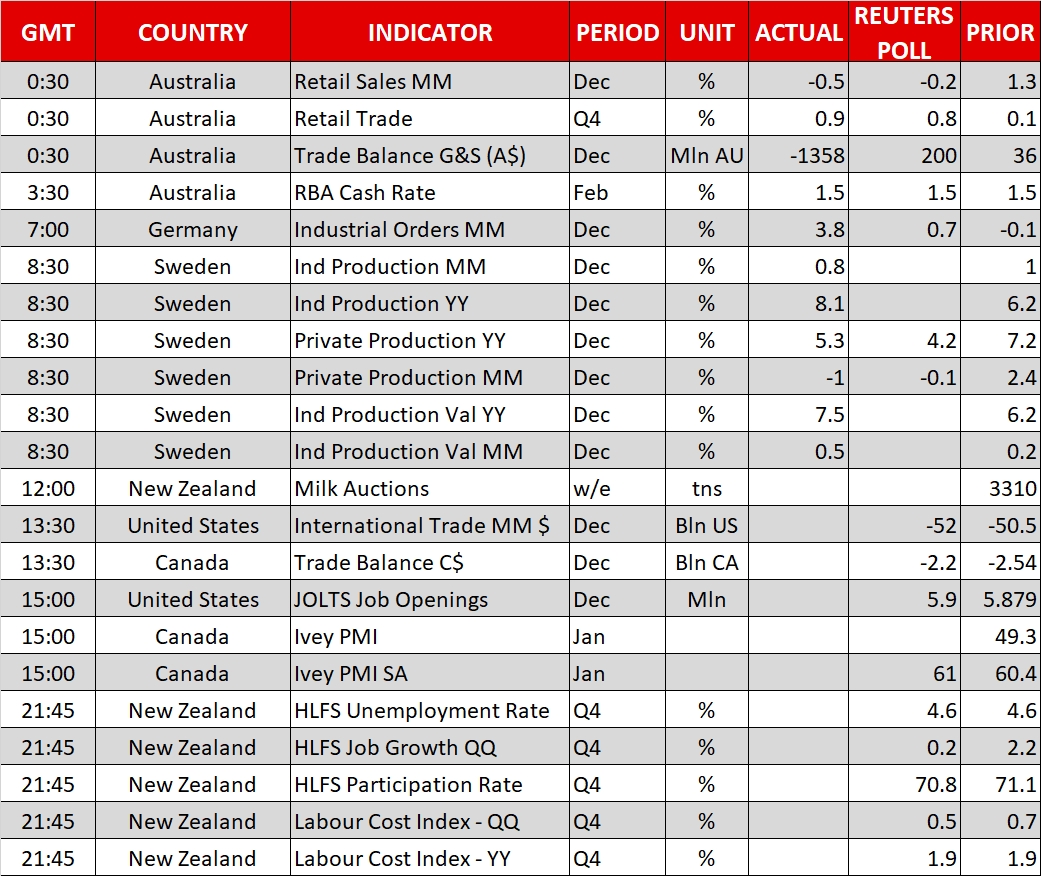
Overnight, the Reserve Bank of Australia (RBA) remained on hold, as was widely anticipated, and maintained a relatively neutral tone on policy. The Bank remains concerned with the high level of Australian household debts, particularly because incomes are growing very slowly. As for the AUD, the RBA did not appear worried, simply reiterating that an appreciating exchange rate would be expected to weigh on growth and inflation. Overall, the key message was that not much has changed, and that any potential rate hike later this year would be highly dependent on incoming data, particularly as they relate to wages. The reaction in aussie/dollar on the decision was somewhat limited, but the pair was already on the back foot beforehand, following disappointing Australian data.
Elsewhere, in Germany, headlines yesterday suggested that the two major parties are very close to finalizing a coalition deal. The talks are expected to conclude today, with a potential coalition likely to alleviate some of the uncertainty surrounding the European political scene.
Day ahead: Busy day for kiwi traders as milk auction & jobs data are due; trade data out of US and Canada, with US JOLTS job openings also on the agenda
Kiwi traders will be paying attention to the outcome of the bi-weekly milk auction – New Zealand is a major dairy exporter – that is set to take place on Tuesday around 1400 GMT; the release is tentative, lacking a fixed time of release. Kiwi pairs will again come in the spotlight at 2145 GMT when New Zealand releases its Q4 2017 Household Labor Force Survey. The jobless rate is forecast to remain at 4.6% – its lowest since Q4 2008 – while jobs growth is expected to stand at 0.2% on a quarterly basis – this compares to 2.2% in Q3 – and the participation rate is projected to tick down. Data on labor costs will also be in focus.
The US and Canada will see the release of international trade data and trade balance figures for the month of December respectively at 1330 GMT. December’s JOLTS job openings out of the US and January’s Ivey PMI out of Canada both due at 1500 GMT will also attract attention.
St. Louis Fed President James Bullard is scheduled to give a presentation on the US economy and monetary policy before the 29th Annual Gatton College of Business and Economics Economic Outlook Conference at 1350 GMT.
API weekly data on crude oil stocks are due at 2135 GMT.
In equity markets, the earnings season continues amid the broad equity selloff.
Technical Analysis: NZD/USD posts three-week low; stochastics give bullish signal in very short-term
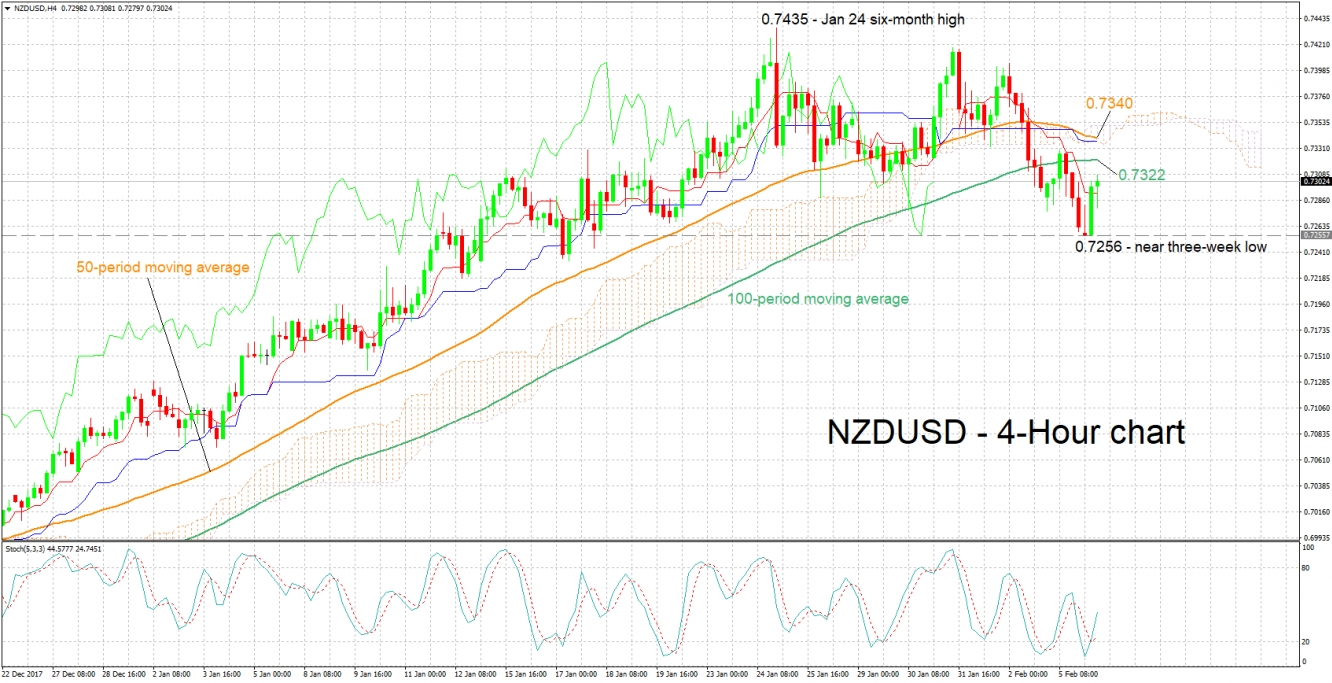
NZD/USD is trading roughly 50 pips above a near three-week low of 0.7256 hit earlier on Tuesday. The negatively aligned Tenkan- and Kijun-sen lines on the four-hour chart are projecting a negative picture in the short-term. However, notice that the two have flatlined, this potentially being a sign that negative momentum has come to a halt. Also, the stochastics are giving a bullish signal in the very-short term, as the %K line has moved above the slow %D one.
Strong jobs data out of New Zealand later on Tuesday are expected to lead to long positions, pushing the pair higher. In this case resistance could be met around the 100-period moving average at 0.7322. Not far above this level lie the 50-period MA, Kijun-sen line and the Ichimoku cloud.
On the downside and in case of weaker data out of New Zealand, some support could come around the Tenkan-sen which failed to provide resistance on the way up and could instead act as support. Further below, the focus would shift to the low of 0.7256 recorded earlier in the day.
The milk auction that is due before the labor market data also has the capacity to spur movements in the pair.


