- SPX, NASDAQ hit records
- China’s biggest oil company sees falling inventories
Contracts on U.S. indices fell from all-time highs, and European stocks extended their drop, ahead of the earnings season and the long-anticipated Phase One U.S.-China trade deal.
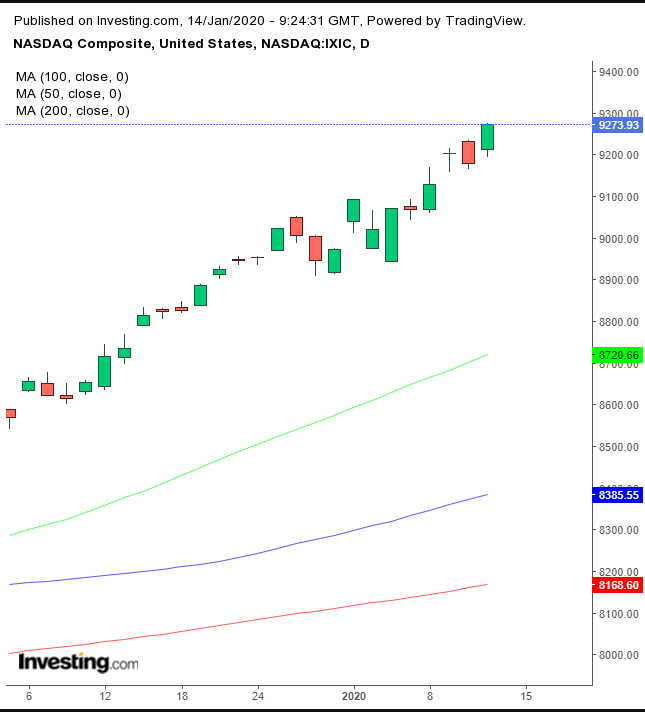
S&P 500 and NASDAQ futures declined after their underlying gauges soared to record highs on Monday.
Chemicals and banks dragged the Stoxx Europe 600 Index lower for a second-day.
Earlier, Asian indices closed off their highs after as Chinese data showed declining trade with the U.S. for 2019, provoking a Chinese selloff that pushed China’s Shanghai Composite 0.28% lower. Australia’s ASX 200 gained 0.85%, as traders there decided to focus on the coming signature of an initial trade agreement between the U.S. and China, Australia’s biggest trading partner. Japan’s Nikkei 225 also climbed 0.73%, playing catchup after its Coming of Age Day.
In the U.S., investors got a breath of fresh air as equities reached record levels before earnings season and the long-awaited Phase One of trade negotiations between the U.S. and China.
Big Tech, including Microsoft (NASDAQ:MSFT), Apple (NASDAQ:AAPL) and Tesla (NASDAQ:TSLA) drove the S&P 500 Index and NASDAQ Composite to record closes and all-time highs. The market took on risk after a report that the U.S. intended to remove China from the blacklist of currency manipulators, none of which are trading partners with the world’s economic superpower.

The tech heavy-NASDAQ Composite (1.04%) outperformed, hitting a dual record, both on a closing basis and intraday high. The price closed near the session’s highs, demonstrating the market’s single-mindedness, even at these levels.
While it was difficult to separate expectations for a positive earnings season and the coming first concrete step to a tariff truce between the world’s two largest economies, it’s noteworthy that U.S. futures are scaling back the next day. Are investors second-guessing themselves, after a mixed U.S. jobs report? Perhaps China’s data showing that 2019 trade between the two economic opponents diminished, though it appears an unlikely reason, considering the initial trade signature means the future will be different from last year.

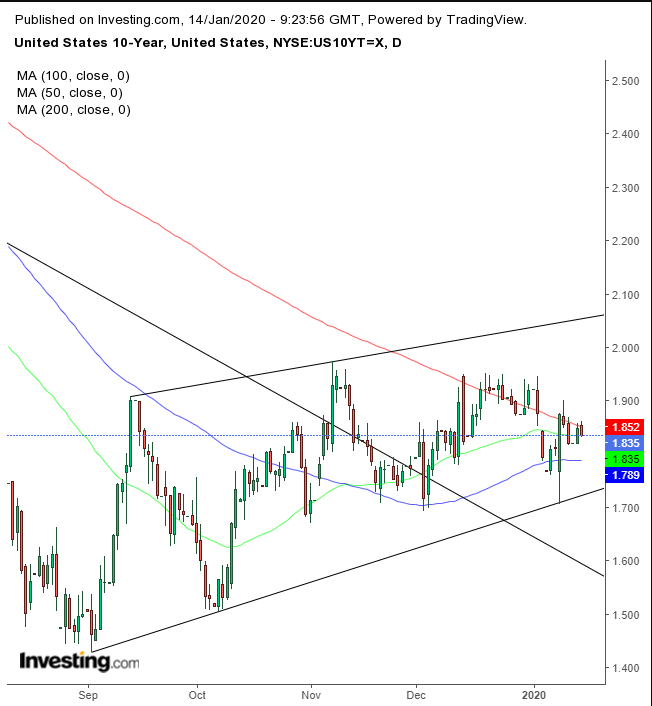
Yields jumped but fell after attempting to cross over the 200 DMA, around which they've been stuck since it was first touched on Dec. 13. Rates have been struggling to maintain their short-term uptrend since the Sept. 3 bottom, which crossed over the downtrend line since November 2018.

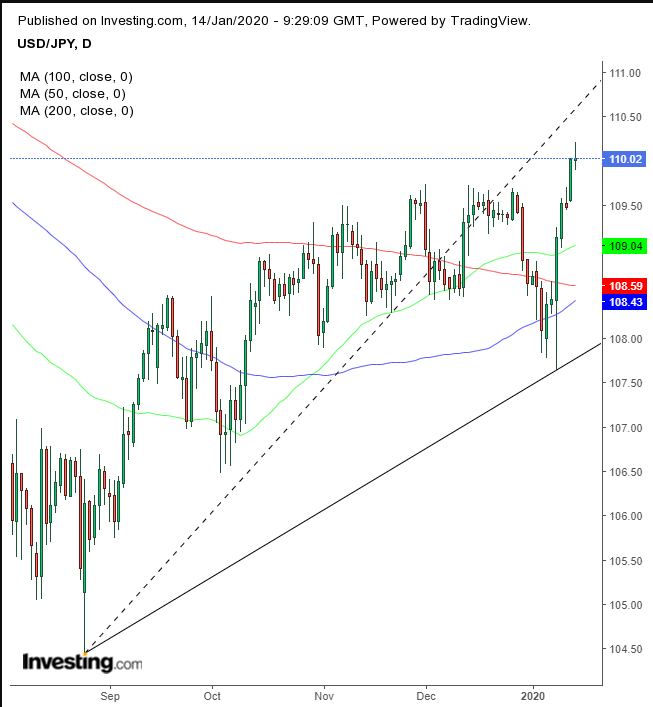
Despite the rise in equities and yields, the Japanese yen maintained its weakness. However, the USD/JPY is developing a high wave candle, demonstrating uncertainty about direction. For now, the higher price allows us to draw a new uptrend line, one that supports the price.

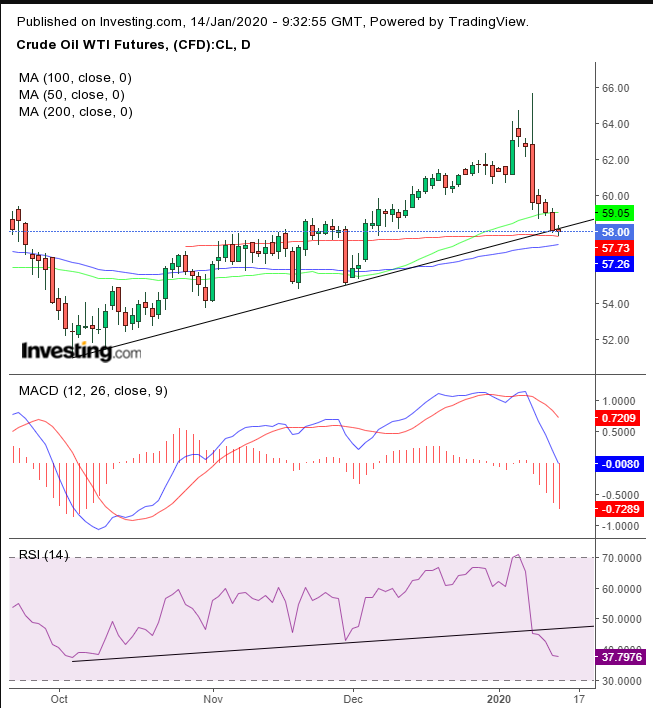
Oil extended a selloff to its sixth day, the longest streak since September, after China’s state-run National Petroleum Corporation, the country’s biggest oil firm, forecast slowing growth for inventories. Technically, the price dipped below its uptrend line since the Oct. 3 bottom, with bearish MACD and RSI, while the 200 DMA maintains support.
Up Ahead
- Phase one of the U.S.-China trade deal is set to be signed on Wednesday in Washington.
- The biggest American financial institutions kick off earnings season, including JPMorgan Chase (NYSE:JPM) & Co., Citigroup Inc (NYSE:C)., Wells Fargo (NYSE:WFC) & Co., Bank of America Corp (NYSE:BAC)., Goldman Sachs Group Inc (NYSE:GS)., Morgan Stanley (NYSE:MS) and BlackRock Inc (NYSE:BLK).
- The U.S. releases inflation data for December on Tuesday.
- The Fed’s so-called beige book is due on Wednesday.
- China GDP comes on Friday.
Market Moves
Stocks
- The Stoxx Europe 600 Index fell 0.4%.
- Futures on the S&P 500 Index decreased 0.3%.
- France’s CAC 40 Index dipped 0.6%.
- The MSCI Asia Pacific Index advanced 0.3%.
Currencies
- The U.S. Dollar Index increased 0.1%.
- The British pound declined 0.1% to $1.297.
- The euro climbed 0.1% to $1.114.
- The Japanese yen was little changed at 109.92 per dollar.
Bonds
- The yield on 10-year Treasuries decreased one basis point to 1.83%.
- Germany’s 10-year yield dipped one basis points to minus 0.17%.
- Britain’s 10-year yield decreased three basis points to 0.724%.
