- U.S. futures tune into Wall Street's fresh records
- European shares lag on profit taking but hold onto Monday's 4-year high
- Asian valuations hit 20-month high
- Yields keep surging but head for resistance level
Key Events
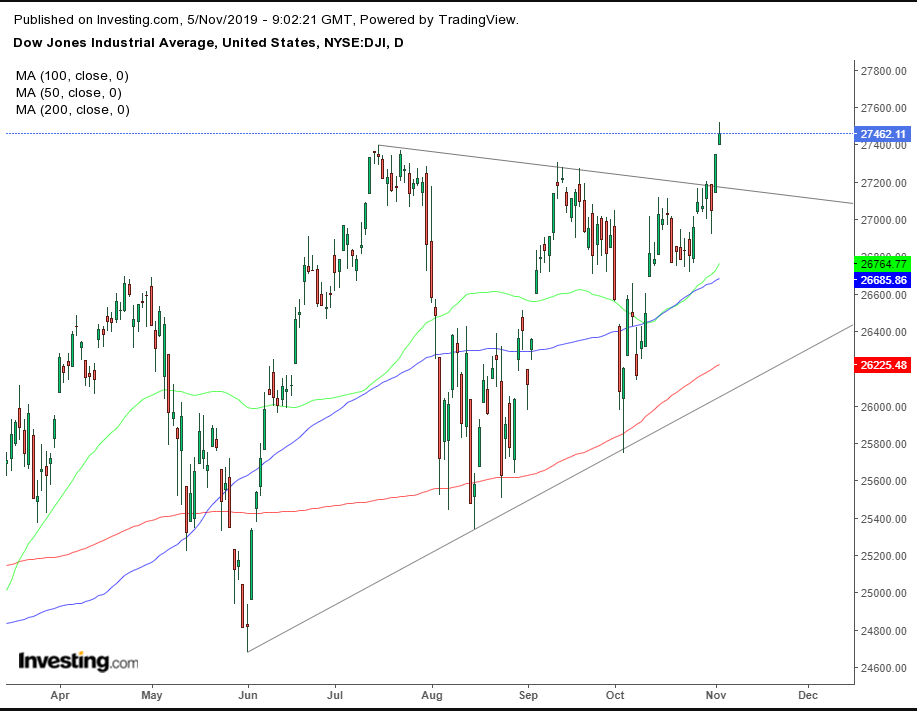
Futures on the S&P 500, Dow, NASDAQ 100 and Russell 2000 climbed this morning, building on yesterday’s Wall Street rally, where equities hit new records on trade bullishness.
Trading on European shares, however, was slightly more subdued, as utility stocks wiped out gains posted by miners shares, thereby leaving the STOXX 600 mostly flat. The standstill was likely driven by profit-taking: on Monday, the regional benchmark reached a four-year high with industrial firms and banks shares, after U.S. commerce secretary Wilbur Ross said tariffs on European vehicles might be unnecessary.
Earlier, across Asian markets, valuations reached a 20-month high thanks to upbeat third-quarter mega-cap earnings, on top of the promise of a trade deal. Due to the rise in the P/Es, regional shares are catching up with the valuations of their global peers, Refinitiv data showed.
Japan’s Nikkei 225 (+1.76%) led gains, with traders catching up across all indices to a risk-on market after being closed Monday for a holiday.
Global Financial Affairs

Yesterday, the Dow Jones Industrial Average finally joined the S&P 500 and the NASDAQ Composite in posting new records, on news that China and the U.S. are nearing the first phase of a trade deal.
In the losers camp, Utilities (-1.28%) and Consumer Staples (-0.96%) slipped lower, with McDonald's) leading losses after CEO Steve Easterbrook was fired over a relationship with an employee. Under Armour (NYSE:UAA) also fell after the group revealed it is undergoing an accounting investigation.

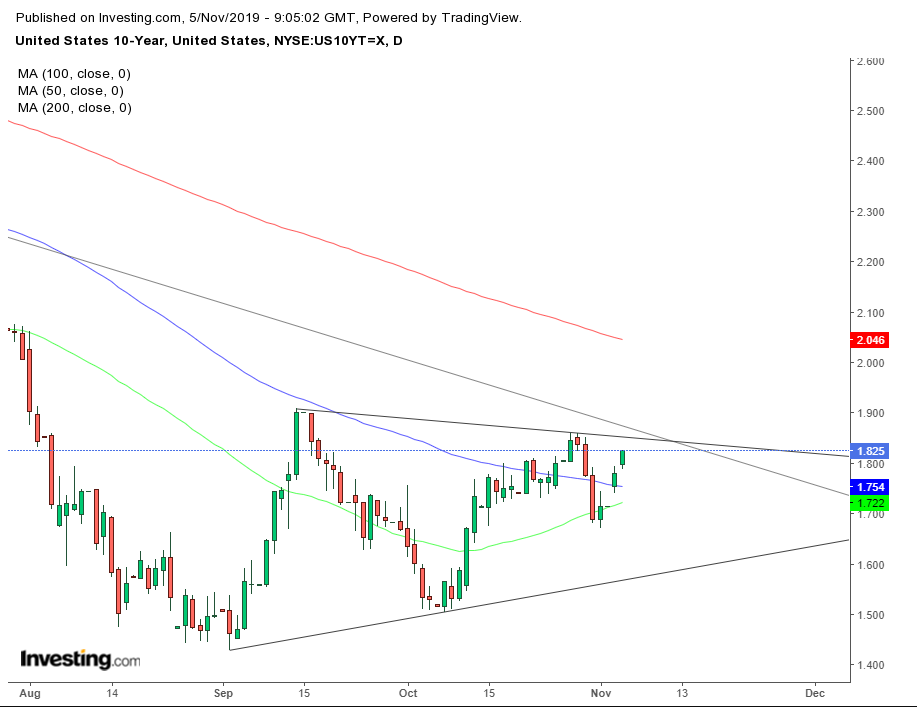
Meanwhile, yields on 10-year Treasurys jumped for the third day, as they neared the nexus of the top of a symmetrical triangle and the downtrend line since November 2018.

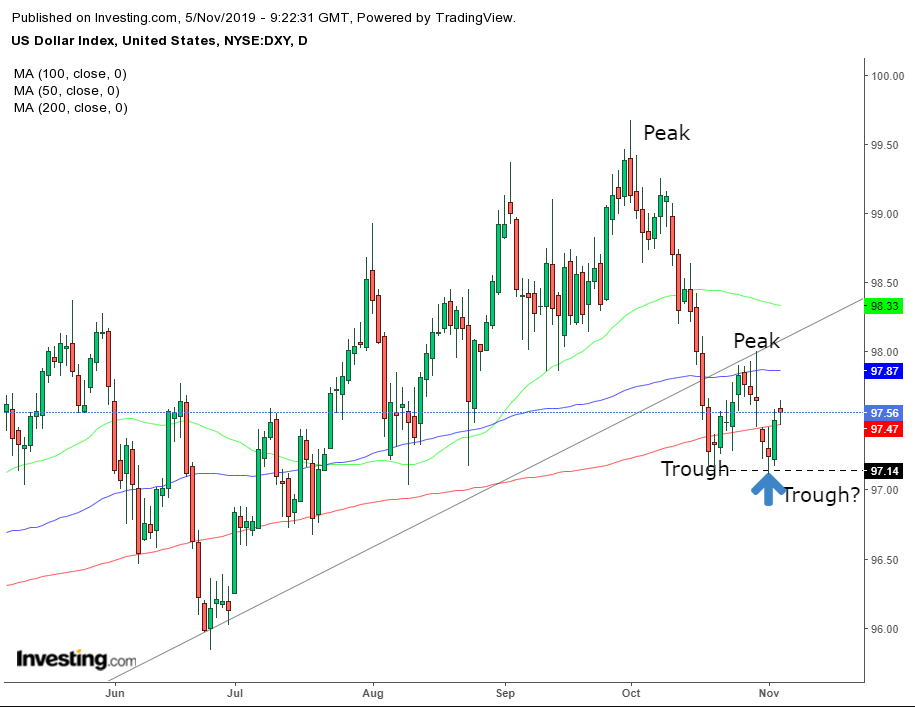
The Dollar Index followed yields higher, climbing for the second day. Technically, the index may have completed the second trough of a downtrend, if the previous rally—which found resistance by the uptrend line since February 2018—was enough to consider a peak. The greenback also returned above the 200 DMA.

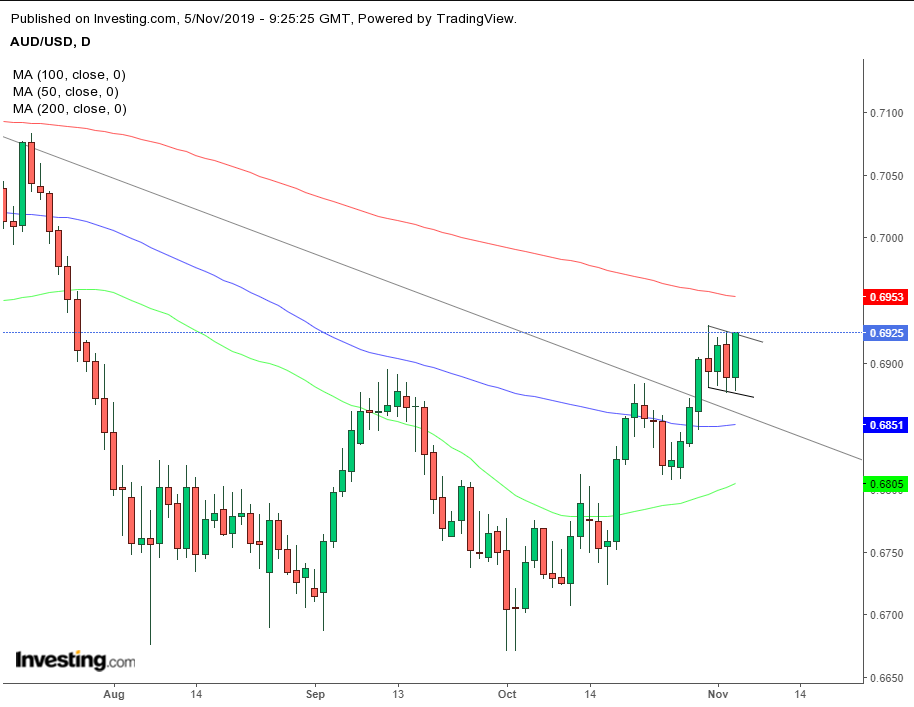
In other FX markets, the Australian dollar rose after the country's central bank left interest rates unchanged and said past easing measures are yielding enough support. Technically, the Aussie is forming a falling flag, especially bearish after crossing above the downtrend line since late January 2018 and completing a peak and trough ascension in the short term. It still has the 200 DMA above it.
Oil rose for the third day, benefiting from the improved outlook on trade.
Up Ahead
- Earnings are due from companies including: Singapore Airlines (SI:SIAL) on Tuesday; Qualcomm (NASDAQ:QCOM), Softbank (T:9984) and BMW (DE:BMWG) on Wednesday; Walt Disney (NYSE:DIS), Toyota (T:{{
44227|8015}}) and Deutsche Telekom (DE:DTEGn) on Thursday. - Regional Fed presidents including Charles Evans, John Williams and Patrick Harker speak at events on Wednesday.
- Central bank monetary decisions are due on Tuesday in Australia and Thursday in the U.K..
- The USDA World Agricultural Supply and Demand Estimates Report for November comes out on Friday.
Market Moves
Stocks
Currencies
Bonds
Commodities
