Key Events
European and U.S. futures contracts—including for the S&P 500, Dow Jones and NASDAQ—advanced early this morning, with Japanese stocks playing catch-up after a local holiday. This comes in the aftermath of the announcement of this weekend's U.S.-Sino transitional deal on trade, though recent reports are casting some doubts on the situation. In the rest of Asia, investors appear to have become cautious as China's reluctance surfaces.
Yields extended a decline and the U.S. dollar edged lower.
Global Financial Affairs
Volume was thin in the Asian session today, except for post-holiday activity on Tokyo’s Nikkei 225 (+1.87%), which gained more than the boost seen on Wall Street this past Friday. China’s Shanghai Composite dropped (-0.56%) after a four-day rally, as the latest factory gate data added to China's economic woes even as a deal to end the trade war with the United States remains elusive.
Technically, the price retreated from the July and September highs, which, if surpassed, would complete a H&S bottom.
In yesterday’s U.S. session, stocks ended lower after a volatile day as markets reacted to the still illusive trade deal. China just isn’t ready to sign on the dotted line, embarrassing President Donald Trump who has been actively 'selling' the tariff resolution.
Trading was about 28% below the 30-day average. A tweet from China's Global Times, however, painted a more optimistic outlook, supporting equities.

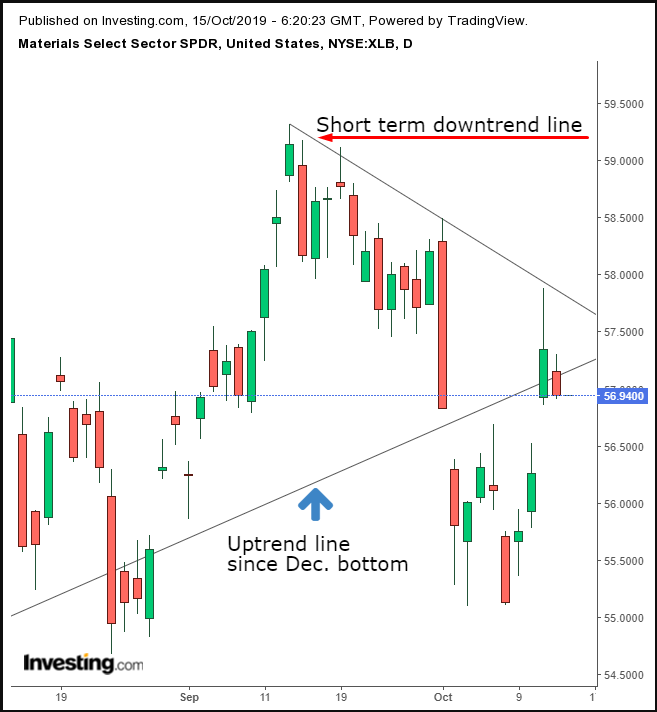
The S&P 500 Index backtracked 0.14% yesterday, with the trade sensitive Materials sector slipping (-0.71%) after surging nearly 2% on Friday, on hopes of a final trade resolution. From a technical perspective, the XLB returned below the uptrend line since the December bottom, for the third time since Aug. 23.
If this sector is any indication of the market’s outlook on trade, hopes are clearly slipping. The broader SPX is still well below its uptrend line since December 2018 during the worst Pre-Christmas selloff on record. Monday’s price action confirmed Friday’s extremely bullish shooting star, whose top retreated from the 3,000 psychological level.

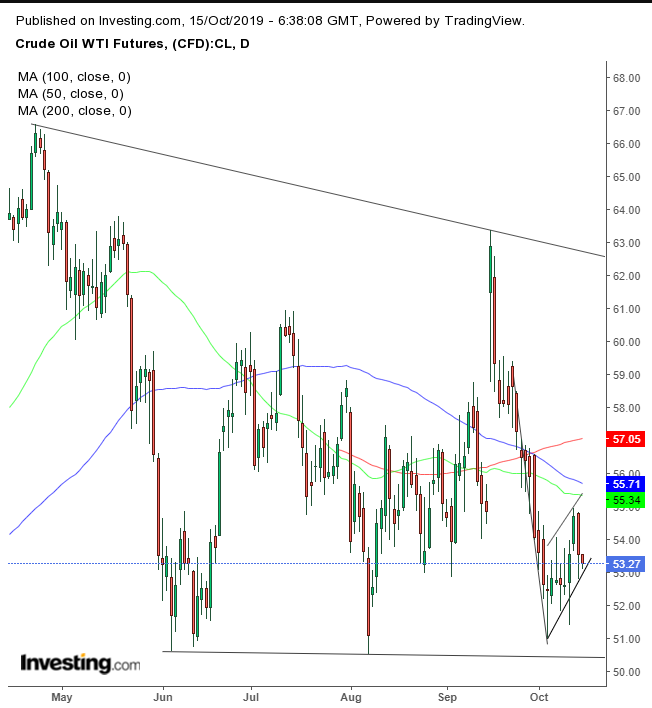
Crude oil dropped for the second day, falling toward the bottom of a rising flag, bearish after the eight straight daily drop, between Sept. 23 and Oct. 3. A downside breakout would increase the potential of completing a much larger descending triangle since the April $66.60 highs.

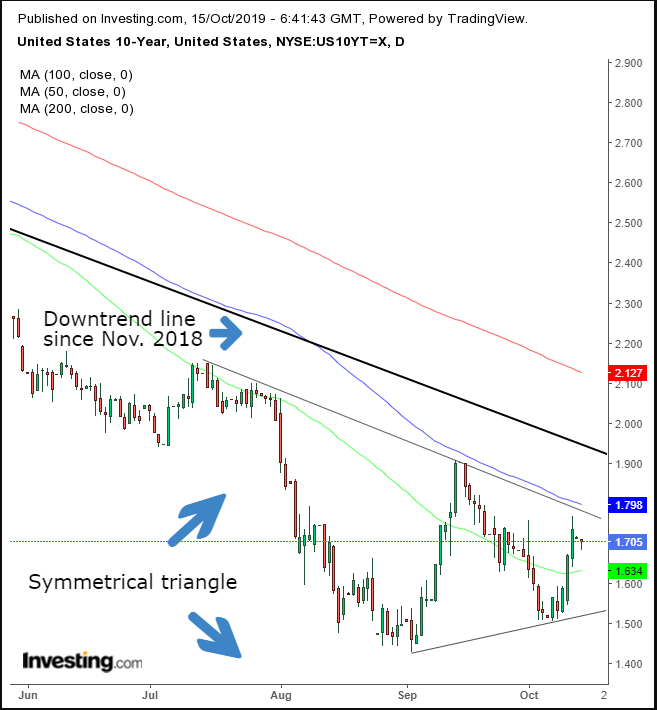
Yields, including for the 10-Year Treasury, fell after the U.S. bond market was closed Monday for the Columbus Day holiday. This after reaching the top of a symmetrical triangle, bearish below the downtrend line since the Nov. 2018 high.

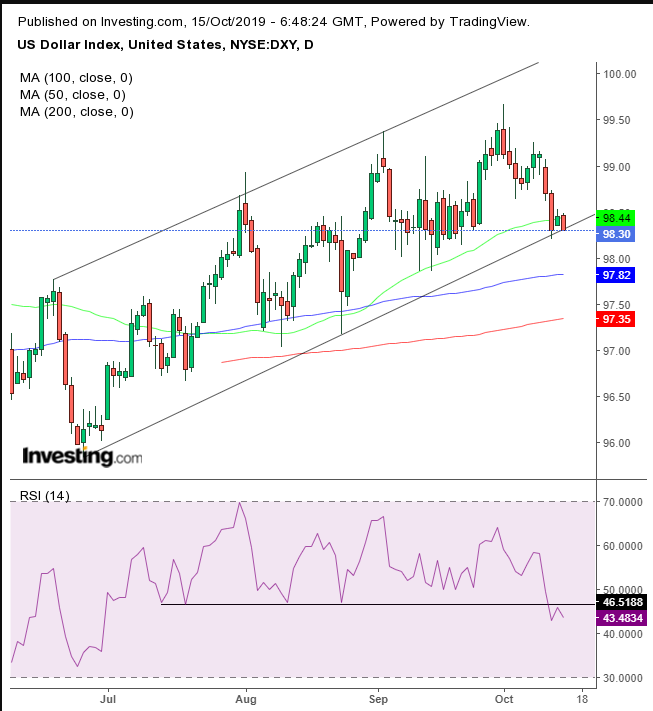
The dollar wiped out yesterday’s rebound and extended its previous two day slide. The greenback found support by the bottom of the rising channel since June. However, the RSI confirmed a resistance after slipping below its support since July 15, suggesting the price support won’t last and the global reserve currency will break out of its rising channel.
The Turkish lira remained stable even after President Trump imposed sanctions on Turkey while sharply increasing tariffs on steel in response to the military operations in Syria.
Focus now turns to U.S. earnings season which begins today with big U.S. banks reporting, including JPMorgan Chase (NYSE:JPM), Goldman Sachs Group (NYSE:GS) and Morgan Stanley (NYSE:MS).
Up Ahead
- The Bank of Korea, releases its latest monetary policy decision on Wednesday.
- U.S. retail sales, also announced on Wednesday, are forecast to increase for a seventh straight month. Consumer spending is carrying the weight of U.S. economic growth so the data will be monitored closely for any signs of slowing.
- China releases Q3 GDP on Friday, along with September industrial production and retail sales data.
Market Moves
Stocks
- Japan’s TOPIX rose 1.56%.
- Australia’s S&P/ASX 200 rose 0.1%.
- Hong Kong’s Hang Seng dipped 0.07%.
- The Shanghai Composite fell 0.56%.
- The Euro STOXX 600 is up 0.38%.
- MSCI's Asia-Pacific Index rose 0.7%.
Currencies
Bonds
- Yields on 10-year Treasury bonds fell three basis points to 1.70%.
- The yield on Australia’s 10-year bond fell about three basis points to 1.01%.
