- U.S. futures, Europe rally on U.S. trade tariff deadline delay
- China’s Shanghai Composite jumps into bull market with 5.6% surge
- Yields climb on risk-on mood; USD slips with Treasurys
- Fed Chairman Jerome Powell delivers semiannual testimony on monetary policy and the state of the economy to House and Senate committees today and tomorrow.
- U.K. Prime Minister Theresa May delayed a 'meaningful vote' on Brexit to before March 12, sparking speculations around a delay on the March 29 final deadline.
- U.S. President Donald Trump and North Korea leader Kim Jong Un are expected to meet for a second summit beginning on Tuesday.
- Macy’s (NYSE:M) reports Q4 results before market open on Tuesday, with forecasts of $2.53 EPS and $2.44 billion revenues. Forward guidance for 2019 will be closely watched after the company cut its full-year earnings expectations last mont, sending the stock further lower.
- U.S. GDP figures come out on Thursday.
- The Stoxx Europe 600 gained 0.27 percent, the highest since October.
- Futures on the S&P 500 climbed 0.4 percent to the highest in more than 15 weeks.
- The MSCI Asia Pacific Index rose 0.7 percent, hitting the highest in more than 20 weeks.
- The MSCI Emerging Markets gained 0.6 percent, reaching the highest in six months on its sixth consecutive advance.
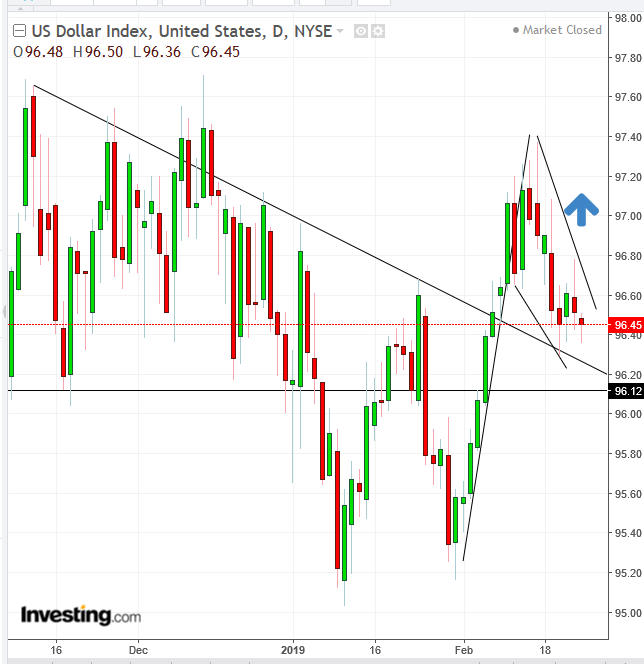
- The Dollar Index slid 0.1 percent to the lowest in almost three weeks.
- The euro edged 0.1 higher percent to $1.1352, the strongest in almost three weeks.
- The Japanese yen ticked less than 0.05 percent higher to 110.67 per dollar.
- The MSCI Intl Emerging Market Currency inched 0.2 percent higher to 1,649.60, the highest in three weeks.
- South Africa’s rand gained 0.7 percent to 13.9039 per dollar, on the largest rise in almost four weeks.
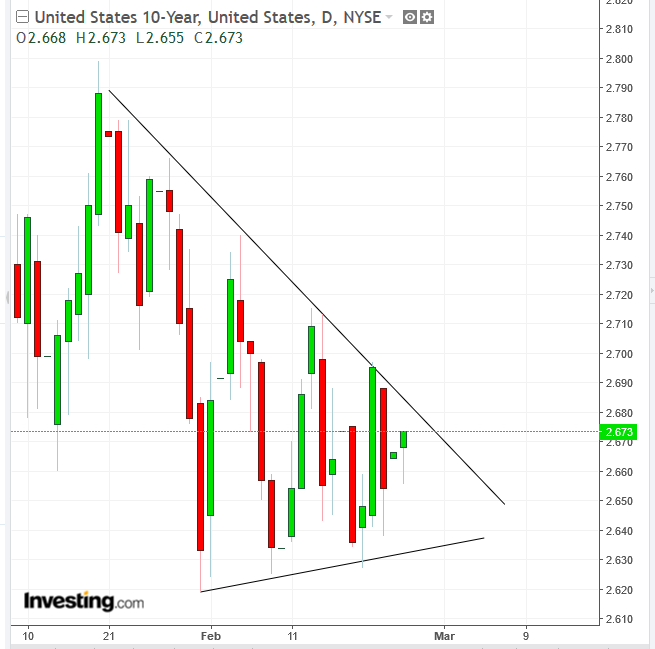
- The yield on 10-year Treasurys increased one basis point to 2.67 percent.
- Germany’s 10-year yield climbed one basis point to 0.11 percent.
- Britain’s 10-year yield gained two basis points to 1.177 percent.
- The spread of Italy’s 10-year bonds over Germany’s fell 10 basis points to 2.6508 percentage points to the narrowest in almost three weeks.
- The Bloomberg Commodity Index gained 0.3 percent, reaching the highest in more than 10 weeks on its sixth straight advance.
- Brent crude slipped 0.2 percent to $67.00 a barrel, the largest fall in two weeks.
- LME copper rose 0.8 percent to $6,531.00 per metric ton, the highest in eight months.
- Gold climbed less than 0.05 percent to $1,329.69 an ounce. The yellow metal could lose some of its safe-haven spark if trade negotiations yield a substantial deal.
Key Events
European shares and futures on the S&P 500, Dow and NASDAQ 100 tracked Asian stocks higher, after U.S. President Donald Trump delayed the dreaded March 1 tariff deadline on Chinese exports. China’s state-run Xinhua news agency, however, later warned against possible new uncertainties in the final stage of U.S.-china diplomatic talks.
The STOXX Europe 600 opened with a 0.18% gap higher, extended the rally to 0.53% but then buckled, paring the advance to 0.27% at the time of writing. Were prices to close at these levels, they would have formed a shooting star and a potential Evening Star, in Japanese Candlestick methodology, or an Island Reversal, in Western technical analysis. Carmakers and materials, the biggest beneficiaries of trade breakthroughs, jumped 1.1%. Banks shares also enjoyed some upbeat gains.
Earlier, during the Asian session, most regional indices rallied across the board, after reports broke of a U.S. tariffs deadline extension.
China’s Shanghai Composite surged 5.6%, the biggest leap in three years, to the highest close since July 15. The price jump was just enough to push the index back into bull market territory, gaining 20.18% since 2018's bottom.
Hong Kong’s Hang Seng, conversely, only ticked 0.5% higher, developing a high-wave doji, as institutional investors remained cautious ahead of earnings releases, in a sign that smart money in the region isn't easily convinced that global dynamics are really shifting. This posture begs the question: what will happen to Chinese shares—and indeed global stocks—if there is no substantial trade agreement?
Global Financial Affairs
Friday saw a broad equity rally help the Dow Jones Industrial Average, NASDAQ Composite and the Russell 2000 seal a ninth consecutive weekly advance and the S&P 500 clinch a fourth straight week of gains.

In bond trading, although the yield on 10-year Treasurys is climbing on risk-on today, it is still within its range since January, with an obvious downward bias. Should the 2.6% level be broken, we could expect yields to retest December lows—an omen for stocks, which hold a direct relationship with yields.

The Dollar Index slipped alongside Treasurys, but was still held up by the support of the broken downtrend line since mid November and the 96.00 level—the November-December double-top neckline.
Up Ahead
Market Moves
Stocks
Currency
Bonds
Commodities
