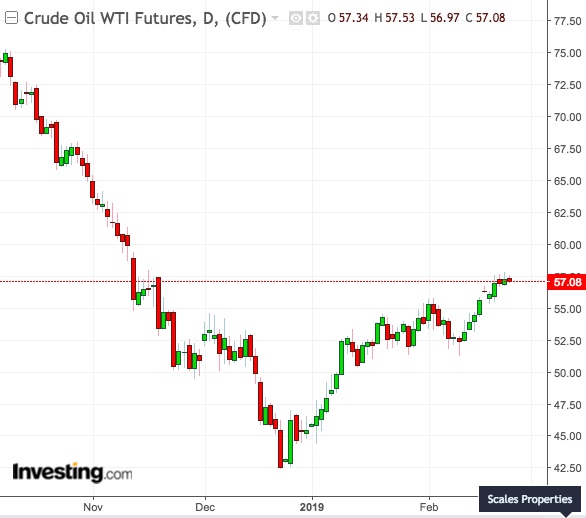
Oil’s rally is unlikely to stop until U.S. crude reaches $60 per barrel and Brent $70. Most seem to agree on that. What is more difficult to gauge is: where will it go after that?
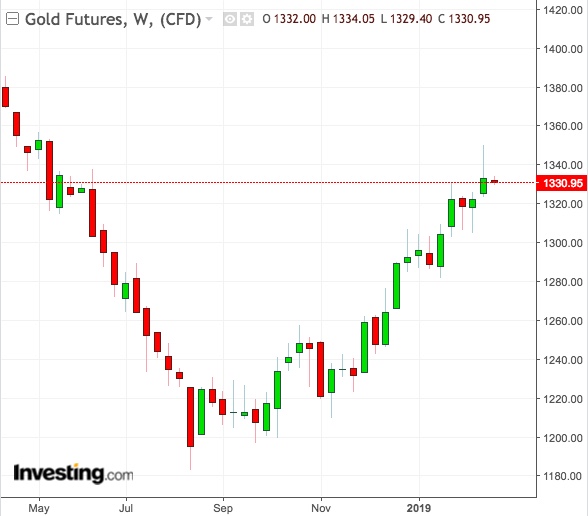
There is also little clarity on what would happen to gold if the U.S. and China agree on a trade deal. Macro analysts think gold futures, which hit new 11-month highs of nearly $1,350 an ounce last week, would lose a chunk of its safe-haven edge in that scenario. However, physical dealers of bullion believe the resulting economic buoyancy will unlock pent-up demand for jewelry.
Will Crude’s V-Shaped Recovery Continue?

As trading in oil settled on Friday, many wondered if its V-shaped recovery would continue as aggressively as the market’s crash in the fourth quarter. The musing came as crude experienced a stunning reversal for a second straight week from the doldrums that had shackled U.S. WTI in the $51-$53 range and U.K. Brent within $61 to $63.
One reason for oil’s explosive performance now is speculation that Washington and Beijing were nearing the end of their trade war, heightened by U.S. President Donald Trump’s meeting with China's Vice Premier Liu He on Friday, on the sidelines of bilateral talks that officials from both sides said were going well.
Yet a resolution to the U.S.-China standoff could be both bullish and bearish to oil and other commodities.
Firstly, a trade deal could come with a large Chinese order of U.S. crude to appease Washington.
Without the hundreds of billions of dollars of tariffs slapped on Chinese goods by the Trump administration, confidence will build again on growth prospects for the world’s No. 2 economy, boosting risk appetite across markets. Beijing might even resort to economic pump priming to hasten its recovery, further fueling investor fervor.
Highs Generated On Oil Could Fizzle
But like all other market euphoria that ultimately fades, the highs generated by a trade deal could also fizzle without commensurate data from China—or, in oil’s case, demand specifically for crude.
U.S. crude production—already the world’s most substantial, at 12 million barrels per day—could continue ramping to overshoot the 13 million bpd forecast for 2020 by this year.
The U.S. output surge could offset OPEC exports cuts led by Saudi Arabia. While U.S. crude is a lighter variant of the heavier oil produced in the Middle East, in the global scheme of things, it’s total supply that will matter, some analysts argued.
As Scott Shelton, energy futures broker at ICAP) in Durham, N.C., observed on Friday, the trade deal could be “the last shoe to drop” on the oil market.
Shelton, one of the more pragmatic bulls in oil, believes some of the hedge funds behind this year's 25% rally in crude are really market neutral over the next three to six months. He said:
"The question is whether or not they will get long."
"Spending another week above the 100-Day Moving Average may generate that as the market confirms the level, but I am dubious about the general macro."
He added:
“I wonder what will be next to drive the bullish rhetoric."
Dubious Commodity Victories
Other analysts raised the specter of hollow victories in commodities being made to sound bigger than they were.
One case in point: Trump’s supporters tweeting excitedly at the weekend about Beijing’s intended purchase of 10 million bushels of U.S. soybeans, when data showed China buying as much as 36 million bushels annually before the trade war began.
South Dakota Governor Kristi Noem said Friday retaliatory tariffs on U.S. commodities like soybeans and wheat wheat from Trump’s tit-for-tat wars with China and the European Union have “devastated” her state’s economy and its large agricultural practice.
Noem added:
“Farmers are used to risk, they’re used to prices going up and down and having that, but this sustained low commodity prices, frankly, is driving a lot of family businesses out of business.”
A More Hawkish Fed After Trade Deal?
For investors in gold, Wednesday will be a big day as Federal Reserve Chairman Jerome Powell makes his semi-annual testimony before a House panel, offering a glimpse of the central bank’s thinking amid winds of change in the global economy.
While minutes from the Fed’s latest policy meeting revealed last week a unanimous vote to pause rate hikes, a reduction in world growth risks may prove a catalyst for change.

Even as precious metals analysts factored in the potential for higher jewelry demand from a recovering Chinese economy, the bigger element for gold—the safe-haven edge kept alive by the trade war—has faded with the likelihood of a deal happening with the U.S. soon.
Stronger Chinese growth forecasts could lift inflation expectations and revisions to global GDP, prompting the hitherto dovish Fed to turn hawkish again.
That might not be too good for equities or, for that matter, gold.
