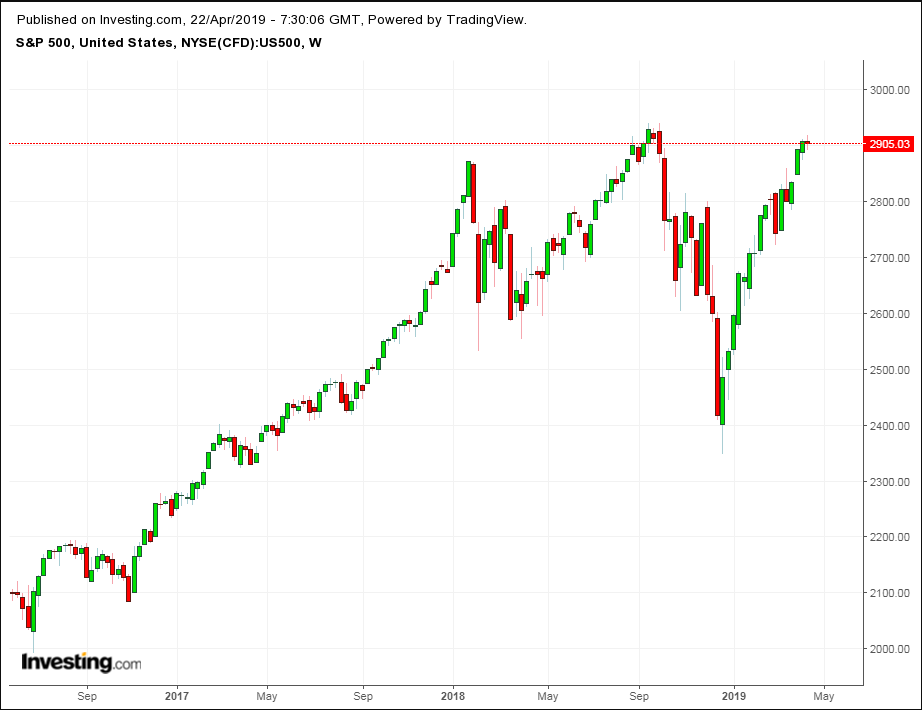
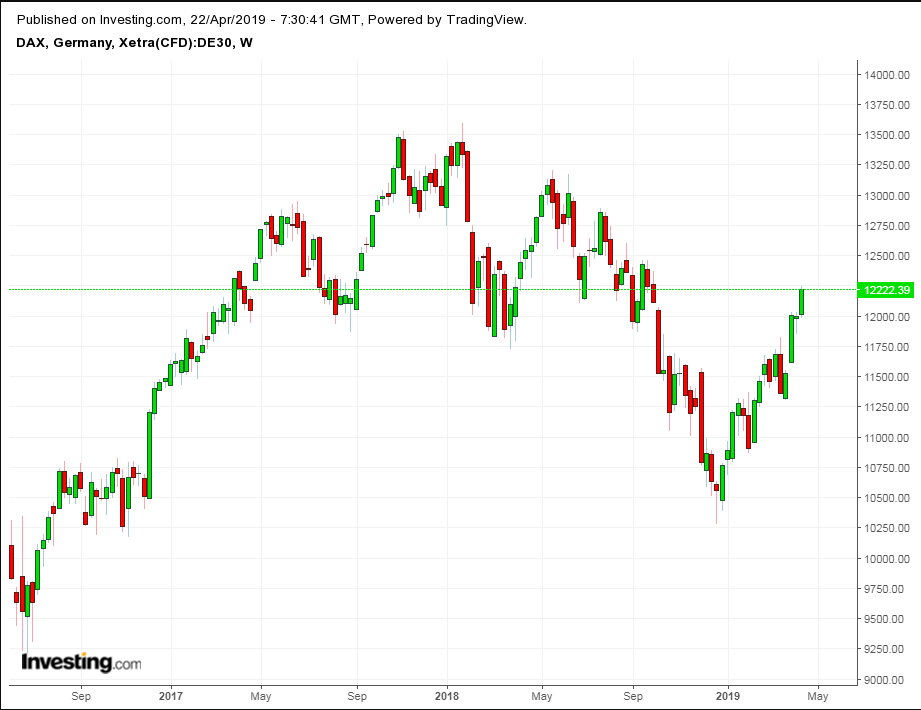
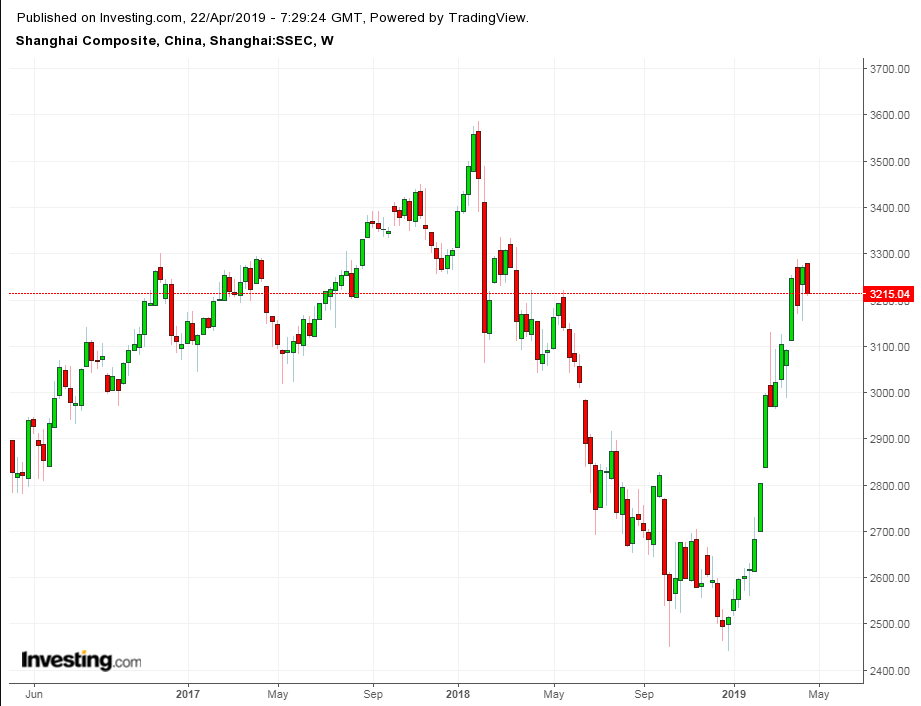
We're a third of the way into 2019 and global as well as domestic stock markets look solid. Most major indices are set to reach new highs—possibly within the next week or two.
But the rebound that began after Christmas has lost some steam. More importantly, however, the fuel that could propel markets well beyond last year's peaks hasn't yet emerged. In addition, political tensions could pull markets lower.
Just about every market enjoyed a big January run-up, in part because investors saw bargains after the ugly slump in the fourth quarter of 2018, the worst quarter for U.S. stocks since 2011. The gains have continued since, but they've been far less dramatic.

In December, the Dow rose or fell 1% on 12 different days; the S&P 500 and the NASDAQ Composite performed similarly on 10 separate days. So far during April, there have been just two such days for the Dow and one each for the S&P 500 and NASDAQ.
Markets in Europe have behaved similarly and are also mostly higher.

Germany's DAX is up about 16%. Despite ongoing Brexit turmoil, Britain's FTSE 100 is up 11%. Japan's Nikkei is up 10.4%. India's Sensex is up 8.5% while Brazil's Bovespa, which is heavily tied to the fortunes of oil giant Petrobras (NYSE:PBR), is up 7.6%.

The one exception to the pattern is China's Shanghai Composite, up 30% this year on continuing reports that the United States and China will finally negotiate a deal to end their ongoing, ugly trade dispute. The Shanghai's gains represent a far better performance than the 25% decline the index saw in 2018.
U.S. Market Sound and Fury, But No Real Gains Since 2017
Any new, big leg up requires a catalyst at least as powerful as the fuel that propelled U.S. stocks 40% higher after President Trump's 2016 election victory: the huge Republican-driven tax cut of 2017.
Unfortunately, that fuel seems spent. In fact, the U.S. stock market has produced much sound and fury since the end of 2017 but for all the noise, hasn't really moved much. The Dow is down 0.7% from its January 2018 peak and off 1.5% from its Oct. 3 peak. The S&P is up 1.1% from the January 2018 peak and off 1.2% from its 52-week high on Sept. 21. The NASDAQ is up 5.4% from a peak in March 2018 and off 1.7% from its 52-week high on Aug. 30.
Yet even if the indices move above last fall's highs, technical factors will generate strong selling pressure.
So, is there a catalyst that could equal the impact of the 2017 tax cut? Maybe.
- Low interest rates. The 10-year Treasury yield is now about 2.5%, down from 2.69% on Dec. 31. The Federal Reserve has said worries about domestic and global growth will probably keep rates in check this year. However, if Friday's strong retail sales report is any indication, the U.S. economy may be stronger than the Fed thought. A few analysts believe the pressure may grow for the Fed to raise rates.
- A China trade deal. Such an agreement is already priced into markets. However, the details of the deal, especially the enforcement mechanisms, could be a big catalyst. If they're absent, investors won't be happy.
- A new wave of megadeals that get Wall Street and institutional investors salivating. Low interest rates would make financing easy. And continued heavy stock buybacks will help put support under stocks.
- Big gains from upcoming tech IPOs, especially Uber (NYSE:UBER), could spread across Techland, unless investors decide a 60% gain since the 2016 election makes the Nasdaq 100 Index too pricey.
Nevertheless, four potentially big headwinds could provide a catalyst of a different sort, and should be watched.
- Brexit is a mess for Britain and the uncertainty is weighing on Europe.
- Oil and gasoline prices are rising, in large part because Saudi Arabia wants to see crude at $80 or higher for to finance its internal economy. Plus, the Trump Administration wants to severely curtail Iran exports, believing that will hinder Iran’s ability to aid terrorist efforts in the Middle East and elsewhere. Crude moved 2.5% higher early Monday after The Washington Post reported that the United States will announce later today that it has told Japan, Turkey, South Korea, China and India that, after May 2, they won’t be able to import Iranian oil without facing U.S. sanctions. West Texas Intermediate, the U.S. benchmark, is now up nearly 45% for the year. Brent is up 37% year-to-date. U.S. retail gasoline prices are up 25% at about $2.85 a gallon, with California gasoline prices above $4, AAA data say.
- Whither the dollar. Relatively stable this year, a move higher for the dollar would make U.S. exports more expensive for foreign buyers and cut into reported profits of U.S.-based companies. As important, crude is priced in U.S. dollars, and a rising USD would be a burden for oil importers.
- The 2020 U.S. election. The campaign began about as soon as the 2016 election ended. As the reactions to the Mueller report over the weekend indicate, there will be a lot of emotional blood spent.
