Investing.com’s stocks of the week
Friday May 25: Five things the markets are talking about
US President Donald Trump’s decision to cancel his summit with North Korea’s Kim Jong-Un yesterday, mentioning Pyongyang’s anger, is expected to keep geopolitics the primary concern for investors and dealers throughout the long weekend in the US.
It’s not a surprise that yesterday’s White House move has provoked a knee-jerk reaction from the various asset classes, including in haven assets such as gold, JPY and CHF.
Stocks are mixed, while US Treasuries and other sovereign bonds have edged higher along with the US dollar as investors navigate a number of political developments from Asia, Middle East and Europe. Crude oil has extended its losses.
In Europe, Spain’s biggest opposition party is pushing for a no-confidence motion against PM Mariano Rajoy, while in Italy, the markets are concerned that the incoming government could sully Italy’s relations with EU.
In the UK, PM Theresa May continues to feel the heat as the EU has dismissed many of the UK’s plans for their post-Brexit relationship.
On tap: This morning, EU finance ministers will discuss the latest on Brexit talks, in Brussels, while stateside, core-durable goods orders are released at 08:30 am EDT.
1. Equity markets trade mixed
Markets have recovered some risk appetite after North Korea offered a “measured response” to the US decision.
In Japan, the Nikkei edged up overnight, supported by large cap stocks, but gains were limited after President Trump cancelled the June 12 summit. Defence-related stocks attracted buying on speculation that geopolitical tensions would rise. The Nikkei share average closed up +0.1%. For the week, the index lost -2.1%, its first weekly decline in nearly three-months. The broader TOPIX dropped -0.2%.
Down-under, Aussie shares edged lower overnight, as declines in materials and energy stocks on lower commodities and oil prices outweighed gains in consumer staples. The S&P/ASX 200 index slipped -0.1% at the close of trade. The benchmark fell -0.9% for the week, its biggest decline since March. In South Korea, the KOSPI pared much of its earlier loss of -0.9% to trade down -0.2%.
In China and Hong Kong stocks edged lower, as sentiment soured after President Trump called off next months planned Singapore summit. The CSI300 index rose +0.1%, while the Shanghai Composite Index slipped -0.1%.
In Hong Kong, the Hang Seng index dropped -0.3%, while the Hong Kong China Enterprises Index lost -0.5%.
In Europe, regional indices have opened broadly higher and continued to move further into positive territory. Nevertheless, geopolitical concerns are keeping risk sentiment low.
US stocks are set to open deep in the ‘black’ (+2.0%).
Indices: STOXX 50 +0.6% at 3,544, FTSE 100 +0.3% at 7,741, DAX +0.9% at 12,976, CAC 40 +0.6% at 5,581; IBEX 35 +0.4% at 10,034, FTSE MIB +0.1% at 22,756, SMI +0.6% at 8,821, S&P 500 Futures +2.0%
2. Oil slips on talk OPEC may lift output, gold prices lower
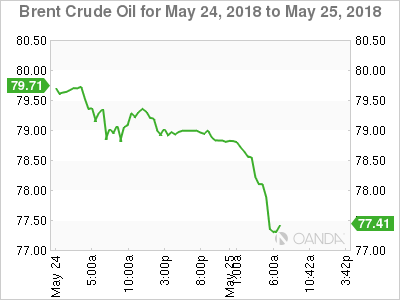
Oil prices remain soft as OPEC and Russia consider easing supply curbs to offset disruptions in Venezuela and an expected drop in Iranian exports.
Brent crude futures are down -44c at +$78.35 a barrel, having hit their highest since late 2014 at +$80.50 this month. US West Texas Intermediate (WTI) crude futures are at +$70.38 a barrel, down -33c.
Market chatter is suggesting that the energy ministers of Saudi Arabia, Russia and the U.A.E are discussing an output increase of about +1m bpd.
Global crude supplies have tightened sharply over the past year because of the OPEC-led cuts, which were boosted by a dramatic drop in Venezuelan production.
Note: Russia and OPEC’s voluntary output cuts have opened the door to other producers to ramp up production and gain market share.
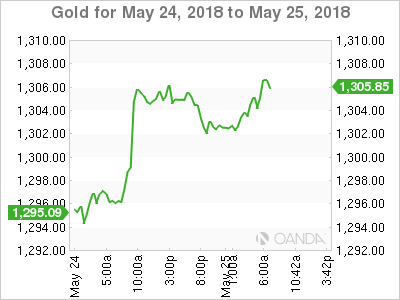
Ahead of the US open, gold prices have eased a tad on profit taking, after breaking above +$1,300 in yesterday’s session on geopolitical worries. Spot gold is down -0.2% at +$1,301.65 per ounce, after climbing nearly +1% Thursday in its biggest one-day rally since early April.
3. Sovereign yields fall on geopolitical worries
Sovereign bond yields have dropped to new monthly lows this week after the US/North Korea summit was cancelled.
The White House announcement yesterday sparked a rush into safe haven assets including eurozone government bonds and the Japanese yen.
Note: German debt was already in demand after Wednesday’s weak Euro PMI’s and both the Italian and Spanish political risk scenario.
The yield on 10-Year Bunds, one of the safest and most liquid have dropped -4 bps to +0.46% – it’s lowest since mid-January. At +2.40%, the yield on Italy’s 10-Year BTP bond is not far from this week’s 14-month high of +2.45%.
In the US, 10-Year yields again have fallen below the psychological +3% (+2.965%) after this week’s Fed minutes showed the central bank plans to stay on a “gradual” path of rate increases even if inflation meets its target. The minutes also showed US officials are still unsure over the degree to which low unemployment will fuel faster wage increases or firmer price pressures.
4. The dollar recovers slightly
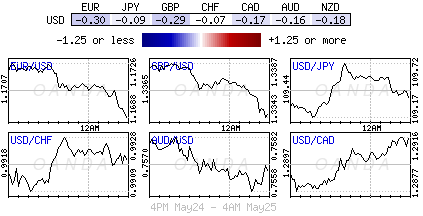
G7 currency ranges remain relatively contained ahead of the bell on Wall Street and the long weekend stateside and in the U.K.
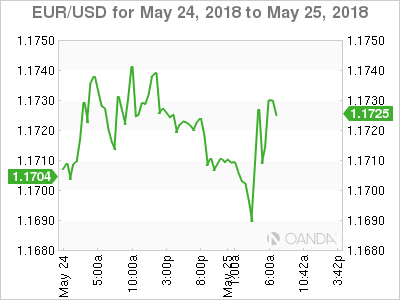
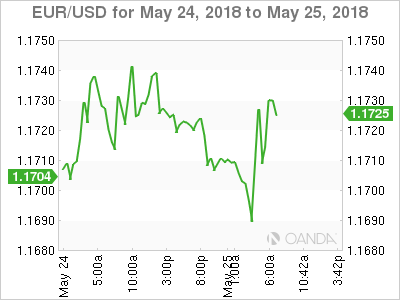
EUR/USD has fallen -0.1% to €1.1706 as the dollar recovers some small gains after yesterday’s safe haven knee jerk. The safe-haven Japanese yen is retracing gains against the dollar as well, with USD/JPY up by +0.2% at ¥109.41.
GBP (£1.3361) continues to remain vulnerable to Brexit negotiations. This week saw the pound trade atop of its five-year low at £1.3304.
Turkey’s lira is heading for its biggest five-day decline since the global financial crisis despite this week’s emergency rate hike. TRY has given up a large chunk of the gains it made after the CBoT raised interest rates by +300 bps on Wednesday, falling -1.1% to $4.7202. The lira has fallen almost -15% so far this month.
5. UK business investment slips in Q1,2018
Data this morning showed that UK business investment posted its weakest quarterly growth in almost three-years in Q1 and more proof of slow economic growth and uncertainty surrounding Brexit.
ONS reported that capital expenditure by British businesses fell by -0.2% in Q1 and marked the sharpest slowdown since Q3, 2015.
Digging deeper, the ONS said that weakening investment in non-residential buildings and structures such as schools, bridges, and commercial buildings was among the key drivers of thaQ1 slip.
Other data reported by the ONS showed that its GDP second estimate for Q1 remained unchanged at +0.1%, with an annualized figure of +0.4% – the weakest quarterly growth for the U.K economy in more than five-years.
