Wednesday May 2: Five things the markets are talking about
Overnight, equities have gained in Europe after they declined in Asia, as many return from holidays to digest the latest earnings reports and shift their focus to today’s Fed rate decision (02:00pm EDT) and trade talks between the US and China.
Currently, the ‘big’ dollar trades under pressure despite US Treasury yields backing up towards the psychological +3% handle once again. Gold prices are higher.
Fixed income dealers are not anticipating a rate increase at today’s FOMC meeting, although they do expect one at the Fed’s next meeting in June. Fed fund futures last put the probability of a June rate increase at +100%. Perhaps, the Fed will become more open to raising interest rates another three times this year? Keep looking for those clues.
Note: Fed Chairman Jerome Powell won’t be holding a press conference after the meeting, and officials are not releasing any new economic projections.
The market is also keeping an eye on the US trade delegation’s trip to Beijing on Thursday – neither superpower wants to lose face.
On tap: US earnings season continues and ADP non-farm employment change (10:15 am EDT).
1. Stocks mixed results
Global stocks dithered overnight, as investors looked for signals ahead of today’s Federal Reserve’s monthly policy statement.
In Japan, the Nikkei share average slipped on Wednesday amid Fed caution and Friday’s US jobs data, although the ‘big’ dollar’s bid against the yen (¥109.82) also helped to stem some of the losses. The index ended the day down -0.16%, while the broader TOPIX dropped -0.15%
Note: Japanese markets will be closed on Thursday and Friday for public holidays.
Down-under, Aussie shares advanced overnight, driven by gains for industrials after Qantas Airways (OTC:QABSY) forecast a record annual profit. The S&P/ASX 200 index rose +0.6%. On Tuesday the benchmark added +0.5%. In South Korea, the KOSPI slipped -0.3%.
In Hong Kong, the Hang Seng fell -0.4% on weakness in real-estate firms and banks. Shares in Hang Seng-listed United Co. Rusal – the worlds number two aluminum company, recently battered by the prospect of US sanctions – had last jumped +10.2%
In China, both the Shanghai and Shanghai composite indexes were down -0.1% after the unofficial purchasing managers index (PMI) data signalled tepid growth in the country’s manufacturing sector last month.
In Europe, regional indices trade higher across the board led by the DAX, which trades over +1% higher following yesterday’s May Day holiday, and positive earnings in the technology sector.
US stocks are set to open in the ‘black’ (+0.1%).
Indices: STOXX 600 +0.7% at 387.6, FTSE 100 +0.6 at 7564, DAX +1.2% at 12765, CAC 40 +0.3% at 5535, IBEX 35 +0.9% at 10069, FTSE MIB +1.0% at 24206, SMI +0.1% at 8896, S&P 500 Futures +0.1%
2. Oil rises on Iran worries, but surging US supplies cap market, gold higher
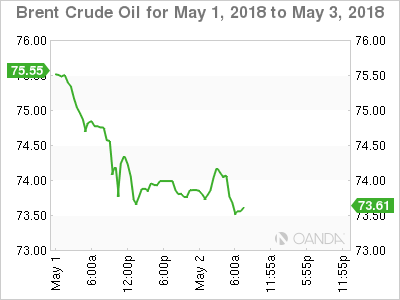
Oil prices have rallied a tad overnight, pushed up by concerns that the US may re-impose sanctions on major exporter Iran, although soaring US supplies is capping gains.
Brent crude oil futures are at +$73.42 per barrel, up +29c, or +0.4% from their last close. US West Texas Intermediate (WTI) crude futures are up +45c, or +0.7%, at +$67.70 per barrel.
Note: US President Donald Trump has until May 12 to decide whether to restore the sanctions on Iran that was lifted after an agreement over its disputed nuclear program.
Capping gains is US inventories – API data yesterday showed inventories rose by +3.4m barrels to +432.5m in the week to March 27.
Note: Rising inventories are in part a result of soaring US production, which has jumped by +25% in the last two-years to 10.6 million bpd, making the US the world’s number two crude oil producer.
More US oil will likely flow as US drillers’ added +5 oilrigs looking for new production in the week to April 27, according to Baker Hughes.
Expect traders to take their cues from today’s EIA report (10:30 am EDT).
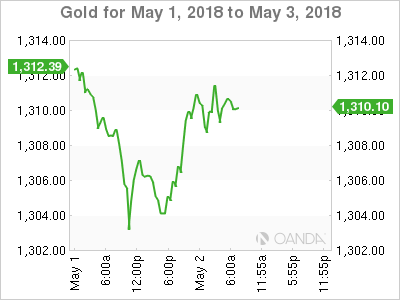
Ahead of the US open, gold prices have rallied overnight, ticking up from a four-month low hit in Tuesday’s session as Chinese buyers returned to the market following the Labour Day holiday. Investors are now waiting for cues on the US monetary policy. Spot gold is up +0.5% at +$1,310.30 per ounce, while gold futures for June delivery has rallied +0.3% to +$1,310.80 per ounce.
Note: Gold fell to +$1,301.51 in yesterday’s session, its lowest since December, 2017.
3. Yields too low in Canada?
In a speech delivered in Yellowknife, in the Northwest Territories, Canada yesterday, the Bank of Canada (BoC) Governor Stephen Poloz said that “the current policy rate is well below the neutral rate” and “that moving too slowly on rate hikes would mean further accumulation of household debt and rising vulnerabilities.”
Note: Canadians owe an average of +170% of their disposable income, up sharply from 20-years ago and largely concentrated in mortgage debt. About +8% of borrowers owe +350% or more of their gross income, which represents one-fifth of overall Canadian household debt.
The Governor is concerned that interest rates are really low compared to anything that could be described as ‘neutral’. He also suggested “forces in the economy suggest that this is not the time to be at neutral.”
Bank of Korea (BoK) April minutes saw one official note that current accommodative policy was “desirable as both internal and external uncertainties arise.” Employment had not improved despite economic growth. Policy makers need to closely watch Sino-US trade dispute.
The yield on US 10-Year Treasuries gained +2 bps to +2.99%, the highest in a week, while in Germany, the 10-Year Bund yield climbed +2 bps to +0.58%, the biggest surge in more than a week.
4. Dollar a tad softer ahead of FOMC
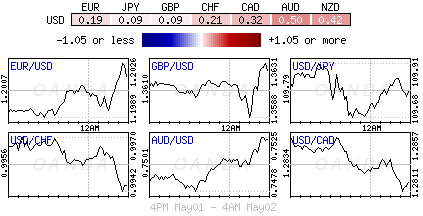
USD saw its initial gains dwindle away as the Eurozone region saw decent PMI Manufacturing data in the session (see below). The greenback has been testing a number of key levels against G10 currency pairs. Focus now shifts to the FOMC rate decision and statement for further guidance on the rate path.
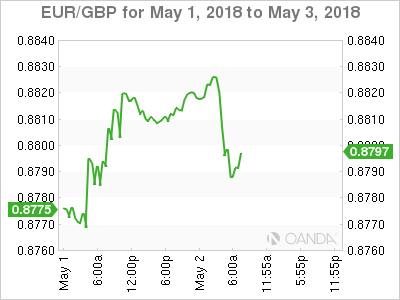
GBP (£1.3652) has moved away from its four month lows with focus on a UK “War Cabinet’ meeting on Brexit as PM Theresa May tries to align her party policy stance. Aiding the pound is this morning’s U.K Construction PMI release (see below), as it moves back into expansion.
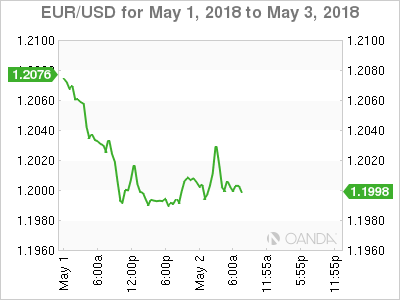
EUR/USD (€1.1997) is testing below the psychological €1.20 level, but has moved off its worst levels of the session after European PMI Manufacturing data was generally better-than-expected and remaining in growth territory.
USD/JPY (¥109.84) is once again encroaching the psychological resistance level of ¥110.
5. Eurozone manufacturing slowed in April
Data this morning showed that Eurozone manufacturing activity slowed down further at the start of Q2, with the composite PMI for the sector slipping to 56.2 in April from 56.6 in March (Beats: Eurozone, France, Spain, Swiss, Norway, Poland; Czech; Misses: Italy, Sweden, Hungary, In-line: Germany).
According to IHS Markit, the outcome for last month marks a slight upward revision from a flash estimate of 56.0 and they commented that “the upturn has lost noticeable momentum” since December’s record high, and incoming survey data “will provide important clues as to the degree to which underlying demand may be waning and the extent to which policymakers should be concerned about the health of the economy.”
Other data from the UK showed that business activity in the UK’s construction sector rebounded in April after hitting a 20-month low in March.
IHS Markit said its purchasing managers’ index for the construction industry rose to 52.5 in April, up from 47.0 in March. Sterling has found its first bid in six-sessions.
Note: It’s the metric’s highest since November 2017.
