Monday March 19: Five things the markets are talking about
This week, the FOMC (Mar 21), the Bank of England and the Reserve Bank of New Zealand (Mar 22) will announce their monetary policy decisions.
Fed officials are expected to weigh whether they will need to raise interest rates more aggressively in the coming months and years because of recent US tax cuts and government-spending increases.
Last December, officials expected that a gradual path of rate hikes would allow the US economy to keep expanding without overheating. Officials penciled in three rate increases for 2018, and two each in 2019 and 2020.
However, fiscal stimulus, coupled with steady growth and low unemployment, is raising questions about how long US officials are expected to maintain that approach.
This Fed meeting is also the first to be led by its new Fed chair, Jerome Powell, who has promised “continuity with the gradual rate rise path” charted by former Chair Janet Yellen.
A +25 bps is already priced in for this week’s FOMC meeting ending Wednesday. Officials will also release updated projections showing whether more of them now favour four rate moves this year rather than three.
Elsewhere, flash March PMI’s will be released for Japan, the Eurozone, Germany, France and the US.
Japan will post last months merchandise trade along with consumer prices. Key data for the UK will include consumer and producer prices and the labor market report will be released.
Finally, the EU leader summit begins on Thursday – EU leaders are to decide if sufficient progress has been made on the UK’s Brexit transition period.
1. Stocks mixed markets
In Japan, the Nikkei share average dropped to a new one-week low overnight as investors responded to opinion polls showing falling support for PM Abe amid a ‘cronyism’ scandal. The Nikkei fell -1.2%, while the broader TOPIX fell -0.9%.
Down-under, the Aussie S&P/ASX 200 was up +0.2%, with the energy sector bouncing +1.5% following Friday’s near-2% gain in oil prices. In South Korea, the KOSPI was down -0.3%.
In Hong Kong, stocks were little changed as investors await Fed Chair Powell’s first press conference on Wednesday. The market is also digesting a slew of new appointments in Beijing, as China forms its new economic team under the new five-year term of President Xi Jinping. At the close, the Hang Seng index was largely unchanged, while the Hang Seng China Enterprise (CEI) lost -0.1%.
In China, stocks ended higher overnight, with gains led by healthcare firms, after Beijing formed a new economic team. At the close, the Shanghai Composite index was up +0.3%, while the blue-chip CSI 300 gained +0.4%.
In Europe, regional indices have started the week on the back foot, following Asian’s mixed session. The DAX and the FTSE 100 are down -1%.
US stocks are set to open deep in the ‘red’ (-0.5%).
Indices: STOXX 600 -0.7% at 375.0, FTSE 100 -1.1% at 7086, DAX -1.1% at 12259, CAC 40 -0.8% at 5239, IBEX 35 -0.7% at 9692, FTSE MIB -0.6% at 22717, SMI -0.6% at 8832, S&P 500 Futures -0.5%
2. Oil prices fall as increased US. drilling points to higher output
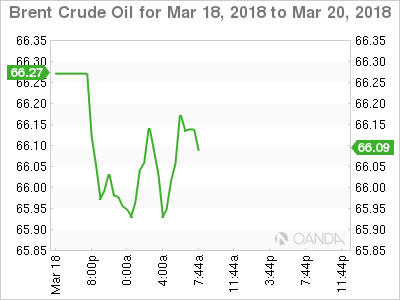
Oil prices are under pressure as increased drilling in the US points to more output, raising concerns about a return of oversupply.
Brent crude futures are at +$65.99 per barrel, down -22c, or -0.3%. US West Texas Intermediate (WTI) crude futures are at +$62.14 a barrel, down -20c, or -0.3%, from Friday’s close.
According to Baker Hughes drilling report on Friday, US drillers added four oilrigs in the week to March 16, bringing the total count to 800.
The US rig count is much higher than a year ago, as energy companies have boosted spending – US crude oil production has risen by more than a fifth since mid-2016, to +10.38m bpd, pushing it past top exporter Saudi Arabia.
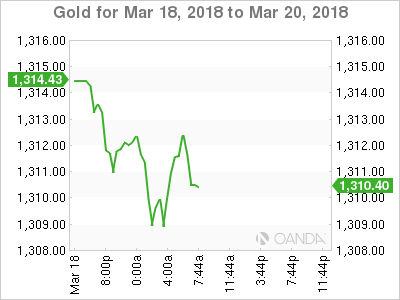
Ahead of the US open, gold prices are under pressure for a fourth consecutive session, as the ‘big’ dollar stays firm ahead of Wednesday’s Fed rate announcement. Spot gold is down -0.2% at +$1,310.03 per ounce – prices fell to +$1,307.51 earlier in the session, their lowest since March 1.
3. Central banks take center stage for bonds
The fixed income market will be looking at a series of policy events and data for guidance this week, while sovereign supply is muted.
Bond traders await the US Fed’s decision on Wednesday, when a +25 bps rate raise is expected. Thursday sees rate decisions for the UK, New Zealand, Indonesia and the Philippines.
The BoE is expected to keep interest rates unchanged at +0.5%. The decision is expected to be “unanimous,” but any dissenting vote to raise rates would strengthen ideas of a rate increase in Q2. The market is currently pricing in a little more than +66% chance of a BoE rate increase in May, with the odds drifting higher over the past couple of weeks.
As for bond yields in the eurozone, underlying support from the ECB in the form of asset purchases continues to limit the upside in euro yields. Germany’s 10-year Bund yield trades at +0.57%, while in the UK, the 10-year Gilt yield has backed up +2bps to +1.429%, the biggest increase in almost two-weeks. The yield on US 10s have advanced +2 bps to +2.87%, the highest in more than a week.
4. Dollar starts the week supported
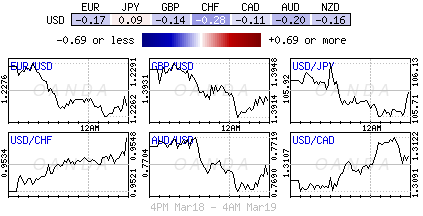
The USD starts the week on firm footing as the first FOMC meeting under Chair Powell takes place mid-week with expectations that US policy makers would hike +25 bps and deliver a ‘hawkish” statement.
This is expected to be a big week for sterling (£1.4000) and Brexit. EU leaders gather on Thursday to begin a two-day Summit to decide if sufficient progress has been made on the transition period that the next and last chapter – the new relationship – could be addressed. BoE meets on Thursday and the market will focus on the minutes and the vote of the decision.
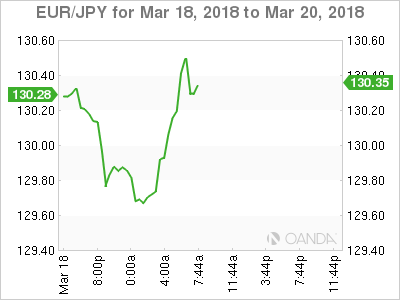
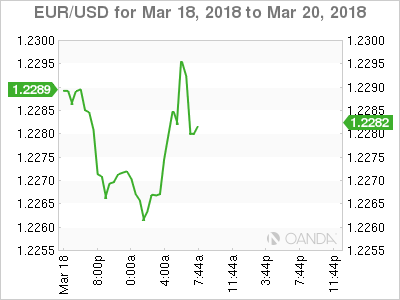
EUR/USD (€1.2291) is holding below the psychological €1.23 print as more ECB members (Weidmann, Knot and Villeroy) over the weekend expressed confidence that the +2% inflation target would be achieved in the medium term.
Elsewhere, the yen has climbed +0.1% to ¥105.93, the strongest in more than two-weeks, while South Africa’s rand (ZAR) sank -0.6% to $12.0421, the weakest in more than five-weeks.
5. Eurozone exports slide
Data this morning showed that the eurozone’s exports of goods to the rest of the world fell in January as a strengthening EUR may finally be weakening economic growth.
The EU statistics agency said that, adjusted for seasonal variations, exports fell -0.7% in January from December, while imports rose by +1.1%. That resulted in a drop in the seasonally adjusted trade surplus to €19.9B from €23.2B in the final month of 2017.
Note: Without seasonal adjustment, the eurozone recorded a surplus of +€3.3B, having recorded a deficit of -€1.4B in January 2017.
Eurostat said the EU’s trade surplus with the US widened to +€10.3B from +€9.7B a year earlier.
