“Fool me once, shame on you; fool me twice, shame on me.” Well guess what? The S&P 500 futures fooled everyone again. The VIX popped above 13 earlier this week, and the S&P 500 futures were down 28 handles. Margin calls were going out and the S&P was ‘breaking down’. The bears were back, and the end of the world was coming. Well, that’s what they wanted you to think, but in the era of non-stop quantitative easing, that’s not how it works.
After one of the most eventful sessions of this year on Wednesday, the S&P 500 futures returned to the new normal of a slow steady grind. On the 8:30 am cst open the ESZ printed 2561.75, up 3.25 handles, and made an early morning high of 2563.25, before selling off down to 2557.25 in the first hour. From there, the futures rallied up to a high of day at 2565.00, matching Wednesday’s high, just after 10:00 am cst.
The small morning range turned to almost no range going into midday and early afternoon, as the futures maintained the tight morning range before pushing to a new low as the futures session was nearing the close down to 2555.50. The ES rallied in the closing moments to settle at 2561.00 up 2.5 handles on the day. After the bell, Google’s parent company Alphabet (NASDAQ:GOOGL) posted a 33% profit of $6.7 billion on its growth in its ad business, and the ES popped up to 2563.35 in the aftermarket.
For most of the day, the total range was 7.5 handles. I don’t know how things go from hot, and then so cold, but that’s how things work in these futures markets right now. The VIX made a low at 10.60 yesterday, and settled at 11.30, up +0.06 points or up +0.62%. With all the economic and earnings reports, it seemed like the index markets were on some type of overload.
In the end the S&P 500 futures (ESZ17:CME) settled at 2561.50, up +3.00 handles, or +0.11%; the Dow Jones futures (YMZ17:CBT) settled at 23349, up +48 points, or +0.20%; the Nasdaq 100 futures (NQZ17:CME) settled at 6084.75, up +20.25 points, or +0.33%; and the Russell 2000 (RTYZ17:CME) settled at 1499.60, up +1.60 points or +0.10% on the day.
November Outlook: October Surprise Just About Averted
From Stock Traders Almanac:
With three days left in the historically scary month of October for markets it looks like we will sidestep October’s penchant for volatility and sharp negative market surprises. On top of the banner “Worst Six Months” that are about to come to a close this continuing upside momentum bodes well for the next “Best Six Months” and 2018 until something shocks the system.
This market is so robust at the moment that it will likely take some systemic market event. Perhaps it will be triggered by a run in the mushrooming ETF arena, Federal Reserve tightening, a new major international conflict, a breakdown in the US or other major economy, or something on the geopolitical front. 2018 is a midterm year and it is already getting hot in DC.
Midterm mudsling will ramp up early next year and if the Trump Administration and Congress have failed to deliver, an impatient electorate could dethrone GOP control of Congress, upsetting Wall Street. Additionally, any disruptive legislation that changes the playing field could cause market participants to readjust and rock financial markets.
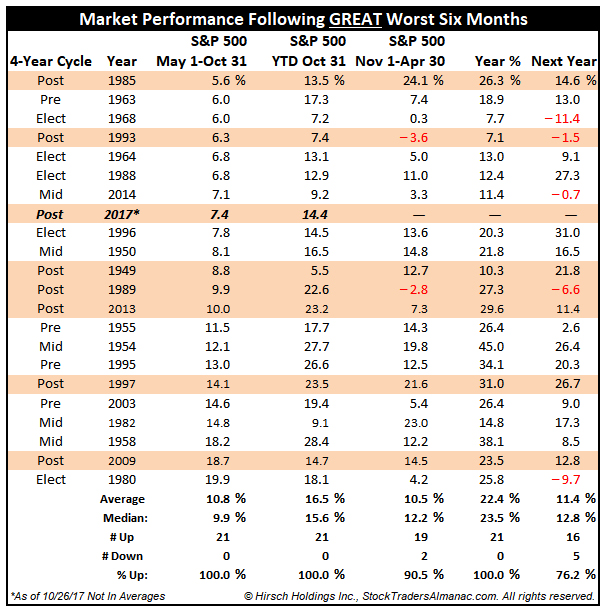
But for now all is well. Last month we showed you how Great Worst Six Months are usually followed by above average Best Six Months, full-year gains, as well as strong following years. Well, this current WSM has advanced even further into “Great” territory. Last month the S&P 500 was up 5.3% for the WSM so far. As of today’s close S&P is up 7.4% for the current WSM.
In the chart below we added year-to-date performance for perspective. By almost all accounts this year’s combination of a Great WSM and YTD gains will likely beget further gains. The only blemishes on this chart are 1968-69, 1981-82, and 1989-90.

Vietnam and the bear market that lasted from December 1968 to May 1970 put the squeeze on stocks in 1968 and 1969. Reagan’s recession and a bear market in the wake of reigning in high interests, inflation and dysfunctional government battered markets in 1981 and 1982. The markets responded negatively in 1990 when the first President Bush reneged on his 1988 campaign promise not to raise taxes and Gulf War I consumed the psyche of the planet.
But the news is good for now and we remain optimistic for further gains through yearend and into early next. When we get our Best Six Months Seasonal MACD Buy Signal we will shift our bias more bullish. MACD and other indicators have or are on the brink of rolling over to sell signals. So we are not entirely out of woods yet and we are still vulnerable to some Octoberphobia and a pullback of some degree before the WSM, or year, is over.
After that, expect the next BSM to be stronger than average after a great WSM. Then we look for a continuation of the rally into and through yearend. But starting in Q1-Q2 next year we begin to get concerned with the extended valuations and length of this bull market and the bearish tendencies of midterm election years, and what promises to be overarching monetary policy and geopolitical risk.
While You Were Sleeping

Overnight, equity markets in Asia traded mixed, with a slight bias to the upside, and were led by the Nikkei, which closed up +1.24%. In Europe, stocks are trading higher this morning, with the French CAC leading the way at +0.74%
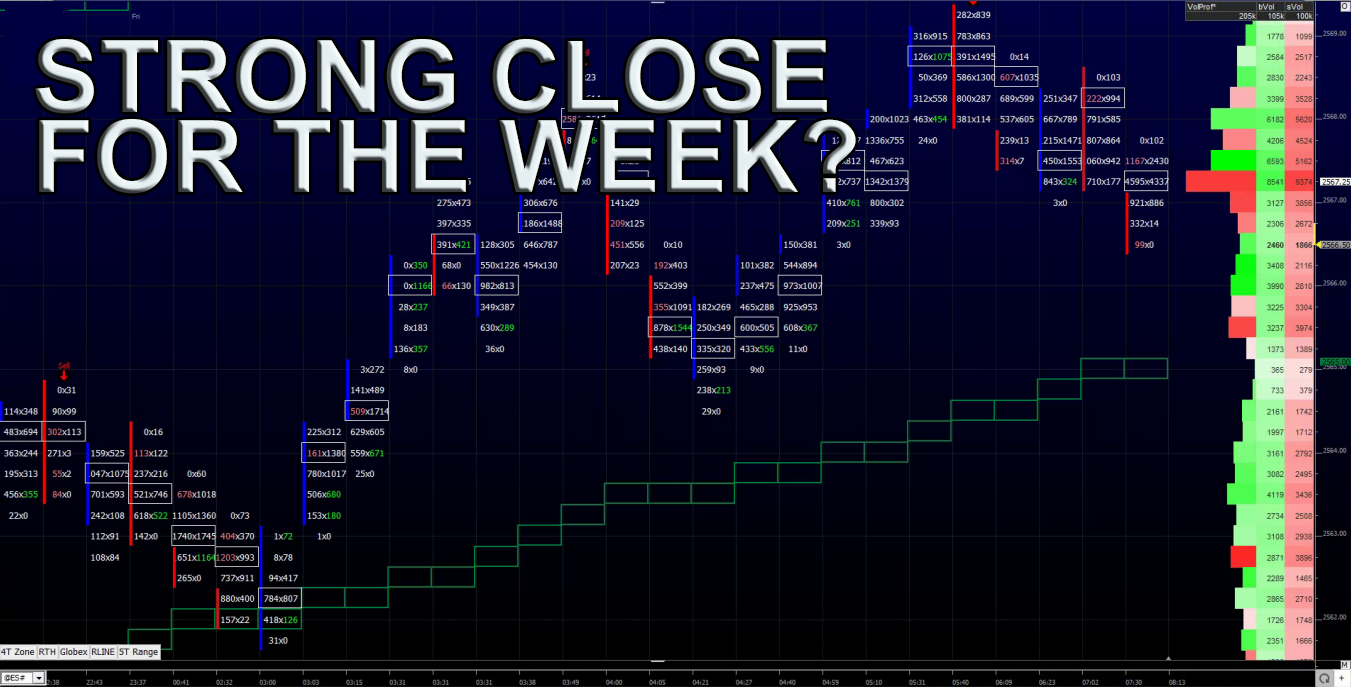
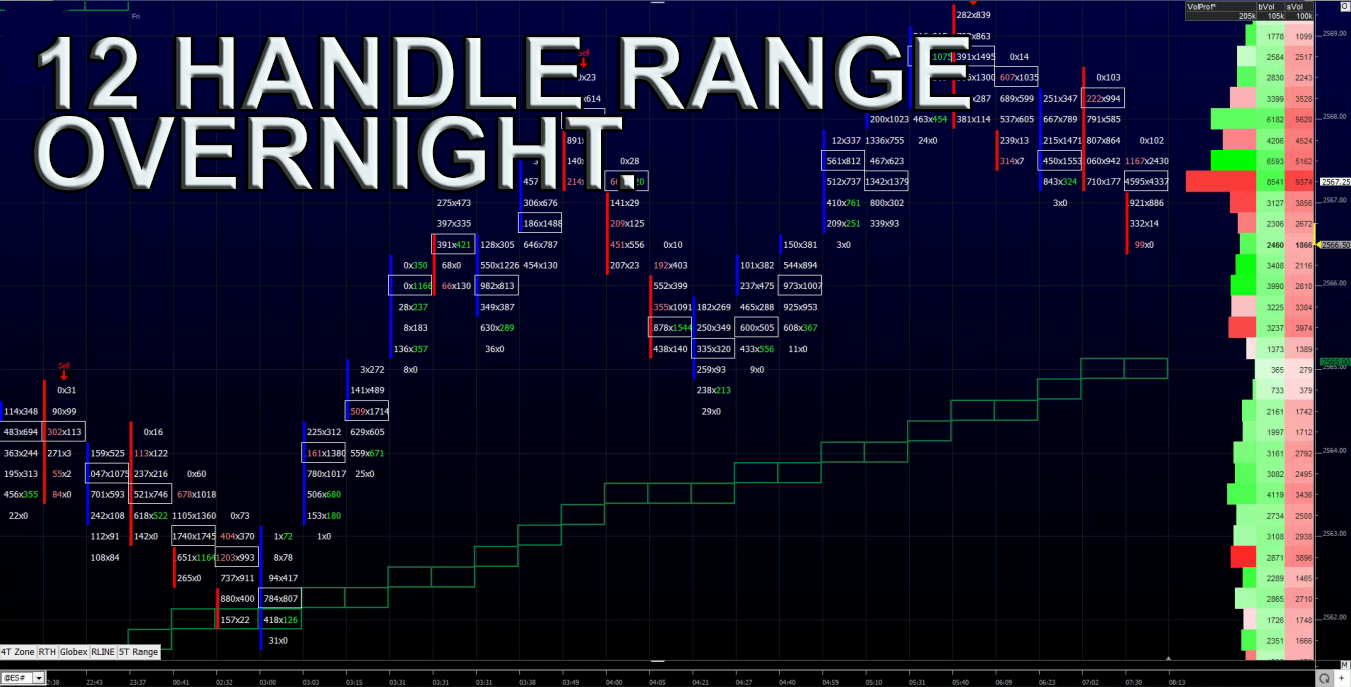
In the U.S., the S&P 500 futures opened last night’s globex session at 2561.50, and made some pretty decent moves overnight. By 7:45 pm cst, the low was made at 2557.50, and the ES never looked back. By 9:30 pm, the ES had printed 2564.75, then a sideways, 3 handle range grind start, which lasted until 2:30 am cst. After another leg higher, the ES had printed the overnight high of 2569.25 at 4:45 am. As of 7:15 am cst, the last print in the ES is 2566.50, up +5.00 handles, with 193k contracts traded.
In Asia, 7 out of 11 markets closed higher (Shanghai +0.26%), and in Europe 11 out of 12 markets are trading higher this morning (FTSE +0.18%).
Today’s economic calendar includes Friday: Data — GDP (8:30 a.m. ET), Consumer Sentiment (10:00 a.m. ET), Baker-Hughes Rig Count (1:00 p.m. ET); Earnings — Merck (NYSE:MRK) & Co. (6:45-7:00 a.m. ET), Phillips 66 (NYSE:PSX) (7:00 a.m. ET), Shire (7:00 a.m. ET), Colgate-Palmolive (7:00 a.m. ET), AbbVie (7:45 a.m. ET), Exxon Mobil (NYSE:XOM) (8:00 a.m. ET), Chevron (NYSE:CVX) (8:30 a.m. ET).
Three Carrier Strike Groups Are Now Operating Within Reach of North Korea
Our View: Well, so ends the busiest week of the 3rd quarter earnings reports. It was, as I said, up a day / down a day. I am not sure what we can take away from the week, other than we saw a decent drop and a decent bounce back. Volume did pick up, and there was increased volatility, but then things slowed yesterday and the VIX dropped down into the 10 handle. Personally, I don’t think the markets are going to go down much, but the U.S. now has three aircraft carriers operating in the Pacific Ocean. I do not think President Trump is going to attack, but I don’t doubt Kim Jong Un could do something provocative during Trump first visit to Asia, which goes from November 3 to 14. Our view is for higher prices. You can sell the gap higher open, or the first rally above, or just be patient and buy the weakness.

