Thursday April 19: Five things the markets are talking about
Euro equities are struggling for traction after two consecutives session of gains while Far East bourses rallied to new monthly highs on investor optimism over global growth. Most commodities prices have gained as metals including aluminum and nickel extended their rally.
Sovereign yields are somewhat steady after three day’s of backing up. The market is talking about the possibility of an inverted US yield curve in the coming quarters.
In FX, the yen saw some selling pressure as US President Donald Trump and Japanese PM Shinzo Abe agreed to work closely on bi-lateral trade.
On the geo-political front, there have been some tentative signs of dissipating this week. The US has indicated it has laid the ground works for direct talks with North Korea and even Russia’s President Vladimir Putin is believed to be seeking to “dial down” tensions with America.
1. Stocks mixed session overnight
In Japan, the Nikkei reached a new seven-week high on relief over US/Japan summit outcome. Steelmakers – one of the worst performers since Trump announced steel and aluminum tariffs – led the gains. The Nikkei ended up +0.15%, while the broader TOPIX rallied +0.03%.
Down under, Aussie stocks rallied for a fifth straight session overnight as a rally in commodity prices drove up resources stocks. The S&P/ASX 200 index rose +0.3%. In Korea, the KOSPI rallied +0.25%.
In Hong Kong, stocks ended higher on Thursday, led by energy shares, after oil prices hit new four-year highs (see below). The Hang Seng index closed +1.4% higher, while the China Enterprises Index closed up +2.1%.
In China, robust energy and commodity prices supported stocks. The blue-chip CSI300 index ended +1.2% higher, while the Shanghai Composite Index gained +0.9%.
In Europe, regional bourses trade mixed following mixed earnings, rising crude oil prices and weaker UK retail sales data (see below). The FTSE 100 continues to outperform supported mostly by a weaker pound sterling (£1.4197).
US stocks are set to open in the ‘red’ (-0.2%).
Indices: STOXX 600 -0.1% at 381.5, FTSE 100 +0.2% at 7329, DAX -0.2% at 12566, CAC 40 +0.1% at 5382, IBEX 35 -0.1% at 9850, FTSE MIB -0.1% at 23739, SMI -0.1% at 8826, S&P 500 Futures -0.2%
2. Oil at fresh highs on Saudi seeking price hike, gold higher
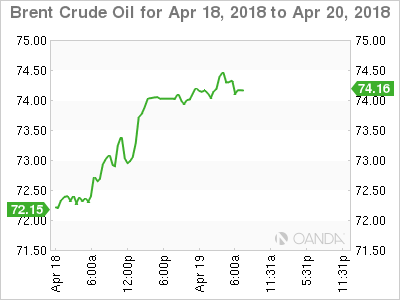
Crude oil prices trade atop of their four year highs as US inventories declined, moving closer to five-year averages, and after rumblings that Saudi Arabia is seeking to push oil prices higher.
Brent futures are at +$74.35 per barrel, up +87c from Wednesday’s close, while US West Texas Intermediate (WTI) crude futures have rallied +71c to +$69.18 a barrel.
Note: Brent crude oil futures have rallied as high as +$74.44 a barrel, the strongest since Nov., 2014, the day that OPEC decided to pump as much as it could to defend market share, sending the price to a low of $27 just over a year later.
OPEC and its partners will meet in Jeddah, Saudi Arabia, tomorrow and then again on June 22 to review its oil production policy.
Reuters reported yesterday that the Saudi’s would be happy to see crude rise to +$80 or even +$100 a barrel, which may suggest that Riyadh will seek no changes to the supply-cutting deal.
Also supporting prices are current US inventory reports. The EIA yesterday reported commercial crude stocks falling by -1.1m barrels in the week to April 13, to +427.57m barrels, close to the five-year average level of around +420m barrels.
The US is also expected to will re-introduce sanctions against Iran, OPEC’s third-largest producer, which could result in further supply reductions.
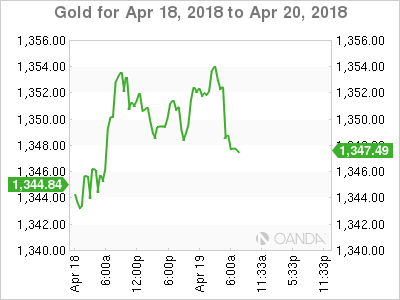
Gold prices have rallied for a fifth consecutive session, supported by a rally in base metals that has fuelled concerns of inflationary pressures. Ongoing US-China trade tension is also lending further support. Spot gold has risen +0.3% to +$1,353.22 per ounce, while US gold futures have rallied +0.2% to +$1,356.30 per ounce.
3. Yields push up to multi week highs
In yesterday’s US Beige Book economic report, the US Fed said “continued growth in US economy is evidenced by robust business borrowing, higher consumer spending, and tight labor markets.”
On the back of this, US government bond prices weakened, pushing the 10-Year yield up +5 bps to +2.867%, its biggest one-day climb in two-months.
Elsewhere this morning, spreads between the bonds of EU periphery and German Bunds are trading a tad narrower ahead of the US open and the most tightening posted by Italian spreads.
Italian BTP’s continue to benefit from the positive economic environment and benign realized volatility. The 10-year Italian BTP/German Bund spread has tightened -1.4 bps to +118 bps, while Spanish/German and Portuguese/German 10-year bond spreads are both tighter by about -1 bps, at +68 bps and +107 bps respectively.
4. Dollar supported by higher yields
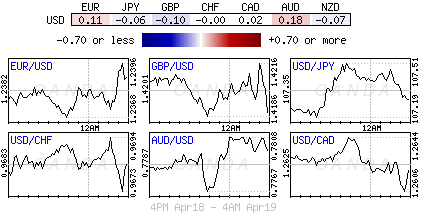
The USD is a tad firmer against its G10 currency pairs as US sovereign yields back up to new one-month highs.
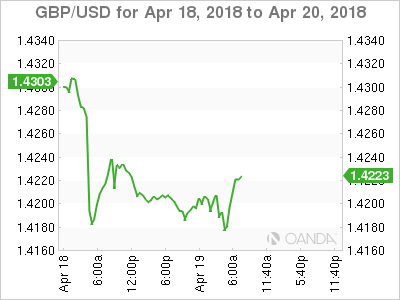
GBP/USD (£1.4197) is lower by -0.3% outright after another disappointing round of data. Retail sales data missed across the board (see below). The pound began the session trying to recoup some of yesterday’s losses, which was supported by softer wage and inflation headline prints. Fixed income traders are beginning to price out the odds of a second BoE hike this year – a hike is priced in for next month.
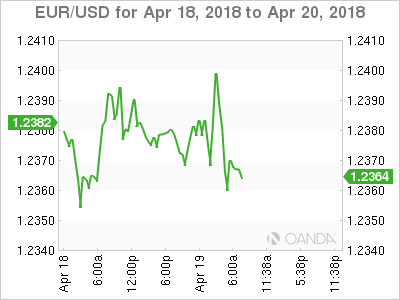
Both the Euro and JPY outright continue to trade in their contained ranges. EUR/USD is trading at €1.2365 ahead of the US open, while USD/JPY trades atop of ¥107.42.
Down-under, AUD (A$0.7793) did see some volatility in their session after Aussie employment rose less than forecast in March, suggesting that the Reserve Bank of Australia (RBA) will need to keep interest rates on hold.
5. Sales miss hits UK growth
UK data this morning showed that retail sales slumped last month during a spell of bad weather, adding to signs that the economy got off to a slow start in the Q1.
Retail sales fell -1.2% in March compared with February, with large declines in categories including food, clothing and household goods.
Digging deeper, gas sales were hit particularly hard as poor weather affected travel.
In total, Q1 reading of retail sales fell -0.5% compared with Q4, 2017. The poor performance is expected to shave -0.03% off GDP for Q1.
Note: The UK economy is expected to lag its Euro partners in 2018 as uncertainty over the terms of its future relationship with the EU weighs on activity and investment.
Today’s softer headline print will further diminish market expectations of a second Bank of England (BoE) hike in 2018 – they are still seen hiking next month.
