Wednesday August 31: Five things the markets are talking about
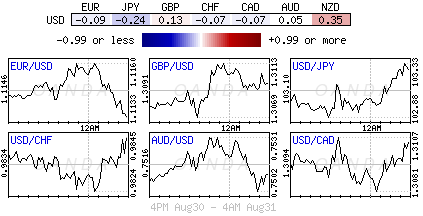
Is the dollar getting ahead of itself? As a ‘hawkish’ Fed justifies the dollar’s positive price action, one gets the feeling that the moves over the past three-sessions may be becoming a tad stretched.
Fed officials have indicated that a near-term decision on interest rates depends on data remaining strong. That next data point is Friday’s U.S payrolls.
With markets buying into the idea that Fed hikes will be decided independently, rather than with the regularity of a normal cycle, one would have expected that the dollar’s rise would be somewhat muted rather than what we have seen this week.
Don’t be surprised to see more of the weak dollar shorts exiting their positions if they believe this morning’s ADP non-manufacturing employment print (exp. +174k) is going to have a positive effect on this Friday’s payroll headline.
1. Stocks look for direction
The Stoxx Europe 600 gyrates between gains and losses in early trade, the FTSE 100 is flat, while futures prices point to a small opening loss for the S&P 500, extending yesterday’s declines.
Markets in Asia were mixed. Bourses in Hong Kong and Australia followed Wall Street lower, while Japanese shares eked out gains as the yen fell against the dollar, benefiting the country’s exporters.
In Europe, banks are heading for their best monthly performance in 18-months, supported by earnings that beat analysts’ estimates for the first time in a year.
Indices: Stoxx50 +0.4% at 3043, FTSE little changed 6,823, DAX -0.1% at 10,648, CAC 40 +0.5% at 4,481, IBEX 35 +0.7% at 8,750, FTSE MIB +0.7% at 17,012, SMI +0.1% at 8,245, S&P 500 Futures -0.02%
2. Commodities under pressure from dollar
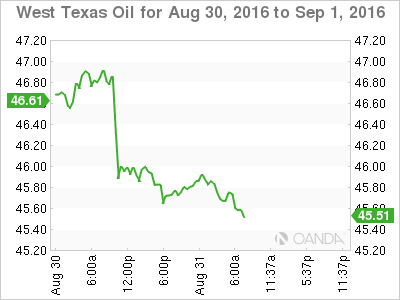
The crude oil slid continues this morning, pressured by a strong dollar and high stocks of physical oil. Despite this week’s pullback, ‘black gold’ is on track for a monthly gain of more than +10%.
Brent crude oil futures are trading at +$48 per barrel down -37c overnight, while West Texas Intermediate (WTI) crude futures are down -21c at +$46.14.
It seems the market is happier to focus on fundamentals rather that a “what if” OPEC/producer deal being achieved next month.
Yesterday’s API data revealed that U.S. crude stocks rose by +942k barrels to +525.2m in the week to Aug. 26. Expect this morning’s official U.S. oil inventories data from the Energy Information Administration (EIA) to influence crude prices next move.
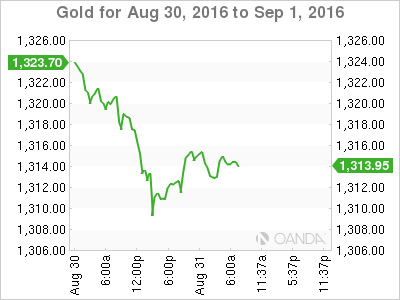
Bullion is on track for its first monthly decline since May. Gold ($1,312.55) is trading atop of its two-month lows touched yesterday as investors wait Friday’s payroll numbers for clues on the timing of the Fed’s next rate hike.
3. Yields return to pre-Jackson Hole levels
The U.S. yield curve remains relatively flat this morning amid light trading as investors continue to digest Fed officials remarks this week.
The yield on the benchmark 10-Year Treasury note was +1.58%, compared with +1.576% Tuesday. This month, U.S 10’s have backed up +12bps, the most in 12-months.
Despite U.S front yields rallying, the market remains reluctant to price in a high probability of a Fed rate hike as soon as September 21.
If Friday’s U.S payroll number happens to surprise to the upside (+200k), investors should expect a significant rise in short-term yields to pave the way for a rate hike possibility next month.
Currently, investors’ expectations of a rate increase are right where they were last Thursday, before Ms. Yellen’s speech and Mr. Fischer’s “hawkish” comments at Jackson Hole. Dealers now see a +24% chance that the Fed will raise rates at its September meeting and a +57% chance of an increase by December.
4. Scandis FX in focus
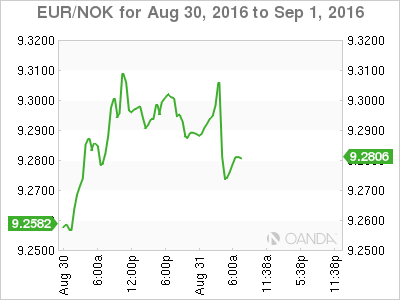
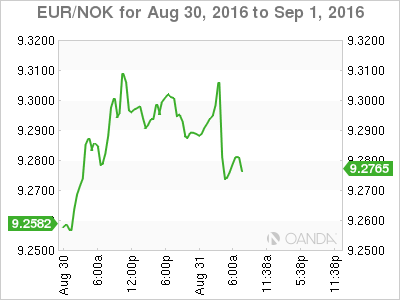
Data this morning showed that Norway’s economy posted growth of +0.4% in Q2 up from +0.3% in Q1. Analysts are suggesting that Norway’s drawn-out slowdown may now be coming to an end as the GDP figure indicates that growth may have reached the bottom. Digging deeper, both construction and the services sector grew at a healthy pace. The headline print beat Norges Bank expectations and probably strengthens the case for unchanged interest rates in September.
The stronger result supports the krone, EUR/NOK is trading down -0.3% at €9.27, compared with €9.30 before the data.
Elsewhere, Sweden’s “think tank” NIER updated its economic forecasts. They have cut their growth outlook for 2016 and 2017. This year’s GDP forecast is cut from +3.6% to +3.3% and 2017 from +2.1% to +2.0%. It has also raised 2016 CPI from +0.9% to +1.0%, while maintaining 2017 CPI at +1.4%.
5. Dollar at one-month highs
Despite month-end trading keeping participation to a minimum, the ‘mighty’ dollar continues its stellar performance this morning, rising to a one-month high against its G10 peers as investors continue to assess the outlook for U.S. rate normalization policy this year.
Ahead of the U.S open, the dollar is trading north of the psychological ¥103 handle, while the EUR (€1.1147) remains under pressure, mostly sterling cross related (€0.8473). The pound is outperforming other currencies following data this morning suggesting that the U.K. economy was weathering the post-Brexit period well.
