Summary: US equities continue to make new all-time highs each week, supported by strong equity fund inflows and macro data that has exceeded expectations. Surprisingly, equities outside the US are actually outperforming the S&P. The current trend is very extended and there are four notable headwinds that may impact equities in the weeks ahead. There is, conversely, a favorable set-up in the bond market.
On Friday, SPX, DJIA, COMPQ and NDX all made new all-time highs (ATH). During the week, RUT and NYSE also made new ATHs. All indices moving to new highs together suggests that this is a broadly based rally.
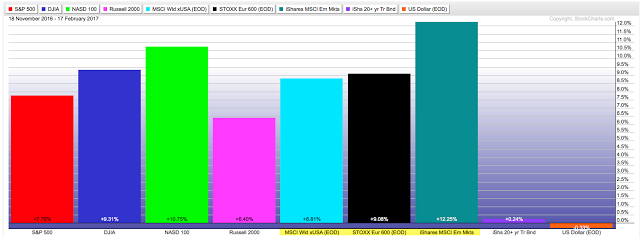
The equity rally is broad in another sense as well. In the past 3 months, markets outside the US have outperformed the SPX. Europe (via STOXX 600) and emerging markets (via iShares MSCI Emerging Markets (NYSE:EEM)) have led, and the World ex-US index has gained 9%. In the US, the NDX is leading.
Turning back to the US, all of the moving averages, from 5-d to 200-d, are rising for each of the main indices. This is the definition of an uptrending equity market. SPX has been stair stepping higher since last summer. 2250-80 is the first level of big support (top line).
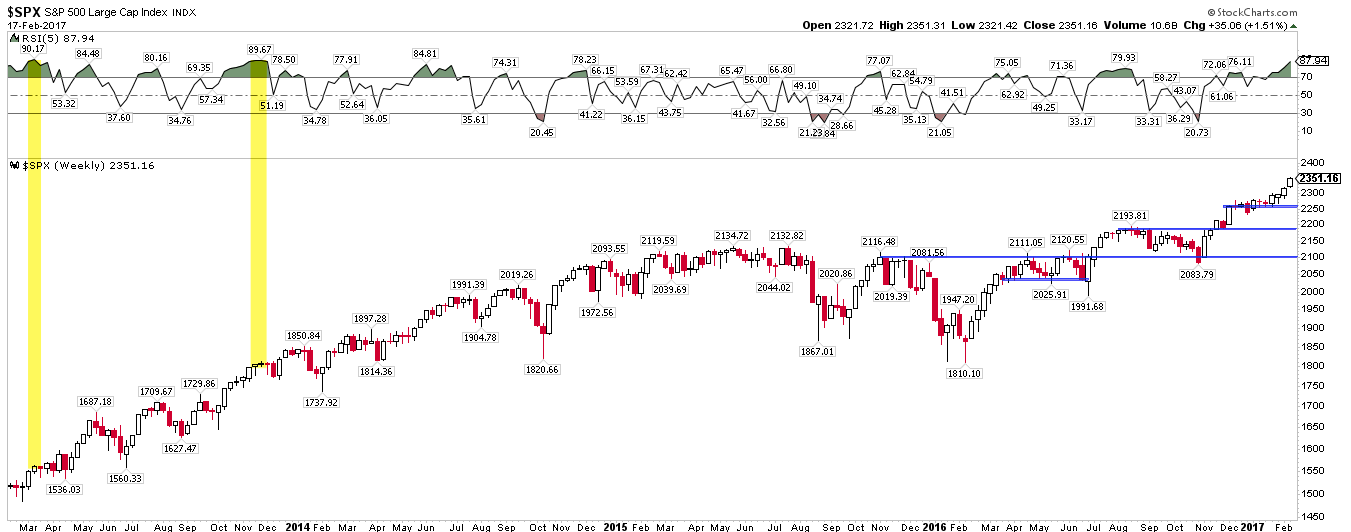
It's accurate to say that the last several weeks have been exceptional. In the chart above, weekly momentum (top panel) is the highest since March and November 2013. That level of momentum is most often not sustained; in both cases, SPX churned for the next 3 weeks (consolidating gains) before moving higher.
Similarly, shown below is 2009-2012, with the current level of momentum highlighted. Four of these periods marked intermediate turning points where SPX lost more than 5% in the weeks ahead; two other instances were like 2013, with SPX churning several weeks and then moving higher.
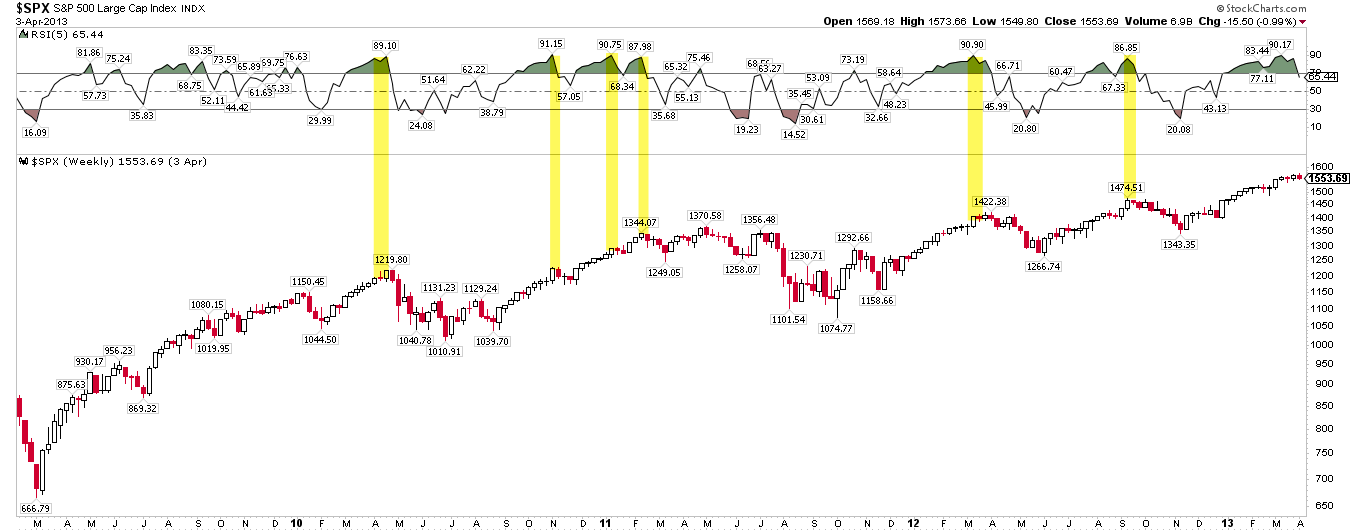
At least from a momentum standpoint, continued strong gains in the next several weeks is not very likely. In half the situations like today, the best scenario was a period of churning with a maximum loss of 1-2%. In the other half of these instances, SPX was near a point where it lost more than 5%.
So what happens next this time? We have some noteworthy indications that we'll discuss below.
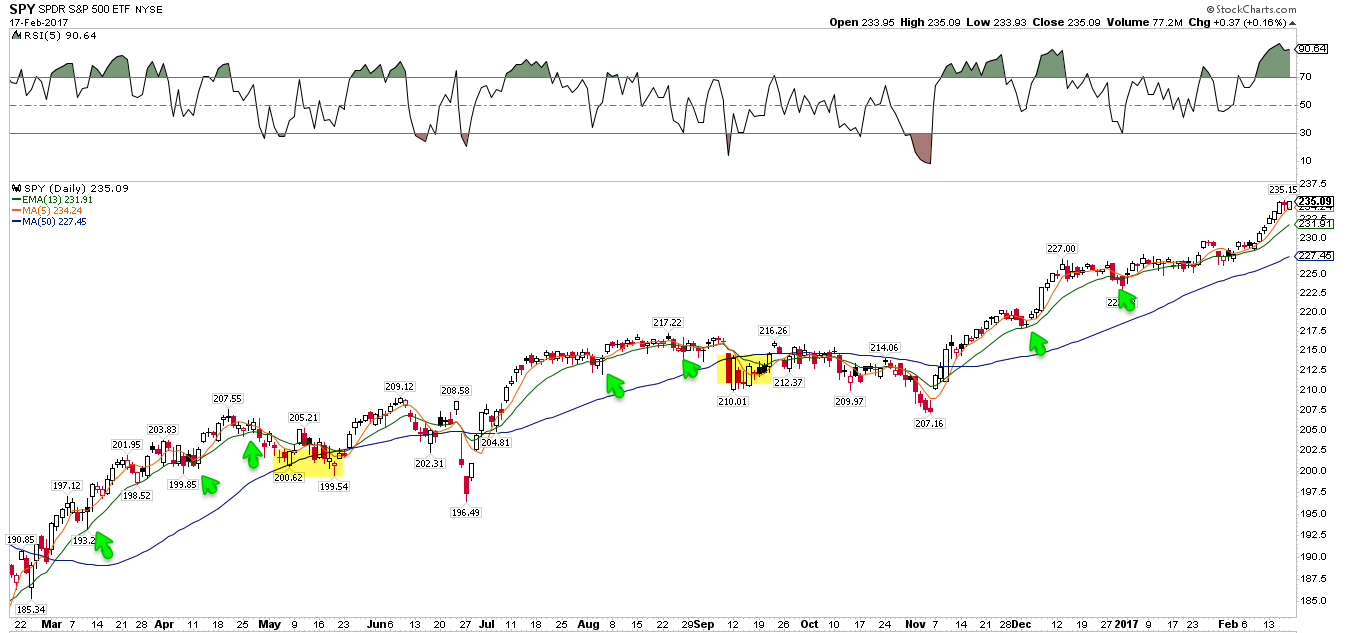
Before getting to that, however, it's important to note that uptrends weaken before they reverse. Assuming an abrupt end to the current uptrend is low odds. SPDR S&P 500 (NYSE:SPY) has not even closed below its 5-d since February 2. That would be the first indication of a weakening uptrend. When the 5-d is breached on consecutive days, a move to the 13-e (green line, arrows) is likely next. That is often a good approximate level of initial support (for a bounce). Subsequent tests of the 13-e then often lead to a test of the 50-d (blue line, yellow shading).
Starting in December, one of the knocks on the current rally has been poor breadth. As an example, many have noted that small cap stocks have lagged. Since then, SPX has moved about 6% higher. Is this unusual? Not at all. It's a dynamic we have previously discussed.
When small caps underperform, the conventional wisdom says that it indicates weakness in breadth as investors concentrate their buying on a relatively small number of large companies. The problem is these divergences have usually not been bearish. The yellow highlights below are times when small caps underperformed large caps (lower panel). Each time, SPX continued higher (top panel). The main exception was in 2012 (in orange).
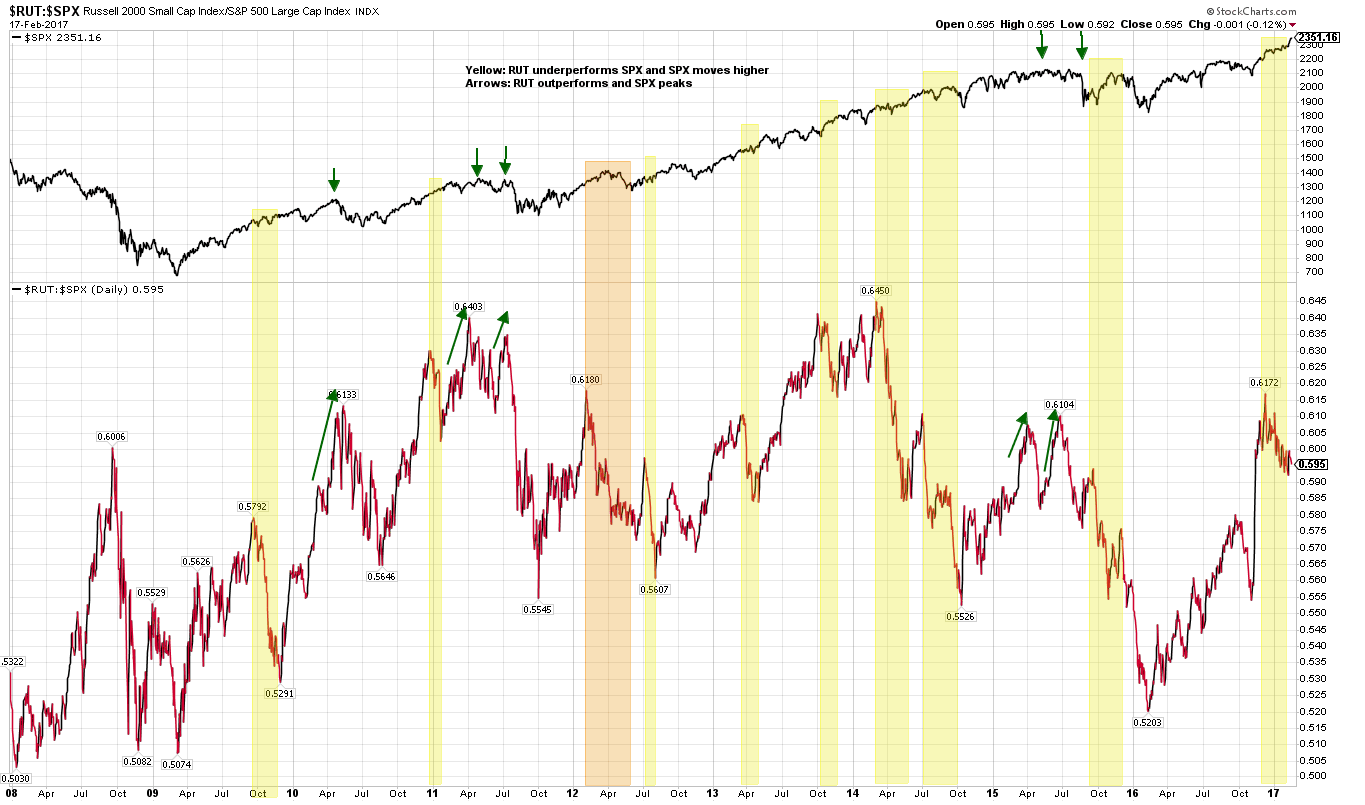
Moreover, there were several instances where small caps outperformed large caps right into a market peak (shown with arrows). If anything, that has been a better predictor of trouble for SPX. Why would this be? When small caps outperform, investors are chasing performance. It's a beta chase, and this indicates investor exuberance. At an extreme, this exuberance is punished with a market correction. That is not the case right now.
Another knock on the current rally has been that investor sentiment has become excessively bullish. Consider the following:
In the first week in December, more than 10 weeks ago, active investors surveyed by NAAIM had an average equity exposure over 100%, meaning that they were leveraged long. It has remained above 90% ever since.
Among Investors Intelligence (II) newsletter writers, bulls outnumbered bears by over 3 times in early December. It has since moved as high as 3.8 times.
The "Fear & Greed" index was over 90 in early December and remains near 80 now.
US indices have moved higher despite all of this. There are several points worth stressing on sentiment.
The most important is this: sentiment extremes at tops and bottoms are not the same. Bottoms are marked by the fear of loss, and that normally impacts a very large majority of investors simultaneously, creating a bearish extreme in sentiment. These extremes are very close to market lows.
But investors become bullish at differing rates; as more investors become bullish, price moves higher. This is why it is often said that "it takes more bulls to make a bull market." Because uptrends are longer and more gradual ("stairs up") while downtrends are swift ("elevator down"), sentiment tops take a longer time to unfold. The current situation, with many bullish investors and price moving higher, is, empirically, not unusual.
This is why excesses in sentiment - and other indicators like seasonality, breadth, etc - is best thought of as a headwind (or tailwind) to price. These form the "set up" for a change in trend. A "set up" means little until the trend in price weakens; this is the "trigger". Both a trigger and a set-up are needed to form a high odds trade.
An under appreciated aspect to current sentiment is the flow of money into equity mutual funds and ETFs. The best performance in the US market has taken place when fund flows are positive. That can be seen in the chart below: strong inflows in 2013-14 coincided with a 50% gain in SPX, for example. Equities can move higher when fund flows are negative, but the returns are marginal and the drawdowns can be extreme: the near bear market in August 2011 and 10% fall in May 2012 took place while fund flows were in decline (data from ICI).
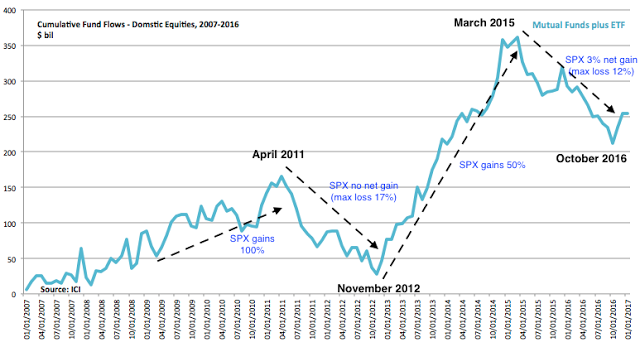
The important point now is this: in the 18 months leading into the US election, domestic equity fund flows had been consistently negative. During this time, SPX went sideways and experienced several drawdowns over 10%. That has started to change in the past 3 months, during which time SPX has gained about 13%. Through the end of January, cumulative fund flows are still more than $100b below their peak in March 2015. Objectively, there is considerable room for fund flows to push equity prices higher in the months ahead. Consider this a long term sentiment tailwind for equities.
All of that said, there are four near-term watch outs for US equities.
First, US macro data has been very good (a recent post on this is here). This has been a tailwind for equity prices throughout this bull market. But expectations are now running ahead of the data by an excessive degree (bottom panel). In the past, this has often (but not always) led to near term equity price corrections. The amount of the drawdown in SPX is marked in the top panel of the chart. Most of these have been about 5% but some have been 10% or more (from Sentimentrader).
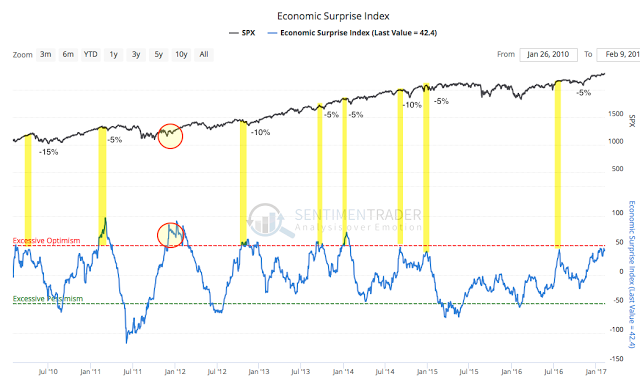
The main exception was in January 2012 (red circle). SPX had recently emerged from the near bear market referenced earlier, driven in large part by a surprising rebound in macro data.
The second watch out is sentiment. Prolonged periods where the number of II bulls exceeds bears by more than 3:1 eventually lead to equity prices correcting. Prior periods in the current bull market similar to today are highlighted in yellow. Again, this is part of the "set-up", it's not a trigger on its own. Notice that periods of high bullish sentiment coincide with high macro expectations in the chart above (from II).
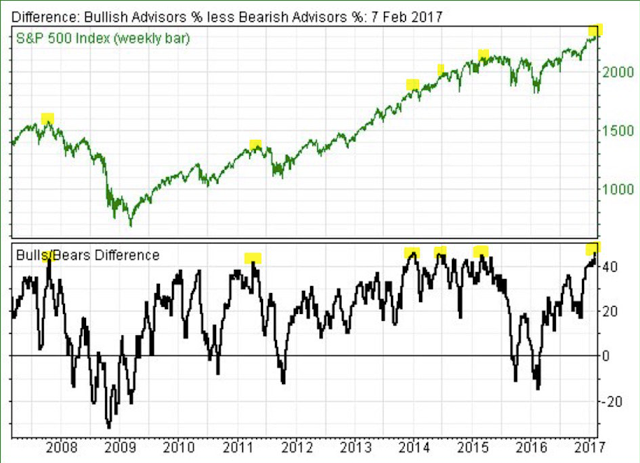
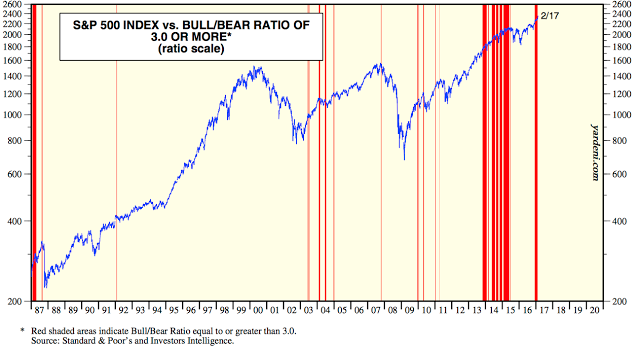
Going back to 1987, the current period of continuously bullish sentiment (measured by II) is among the longest in the past 30 years. Predicting the timing for a short-term turning point has been futile, but it is accurate to say that the high bullish sentiment does not often last very much longer than it has now, at least not historically (from Yardeni).
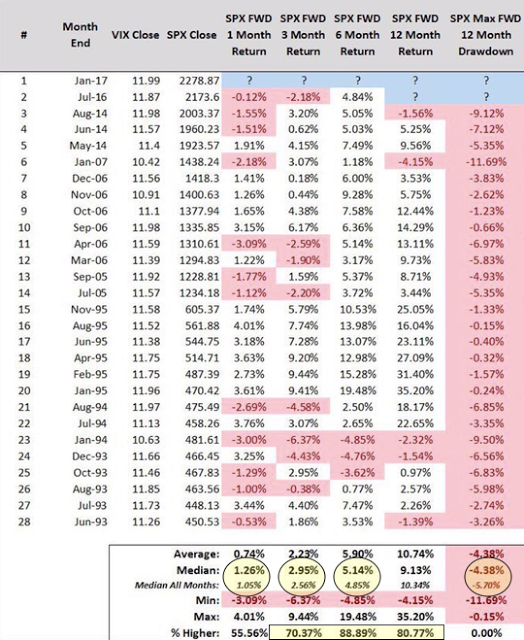
The third watch out is volatility. It's worth first noting that the current low level in the VIX is not in itself bearish. Empirically, the forward 3 and 6 month returns in SPX when VIX is under 12 are better than average (circles). SPX is higher 89% of the time 6 months later (from SJD10304).
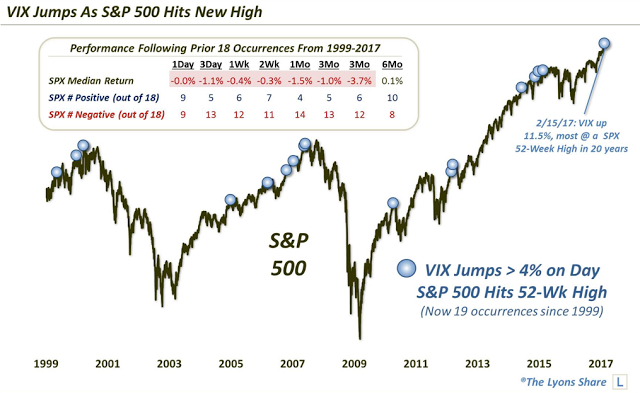
The watch out is that volatility is rising with equities, whereas these normally move opposite each other. This past week, VIX rose 6% while equities rose 2%. A month later, SPX has been lower nearly 80% of the time by about 1.5% (data from Dana Lyons).
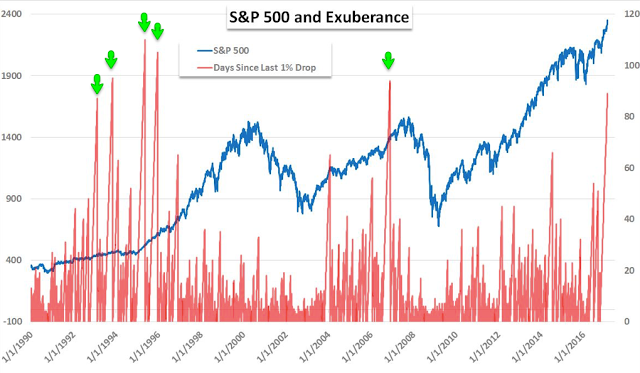
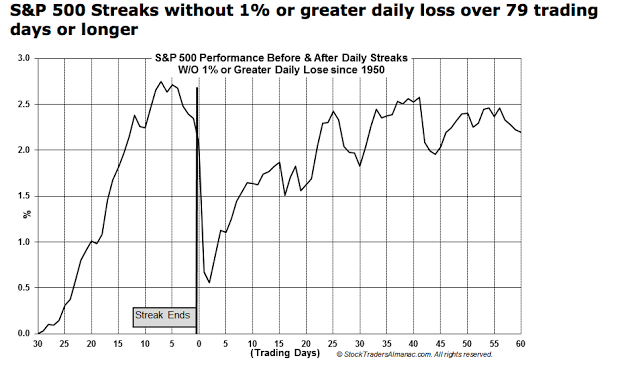
The current low volatility has occurred while SPX has marched higher without suffering a 1% loss in a single day since October. At 89 days, the current streak has only been exceeded four other times since 1990.
What happens next? In the first chart, note that none of the other longer streaks ended in a disaster (arrows; from John Kicklighter). In fact, on average, the first drop of 1% is followed by a steady recovery (second chart; from Stock Almanac). But it has usually taken more than 30 days for the prior high to be recovered.
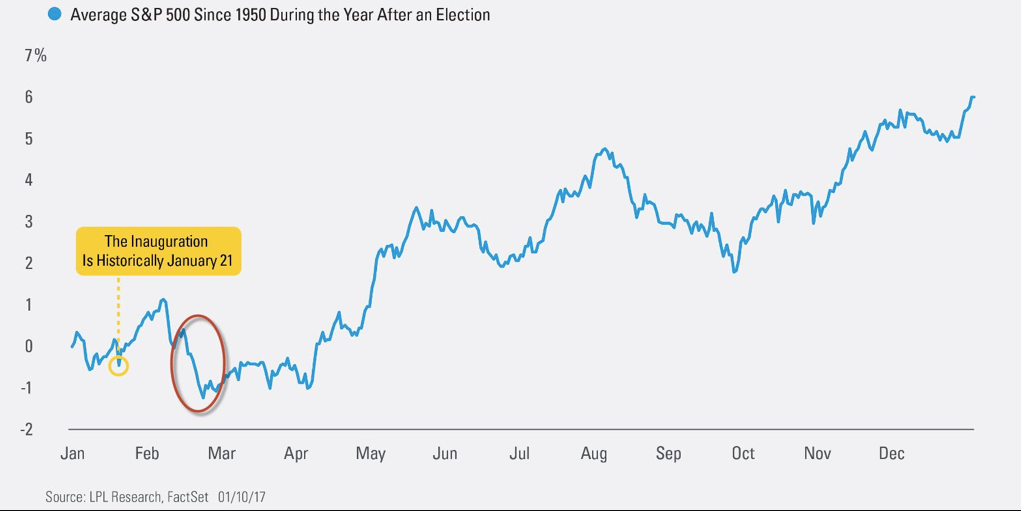
The fourth watch out is seasonality. The equity rally since Donald Trump's inauguration is the strongest since FDR in 1945 (more here). The usual pattern is for an inauguration honeymoon rally to be followed by a drop. That hasn't yet happened. Combined with the second half of February typically being weak, there is a seasonal headwind to equities (from Ryan Detrick).
In summary, there's a set up for equity prices to retrace some of their recent gains, but with the indices making fresh new highs this week, there is no price trigger, yet.
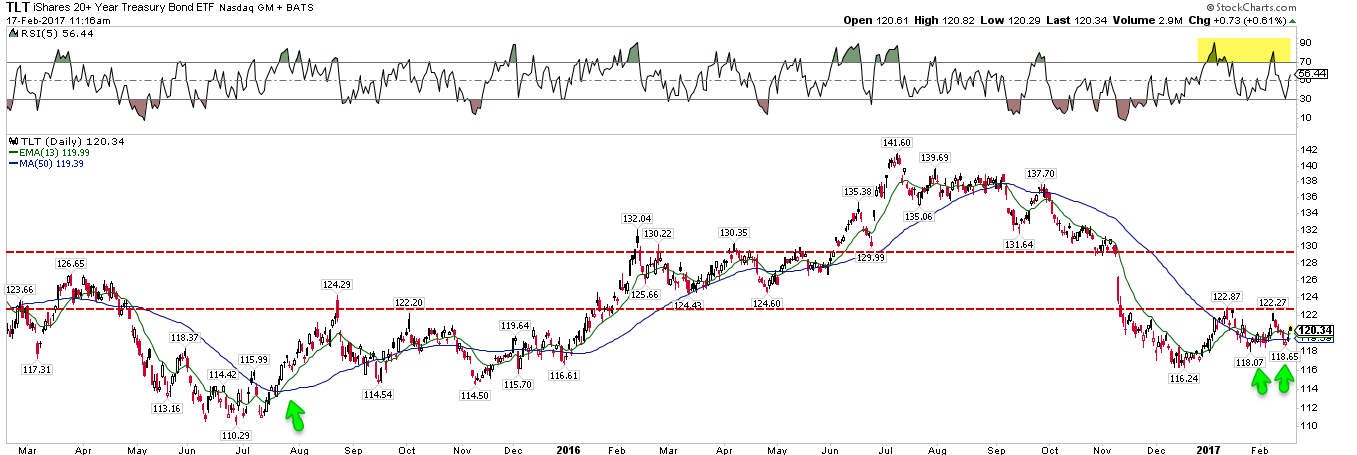
What is negative for equities is often (but not always) a positive for bonds. Even as equities have rallied, iShares 20+ Year Treasury Bond ETF (NASDAQ:TLT) has gained almost 4% in the past two months. In the chart below, note that TLT has made higher lows since December, and that it has twice tested, and held above, its 50-d (arrows). That 50-d may soon start to slope upwards. This is how new uptrends start; to the left, note a similar set up in July 2015. Momentum has twice been "overbought" but has not been "oversold" during the past two months; this is another positive (top panel, yellow shading).
Sentiment towards bonds is excessively bearish; fund managers have one of their lowest allocations to bonds in the past 10 years. That is often followed a rally in bond prices (a new post on this here).
Conversely, commercial hedgers are exceedingly long 10-year Treasuries (bottom panel); these traders are considered "smart money" and in prior instances, TLT has rallied (top panel; from Sentimentrader).
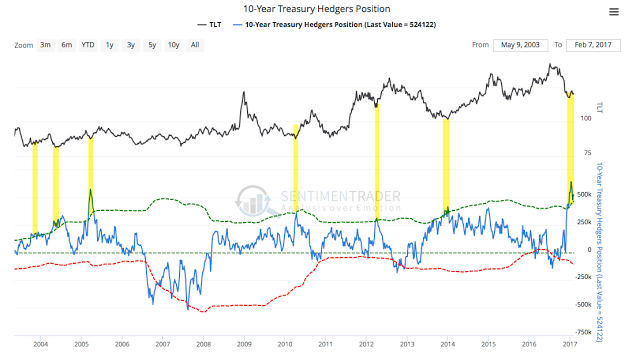
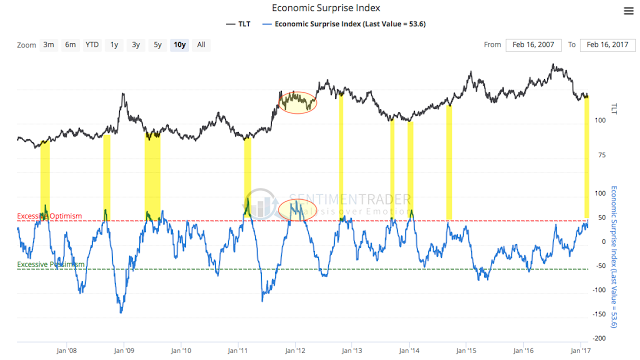
The excesses in macro expectations referenced earlier as a headwind for equities is often a tailwind for bonds. Below is the same chart shown above except TLT is now in the top panel. Most often, situations like now have been favorable for bond prices.
The calendar is light for the week ahead. Today, Monday is a market holiday, FOMC meeting minutes are released on Wednesday and new home sales data is released on Friday.
More than 90% of the companies in the SPX have released their financial results for 4Q2016. A new post on what this means for equities is here.
