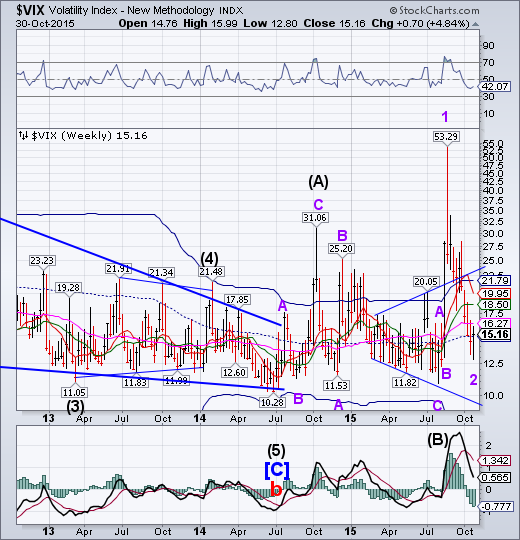
VIX made a new low on Wednesday, then closed above its weekly mid-Cycle support at 14.92, putting it on a weekly buy signal this week. The Broadening pattern “throwback” inside the Megaphone appears to be complete. The next move calls for a breakout to new highs. While traders are anticipating a calmer season ahead, the VIX warns the opposite may happen.
(SeekingAlpha) The bullish underlying tone stands in stark contrast to the extreme negativity seen just one month earlier - an atmosphere set off by China's repeated growth warnings. And it sets up an interesting backdrop heading into the final two months of 2015, a period that has historically been stock friendly.
SPX stalls inside its Broadening top formation.
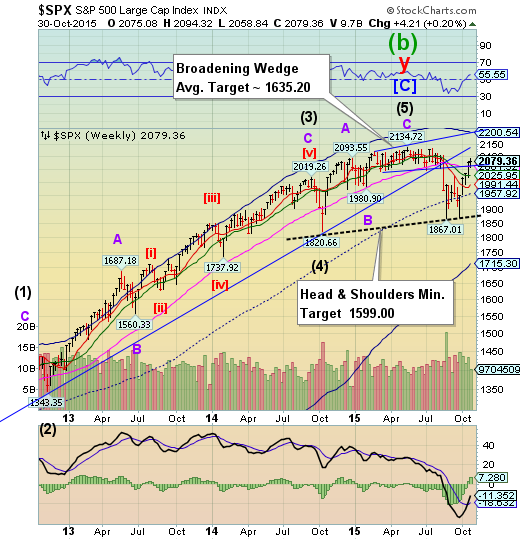
The SPX remained relatively flat during the week, closing near its 78.6% Fibonacci retracement at 2077.42. Most trendlines are respected by the market, where support becomes resistance in a breakdown. Broadening Wedge formations are different. This formation often allows throw-backs, but the formation target is often activated at the second trendline failure. The Cycles Model calls for a Pivot reversal by this weekend. A break of the trendline may lead to a flash crash much larger than the last.
(WSJ) The Dow Jones Industrial Average rose 8.5% in October, its biggest monthly percentage gain in four years as stocks around the globe rebounded from their late-summer lows.
Investors attributed the broad stock-market gains this month to global central banks, which have either talked up the prospect of further stimulus to boost sagging inflation and growth, or delayed interest rate rises that would tighten monetary policy.
NDX comes close, but no new high.
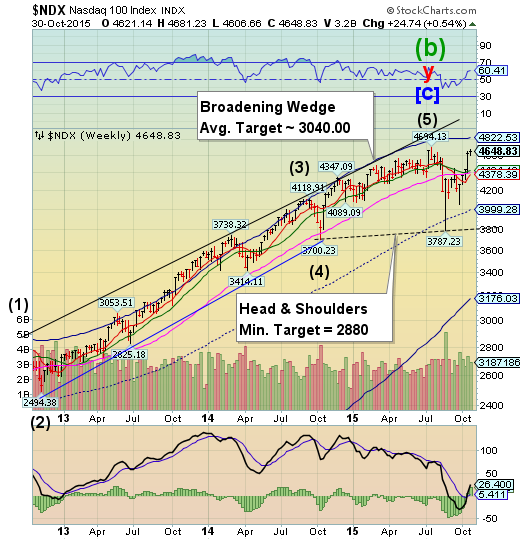
NDX came within a percent of reaching its July 20 high. However, it remains unbeaten. A Pivot reversal is expected as early as this weekend. A decline beneath weekly Long-term support at 4378.39 may offer a sell signal. A further decline beneath the trendline at 3800.00 may trigger the Broadening Wedge/Head and Shoulders formations. Both formations have similar targets, since they share the same neckline/trendline.
(ZeroHedge) In a "world of disappointments," where beta is king and where alpha has become a joke (or, now that equity is a risk-free asset and debt is risky, is outright punished) where growth no longer exists, drowning under the weight of $200 trillion in debt, and where value strategies have been all but forgotten replaced instead with "stories" about companies that have no cash flows but just might be "the next big thing" (one day), what should one to do? Why, engage in the most idiotic of strategies: chase momentum.
Here’s an example: (TheStreet) Put down the 10-K filings and the stock screeners. It's time to take a break from the traditional methods of generating investment ideas. Instead, let the crowd do it for you.
From hedge funds to individual investors, scores of market participants are turning to social media to figure out which stocks are worth watching. It's a concept that's known as "crowdsourcing," and it uses the masses to identify emerging trends in the market.
High Yield Bonds closes the week flat.
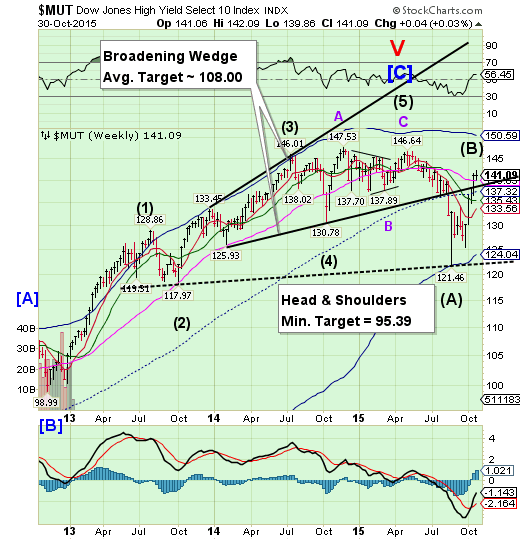
The High Yield Index remains inside its Broadening Wedge formation, also completing a Fibonacci 78.6% retracement. A drop back beneath the trendline may trigger the Broadening formation, leading to a potentially substantial decline. The Cycle Bottom/Head and Shoulders neckline may be challenged again. The Cycles Model suggests a major decline in HY over the next month.
(MarketRealist) Investor flows in high yield bond funds were positive for the third consecutive week. According to Lipper, net inflows into high yield bond funds totaled $3.3 billion in the week ended October 21, the largest weekly inflow since the week ended October 26, 2011. To contrast, the week ended October 14 had net inflows of $1.5 billion. In spite of these large inflows, high yield bond funds have witnessed outflows to the tune of $417 million on a YTD (year-to-date) basis.
The euro remains below resistance.
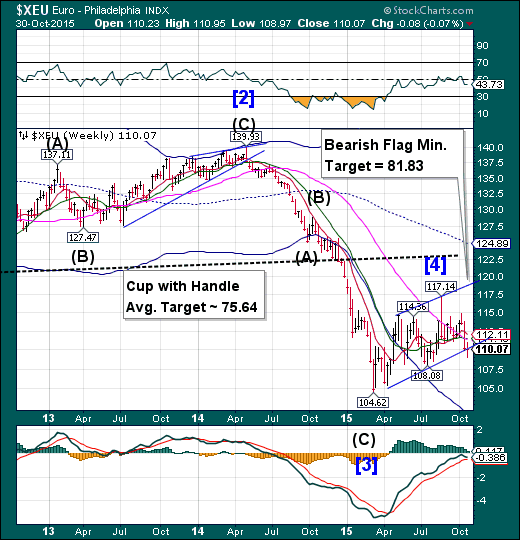
The euro remained beneath weekly Long-term resistance and may have triggered its bearish Flag formation this week. It is probable that the euro trend toward parity with the USD may continue, as the next technical support lies at 101.80. The Cycles Model suggests the euro may decline over the next four weeks.
(WSJ) The euro weakened against the dollar in October, as central bank messages raised expectations for additional stimulus in the eurozone and higher interest rates in the U.S., underscoring the divergence in monetary policy between the two economies.
The common currency shed 1.6% against the dollar over the month, falling to $1.0994 in late-afternoon trade on Friday. The euro edged 0.1% higher during the day against the dollar, as investors booked some profits on the U.S. currency’s gains over the week.
EuroStoxx repelled at Long-term resistance.
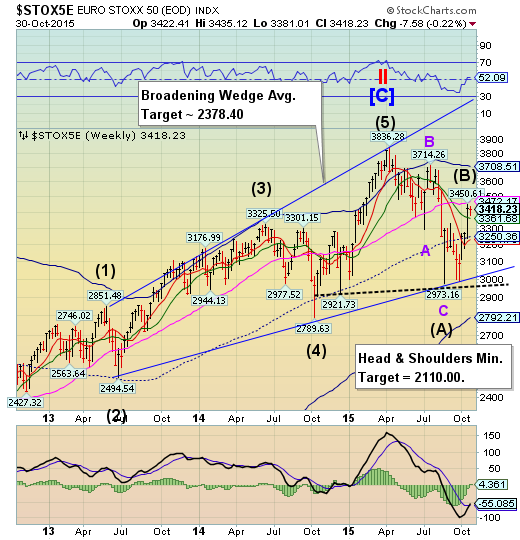
EuroStoxx 50 declined from weekly Long-term resistance at 3472.17 to test Intermediate-term support at 3361.68. It closed at a small loss for the week. A loss of additional supports may be problematic, as a decline to the two trendlines would indicate that the bear market is very much alive.
(Reuters) - European stocks recorded their best month in more than six years on Friday, buoyed by gains at carmaker Renault (PA:RENA) and planemaker Airbus (OTC:EADSY), while investors also banked on more monetary stimulus for the region.
The pan-European FTSEurofirst 300 index closed flat, but nevertheless rose around 8 percent over the course of the month for its best monthly performance since July 2009.
The euro zone's Euro STOXX 50 index rose 0.1 percent, while Germany's DAX gained 0.5 percent.
The yen is testing support.
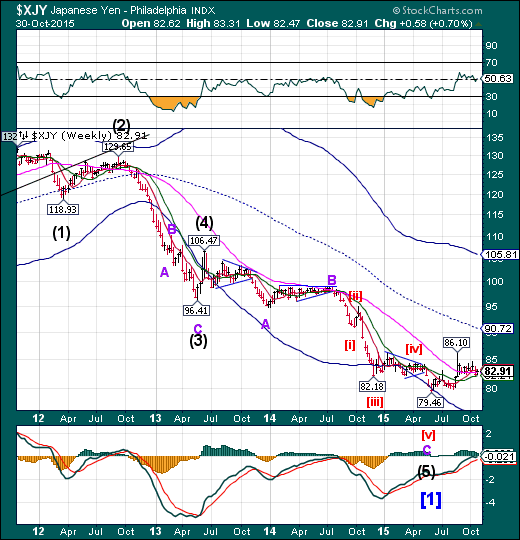
The yen challenged Long-term support at 82.73, but closed above it this week. A slip beneath support may impel the yen to decline over the next two weeks, according to the Cycles Model, which anticipates a Master Cycle low.
(WSJ) Many investors believe Japan’s central bank could boost its stimulus program again on Friday. But they are less convinced that the yen will weaken significantly as a result.
Even if the Bank of Japan decides to expand its asset-purchase program in a bid to stoke inflation and growth, already-low bond yields in Japan are unlikely to fall much further, these investors argue. The yen would then avoid the kind of intense selling pressure that followed rounds of easing in April 2013 and October 2014.
The Nikkei stalls at Long-term resistance.
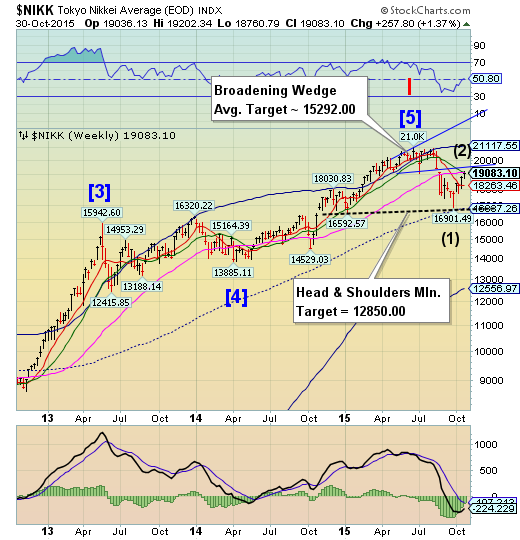
The Nikkei challenged Long-term resistance at 19195.22, but closed beneath it. This appears to have been a Trading Cycle inversion, which may result in a month-long decline to follow. Should the decline go beneath mid-cycle support at 16837.26, the Nikkei may experience a flash crash.
(Reuters) - Tokyo shares rose to more than a two-month high on Friday after the market digested the Bank of Japan's decision to stand pat on policy, while a media report that the government is considering a budget of over 3 trillion yen buoyed sentiment.
The Japanese government is considering compiling a supplementary budget of over 3 trillion yen ($25 billion) to build nursing-care facilities and aid farmers, who face tougher competition as the country prepares to join a trans-Pacific trade pact, the Nikkei newspaper reported on Friday.
U.S. dollar consolidates above its Diamond formation.
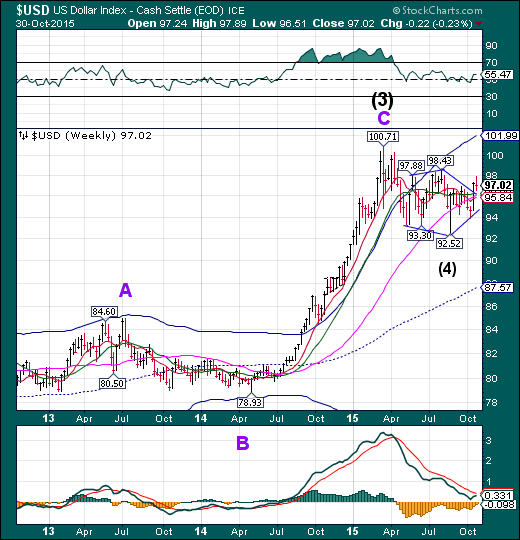
The US dollar consolidated this week while retesting the Diamond formation. The new Cycle being formed may have several weeks to a month to rally further. The Cycle Top resistance at 101.99 may be an appropriate target for USD..
(Reuters) Speculators increased bullish bets on the U.S. dollar in the latest week, with net longs climbing to a one-month high, according to Reuters calculations and data from the Commodity Futures Trading Commission released on Friday.
The value of the dollar's net long position rose to $21.6 billion in the week ended Oct. 27, from $13.32 billion the week before. That was the largest net long position since late September, after declining three straight weeks.
USB challenges Long-term support.
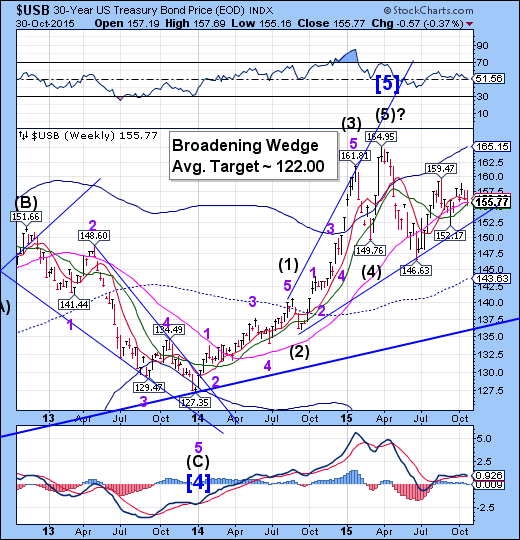
The Long Bond challenged weekly Long-term support at 155.70, closing just above it this week. A decline beneath this support may lead to a challenge of the Broadening Wedge trendline at 152.50. USB now has the potential for up to 3 weeks of decline ahead of it. If so, the long-term trend may be in jeopardy. The 34-year trendline lies at 135.25.
(NASDAQ) U.S. government bonds strengthened after a two-day price decline, but the bond market is set for a losing month in October.
Month-end demand from fund managers pushed bond prices higher Friday. On the last trading session of each month, newly minted bonds replace maturing debt in bond indexes, and investors whose bond portfolios track bond indexes closely replicate the changes by buying bonds.
The buying provided some reprieve to the bond market, which had been under selling pressure following Wednesday's interest-rate statement from the Federal Reserve. The central bank gave its clearest signal yet that a rate increase in December is on the table, prompting investors to shed bond holdings as they are worried that tightening policy would shrink the value of their bond investments.
Gold is repelled at Long-term resistance.
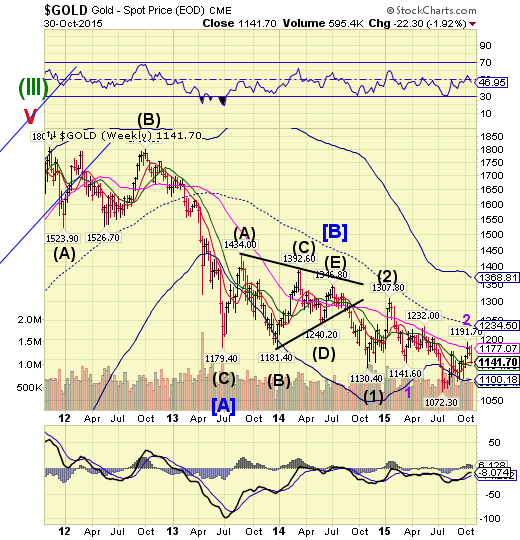
Gold declined through weekly Short-term support at 1143.46 after being repelled at Long-term resistance. Intermediate-term support is close by at 1134.05. A decline through the final Model support leaves the weekly Cycle Bottom at 1100.10. The Cycles Model calls for a potential 4-week decline straight ahead. .
(Reuters) - Gold fell to a three-week low on Friday, extending two days of losses and heading for its biggest weekly drop since August on the chance the U.S. Federal Reserve may still raise interest rates this year.
The Fed indicated after a two-day policy meeting this week that a December rate rise is still on the table, curbing talk that a run of downbeat economic data and worries about the global economy would push a hike back to 2016.
Rising interest rates tend to weigh on gold because they lift the opportunity cost of holding non-yielding bullion.
"Our economists are expecting the Fed to raise rates in December," Macquarie analyst Matthew Turner said.
Crude bounces to challenge Intermediate-term resistance.
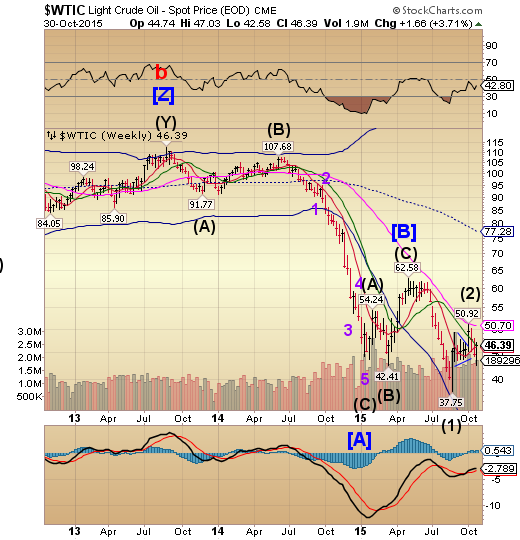
Crude bounced from a nine-week low to challenge Intermediate-term resistance at 46.39. The overdue Master Cycle low finally arrived on Wednesday. Usually a Master Cycle low calls for an average three week rally. However, the overdue Cycle low may cut short the rally that follows.
(CNBC) The U.S. government is getting ready to sell millions and millions of barrels of crude oil.
On Wednesday, the House voted to pass a budget deal to increase the country's borrowing limit. As part of the plan to raise funding, the budget includes a provision to sell 58 million barrels of oil from the Strategic Petroleum Reserve between 2018 and 2025, to go into the general fund of the Treasury.
Additionally, to fund the Energy Security and Infrastructure Modernization Fund, the government plans to sell another $2 billion in reserves between 2017 and 2020.
Shanghai Index stalls beneath resistance.
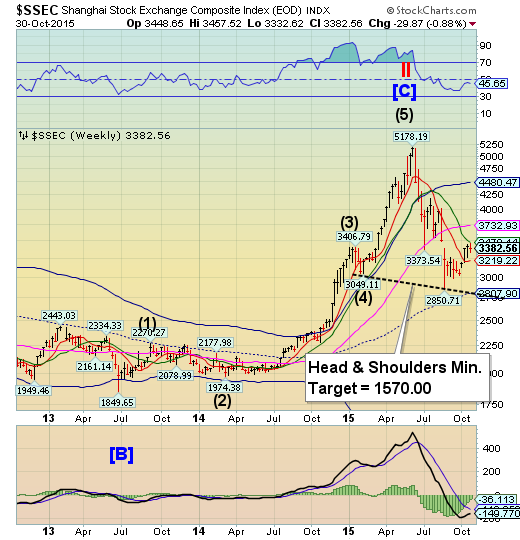
The Shanghai Index challenged Intermediate-term resistance at 3470.14, but remained stalled beneath it. The Pivot high that we were looking for appears to have occurred on Monday, with a probable Master Cycle low in another week or so. Are the mid-Cycle support and Head and Shoulders neckline in jeopardy of being crossed in such a short time? We’ll soon find out.
(ZeroHedge) It's almost difficult to believe, but just 8 years ago, in 2007 and right before the world was swept in the worst financial crisis in history, China had only $7.4 trillion in debt, or 158% in consolidated debt/GDP. Since then this debt has risen to over $30 trillion (specifically $28.2 trillion as of Q2, 2014), representing a staggering 300% debt/GDP.
This means that China was responsible for more than a third of all the $57 trillion debt created since 2007, making a mockery of the QE unleashed by all the DM central banks - something we first noted about two years before the famous McKinsey report went to print.
However, it was precisely this credit expansion that not only allowed China to completely ignore the global depression of 2008/2009, but to build lots and lots of ghost cities such as these.
The Banking Index reverses below Long-term resistance.
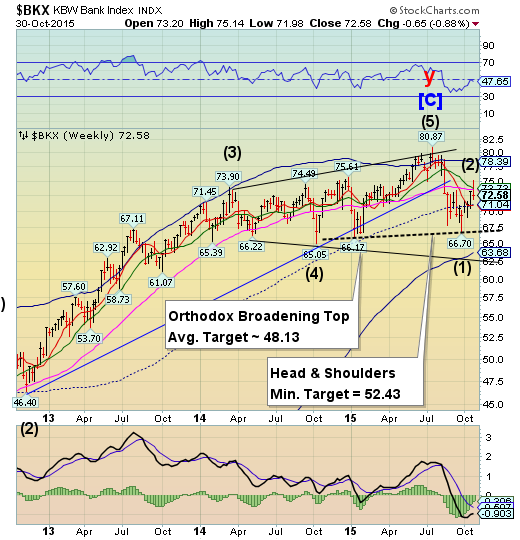
BKX rallied above, then fell below Long-term resistance at 73.58, after completing a 60% retracement of its initial decline. The reversal brings a new decline into play that may have a duration of four or more weeks and the high probability of meeting the targets on the chart.
(ZeroHedge) First, Iceland jailed its crooked bankers for their direct involvement in the financial crisis of 2008. Now, every Icelander will receive a payout for the sale of one of its three largest banks, Íslandsbanki.
If Finance Minister Bjarni Benediktsson has his way — and he likely will — Icelanders will be paid kr 30,000 after the government takes over ownership of the bank. Íslandsbanki would be second of the three largest banks under State proprietorship.
“I am saying that the government take [sic] some decided portion, 5%, and simply hand it over to the people of this country,” he stated.
(ZeroHedge) As we put it a few days ago while mocking Saudi Arabia’s attitude toward “collateral damage” from its bombing runs in Yemen, “you can’t make an omelette without breaking a few eggs.” Well, over at Deutsche Bank (DE:DBKGn), John Cryan has been busy crushing whole cartons worth.
From sweeping job cuts, to reorganizations, to eliminating the dividend, Cryan has been a veritable wrecking ball since taking the helm from co-CEOs Anshu Jain (who is gone) and Jürgen Fitschen (who is leaving).
(Reuters) - Six big U.S. banks need to raise an additional $120 billion, most likely in long-term debt, under a rule proposed on Friday by the Federal Reserve.
The requirements are aimed at ensuring that some of the biggest and most interconnected banks, which include Goldman Sachs Group Inc (N:GS), JPMorgan Chase & Co (N:JPM), and Wells Fargo (N:WFC), can better withstand another crisis by turning some of their debt, particularly debt issued by their holding companies, into equity without disrupting markets or requiring a government bailout.
The banks are expected to meet the $120 billion shortfall by issuing debt, which is usually more cost-effective than issuing equity, according to Federal Reserve officials speaking at a background press briefing Friday. The rule proposed Friday, largely in line with banks' expectations, concerns the lenders' total loss-absorbing capacity.
