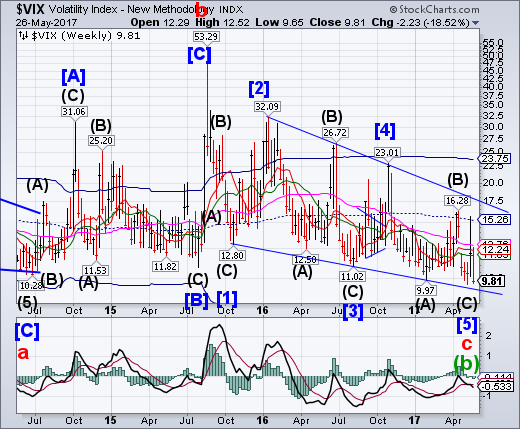
VIX rallied to challenge mid-Cycle resistance at 15.32 before closing above Intermediate-term support at 11.89. It is now on a buy signal. A breakout above mid-Cycle resistance implies that VIX may rally to its weekly Cycle Top resistance at 23.76.
The co-inventor of VIX warns that low volatility is not the new normal.
It finally happened.
After months of speculation over when the lull in U.S. equity volatility would snap, investors got their answer Wednesday. A bombshell report on President Donald Trump’s interactions with former FBI director James Comey sent the VIX up the most in almost a year.
For anyone on the wrong end of the trade, it was a painful lesson.
SPX makes a new high and a reversal.
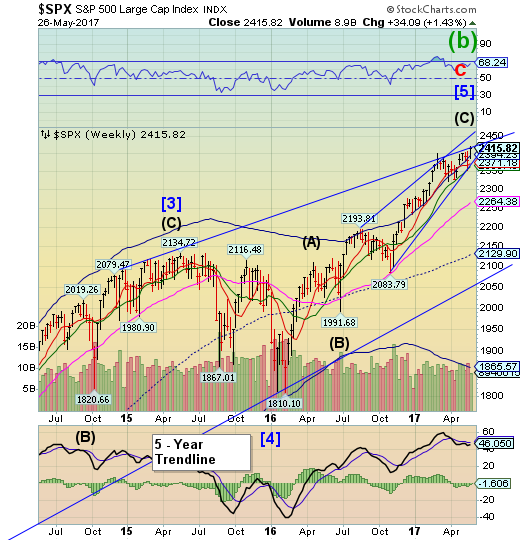
SPX made a new all-time high on Tuesday, barely 5 points higher than the March 1 top, then sold off to Intermediate-term support at 2356.28 before closing beneath its Cycle Top resistance at 2385.73. This constitutes a reversal pattern that may result in a decline beneath supports that have provided the impetus for this rally. Trading methodologies that have been helpful during the rally may actually increase the risk of a sell-off.
U.S. stocks climbed, paring more of Wednesday’s loss as investors assess the political scrutiny surrounding President Donald Trump.
The S&P 500 Index rose 0.7 percent to 2,381 at 10:15 a.m. in New York, while the Dow Jones Industrial Average added 0.5 percent to 20,762. Stocks rebounded yesterday, after a series of allegations involving Trump’s administration turned investors cautious and sent shares to their worst drop since September on Wednesday.
NDX also reverses from an all-time high.
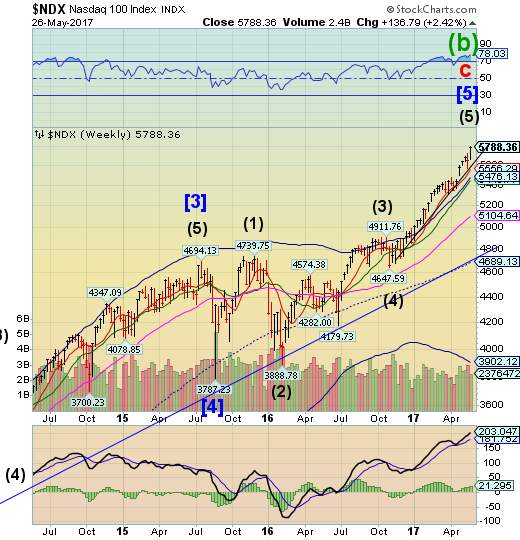
NDX posted another new all-time high on Tuesday.It is clearly on an extension with earnings playing a big part of the ebullience. A decline beneath Short-term support and the trendline at 5509.14 may suggest a deeper correction is in order.
When we were discussing the self-reinforcing dynamics of vol-neutral funds yesterday, which may or may not continue selling today depending on what the VIX does, we concluded that aside from the decision-making mechanics of systematic funds, the biggest question would be if the Fed, or other central banks, do not do step in to prop up the market as they have on every other similar occasion in the past 8 years.
Would that imply that traders - be they CTAs, risk-parity, or simply carbon-based - are finally on their own?
According to a follow up note sent overnight by Evercore ISI's KrishnGuha, the answer is yes, at least for the first 10% of any upcoming market drop. As Guha writes:
With the US equity market sell-off intensifying Wednesday afternoon, a number of clients have asked at what point the Fed would ride to the rescue. Our answer is that this time the cavalry is not coming, at least not unless we see something much larger, at least a 5 - 10 per cent type correction and maybe not immediately even then.
High Yield Bond Index breaks down beneath Long-term support.
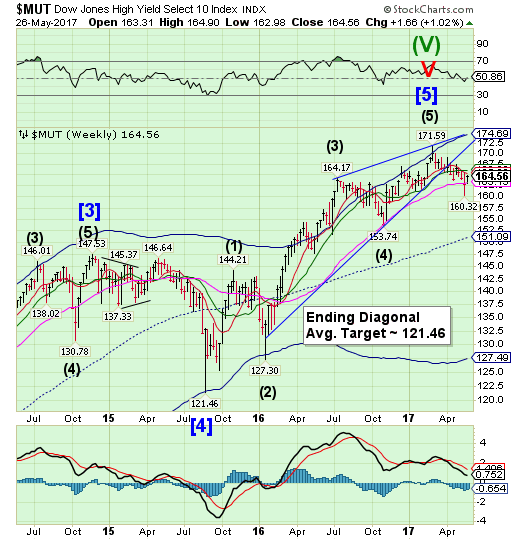
The High Yield Bond Index declined beneath Long-term support at 163.08, the last bastion of defense against a bear market.It remains on a sell signal. The end-of-week bounce did not regain that support. The Cycles Model suggests accelerated weakness ahead that may last through the end of May.
Investors are getting the lowest yields on the riskiest bonds in almost three years, another sign of the high level of complacency in financial markets.
The Bank of America Merrill Lynch (NYSE:BAC) U.S. High Yield index is showing that so-called junk bonds are delivering yields of just 6.02 percent, down 40 percent from the more than 10 percent rate in early 2016 and at a level last seen around June 2014.
A decline in yields indicates investor demand for products at the high end of the risk scale. Demand drives prices higher and thus sends bond yields lower under the dynamics of the fixed income market. The trend comes at a time when volatility has subsided across markets, with one measure of stock market fear, the CBOE Volatility Index, hovering around historical lows.
USB rallies off supports.
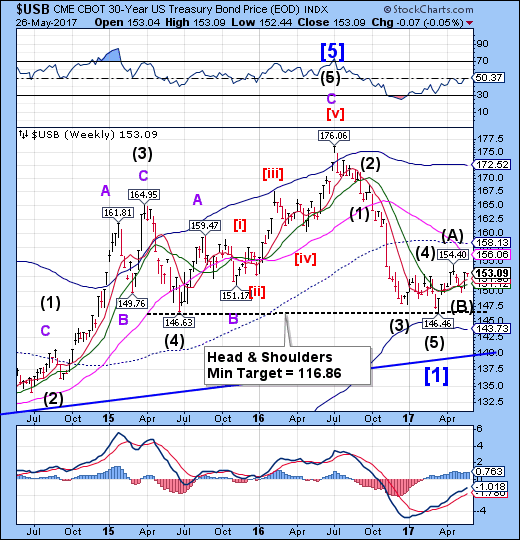
The Long Bond rallied from Short-term (151.76) and Intermediate-term support at 150.93, beginning the next phase of its retracement rally. USB made a Master Cycle low a week ago and is due for a period of strength over the next 2-3 weeks. The mid-Cycle resistance at 158.22appears to be the target, but it may go higher.
It has been a day of capitulation for Goldman. Just hours after the bank that controls the White House cut its forecast for Trump tax hikes by nearly 50% from $1.7 trillion to $1.0 trillion, moments ago Goldman, which starts off every single year predicting that 10Y yields will rise to 3.00% (or higher) over the next 12 months - much to our recurring mocking every single year - just cut its 10Y Treasury yield forecast for the end of the year. To be fair (to those who lost money listening to its reco) it did so kicking and screaming, with chief GS Intl strategist Francesco Garzarelli adding saying that:
in relation to expectations around nominal activity growth and credit expansion, 10-year bonds now screen as expensive across the board.
The euro vaults above mid-Cycle resistance.
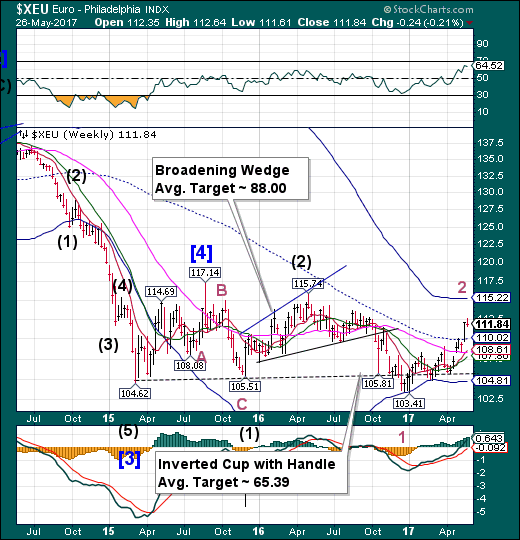
The euro rallied above mid-Cycle resistance, which is the usual stopping place for second waves. Given the strength of the rally, it may last up to another week and go as high as the Cycle Top resistance at 115.19. The reversal from that high may be unusually strong.
Euro next boss Stéphane Boujnah has warned that the UK will likely lose its battle with Brussels over euro-clearing, saying that a "significant part" of the lucrative $1 trillion market is likely to relocate.
Mr Boujnah, who runs the pan-European exchange, said that clearing trades denominated in euros will become an "anomaly" in London after Brexit, with a shift away from the City the most likely outcome.
Speaking a month before the European Commission will present a series of reforms concerning the market post-Brexit, he pointed out that 40-70pc of trading in euro-denominated assets currently goes through London.
Euro Stoxx reverses beneath its trendline.
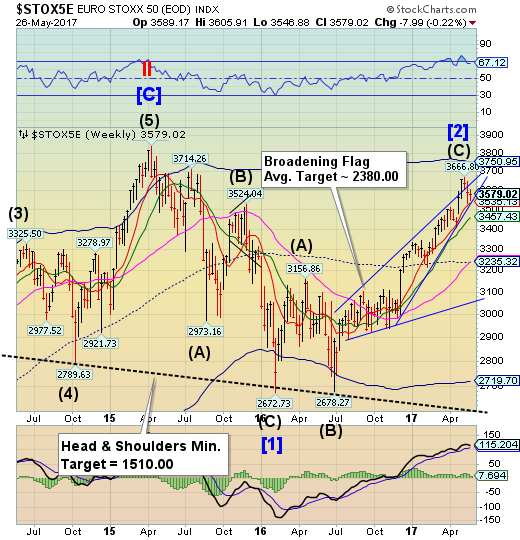
The EuroStoxx 50 Index declined beneath the Broadening Flag trendline and bounced from Short-term support at 3522.07. The correction came as expected. A breakdown beneath Short-term support give Stoxx a sell signal with implications of a much larger decline over the next two weeks.
Money managers say stock picking of European equities might be back in vogue, thanks to the most successful earnings season in seven years for European corporations.
After major outflows from European equities last year, inflows have rocketed since the beginning of 2017, particularly in the past few weeks, said Romain Boscher, global head of equities at Amundi in Paris. That compares with net outflows of $100 billion in 2016, he said. Amundi has €1.13 trillion ($1.23 trillion) under management; a breakout of European equities could not be learned by deadline.
The yen bounces from mid-Cycle support.
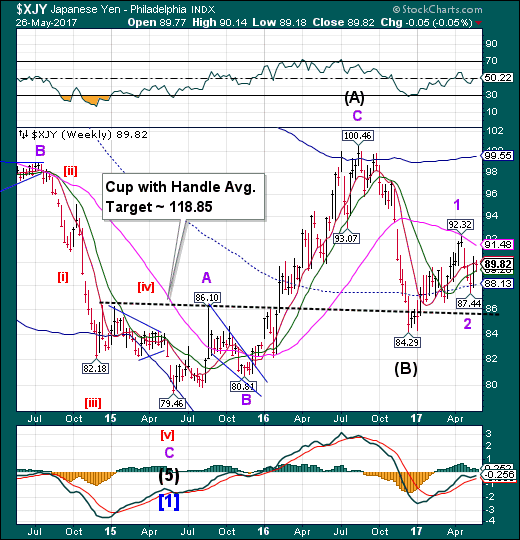
The yen bounced frommid-Cycle support at 88.07, then closing at Short-term resistance. The Cycles Model suggests that Cyclical strength may extend for another two weeks.
The Financial Times has an article entitled, “Japanese yen recovers as cautious mood in markets prevails.”
With the Fed contemplating whether to hike again next month and start "normalizing" its balance sheet before the end of 2017, the two other major central banks are facing far bigger problems.
Two months after the BOJ quietly started tapering its QE program, when it also hinted it may purchase 18% less bonds than planned.
The Nikkei shies away from the elusive 20000.
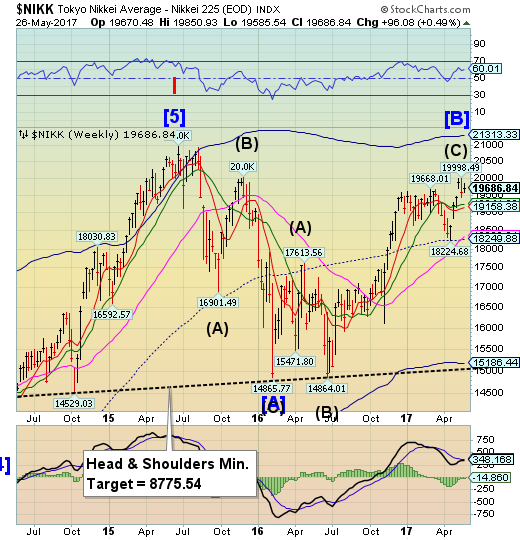
The Nikkei missed its 20000.00 target by less than 2 points before declining this week. The sell-off suggests a period of weakness may be setting in. A decline beneath Short-term support at 19111.24 may put the Nikkei on a sell signal. The Cycles Model suggests up to three weeks of decline ahead.
Underneath Japan's extended economic expansion is a fragile bounce in private consumption not underpinned by significant wage gains, a fact that bodes poorly for the nation's yearslong struggle to conquer deflation.
First the good news
Real gross domestic product grew an annualized 2.2% on the quarter in the January-March period, marking the fifth straight quarter of expansion. That rivals the six-quarter run to April-June 2006, the longest streak in the postwar era.
U.S. dollar Decline bent at mind-Cycle support
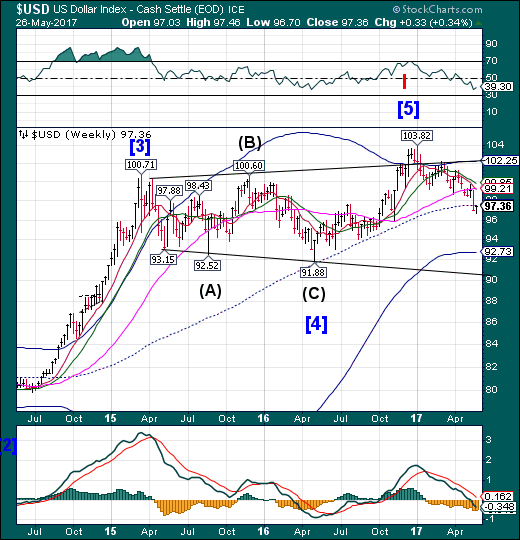
USD declined through mid-Cycle support. This may have changed the intermediate-term trend to bearish. The Cycles Model proposes a possible short-term bounce later next week.
The U.S. dollar fell on Friday, adding to its worst week since April 2016 against a basket of major currencies, and having surrendered the gains made since Donald Trump was elected U.S. president.
The dollar index, which tracks the greenback against a basket of six world currencies, has shed more than 2 percent this week DXY. On Friday, it fell 0.75 percent, hitting its lowest since Nov. 9, the day after the U.S. election.
Uproar over Trump's recent firing of FBI Director James Comey, who was overseeing an investigation into possible links between the president's team and Russia, has pressured the dollar.
John Doyle, director of markets at Tempus Inc in Washington, said:
The dollar overall, across the board, has been getting beat up this week and a lot of that has to do with the political risk here in DC. While we saw a little bit of a reprieve yesterday, we’re right back on that dollar weakness train.
Gold bounces to a Broadening Wedge trendline.
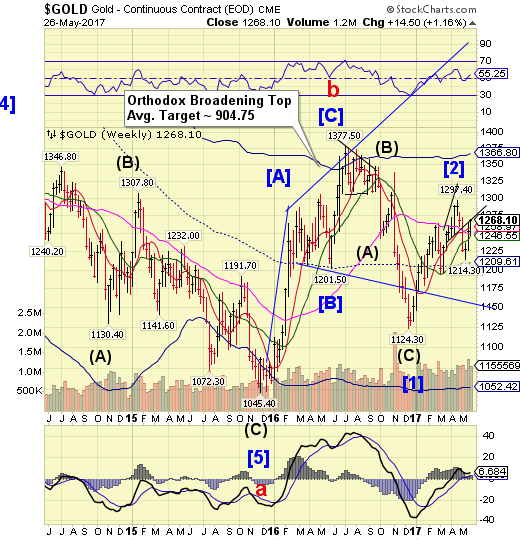
Gold continued its bounce to the lower trendline of the Broadening Wedge formation before weakening.It closed beneath Short-term support/resistance at 1256.79, suggesting further weakness. The Cycles Model suggests about two weeks of probable decline ahead.
Gold prices edged up on Friday and wereon track for their biggest weekly gain since mid-April as thedollar eased amid lingering political turbulence in the United States.
In the previous session, the metal snapped a five-day rallyand slipped 1.1 percent on profit-taking, its biggest one-day percentage drop since May 3.
Brian Lan, managing director at gold dealer GoldSilver Centralin Singapore, said:
The gold rally was overdone and there was a correction onThursday. But perhaps, it came down a little too much from the highs of yesterday. So people started to pick up again ... People are still wary of geo-political risks and notselling the safe-haven asset yet.
Spot gold was up 0.4 percent at $1,250.96 per ounce,as of 0819 GMT. It climbed 1.9 percent for the week and is setfor its biggest weekly rise in five.
Crude has a triply-indicated downside target.
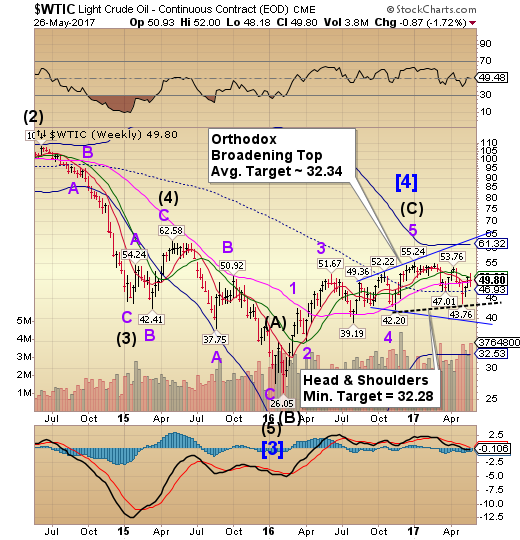
Crude rallied back to Intermediate-term resistance at 51.03.In doing so, it created a new right shoulder to a deeper Head & Shoulders formation than indicated last week. In addition, there are now three formations indicating the probable target for the decline to follow. If the Cycles Model is correct that target may be reached in the next two weeks.
Oil prices rose on Friday, closing out a second week of gains on growing expectations that OPEC and other producing countries will agree next week to extend output cuts.
Brent crude LCOc1 settled up $1.10, or 2.1 percent, at $53.61, the highest settlement for the international benchmark since April 18. U.S. benchmark crude oil CLc1 rose 98 cents to $50.33, the highest close since April 19.
The Organization of the Petroleum Exporting Countries (OPEC) and other producers including Russia are scheduled to meet on May 25. They are expected to extend output cuts of 1.8 million barrels a day until the end of March 2018.
Shanghai Index has a mildly positive week.
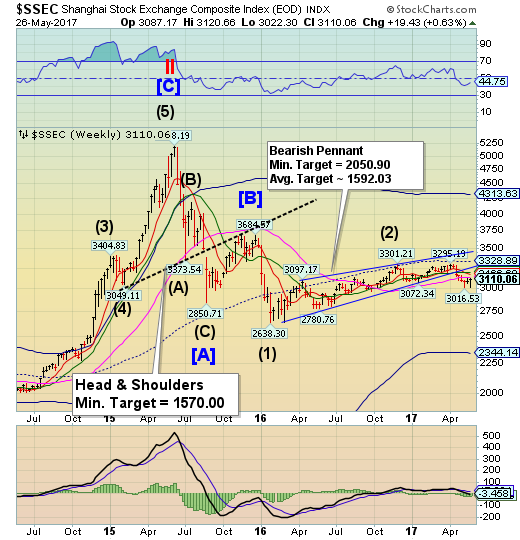
The Shanghai Index rebounded this week after declining beneath Long-term support/resistance at 3137.30. The period of strength may be over while the Cycles Model suggest another three weeks of decline. Attempts to limit the decline may not have the same effect they have had in the past.
Fabricating data in China, it turns out, is not only a favorite government pastime. Publicly traded, if state-owned, phone giant Unicom Group fabricated financials relating to 1.8 billion yuan ($261 million) in revenue over a five-year period from 2012 to 2016 - or as the company admitted, it engaged in an "unprecedented degree of falsified revenue." This is China we are talking about, where the definition of "unprecedented" is very different from the US.
Lest there be any confusion, Bloomberg further elucidated that Unicom "engaged in organized, cross-departmental faking of financial figures" - according to an internal document leaked to Bloomberg. The disclosure is just another reminder of just how endemic fraud is at both government agencies and various enterprises in China. Recall that back in January, People’s Daily confirmed what everyone had known: the government was officially making up numbers in the rust-belt province of Liaoning, and fabricated fiscal numbers after the local economy was crippled by the commodity crunch.
The Banking Index begins its decline.
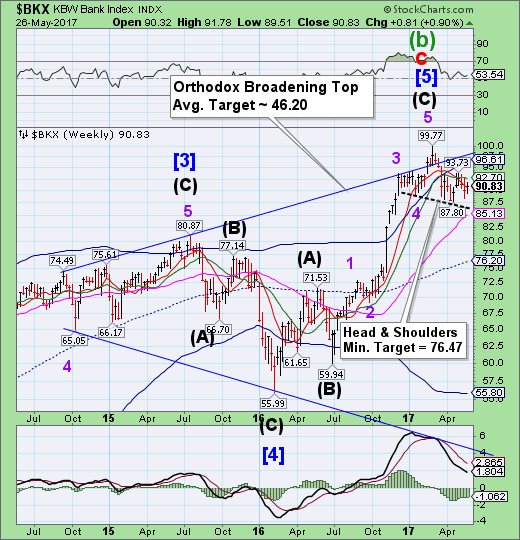
BKX declined from Intermediate-term resistance at 92.81, having completed a right shoulder of a Head & Shoulders formation. The sell signal remains in place with a probable new target near mid-Cycle support at 76.04. Serious investors may be well served to sell any rally rather than buy the dip, as the decline may resume imminently.
President Trump suggested during the campaign that he would break up big banks. But Treasury Secretary Stephen Mnuchin said that's not what he meant.
At issue is a Depression-era law known as Glass-Steagall. It prevented Main Street banks that take government-insured deposits from customers from participating in the riskier investment banking business associated with Wall Street. It was repealed in 1999, leading to mergers that created banking behemoths such as JPMorgan Chase (NYSE:JPM), Citigroup (NYSE:C) and Bank of America (NYSE:BAC).
Congressional proposals, including legislation introduced by Senator Elizabeth Warren, a vocal critic of Wall Street, would reimpose those limits and require breaking up those banks. And Trump has made statements that seem to suggest he supports the idea.
One month ago, China came "this close" to the one event which terrifies Beijing more than anything: a run on China's shadow banks.
As a quick reminder, 150 customers of China's Mingsheng Bank, the country's largest private bank, were furious in mid-April when they learned that some 3 trillion yuan invested in Wealth Management Products, the backbone of China's shadow banking system, had vaporized after bank employees had engaged in fraud and embezzled the funds without ever investing it (later it emerged that Mingsheng employees had put the money into “cultural relics” and jewelry, for their own use).
Back in 2006, some of the wall street banks (ahem, Goldman) managed to layoff quite a bit of their mortgage risk to unwitting European and Asian investors who, in their desperate 'search for yield', had no idea they had just been conned into stepping in front of a freight train. Now, it seems that the same thing may be happening yet again with another favorite wall street structured product, Collateralized Loan Obligations (CLOs).
According to Bloomberg, money managers in Korea, Japan and China are piling into CLOs, and often into the most junior tranches no less, at an alarming rate which has resulted in a staggering 97% increase in YoY new issuance volume.
For months we've written about the imminently doomed auto bubble in the U.S., spurred in no small part by an unprecedented relaxation of underwriting standards by banks that would put even the shenanigans of the 2008 mortgage crisis to shame. From stretched out lending terms to promotional interest rates, auto lenders have increasingly played every trick necessary to get those incremental new car buyers into the most expensive car their monthly budgets could possibly absorb.
That said, in recent weeks there has been growing concern that consumers, auto dealers and/or banks have been going beyond simply relaxing underwriting standards and have instead been forced to commit outright fraud in order to attract that incremental auto volume growth. As UBS Strategist Matthew Mish told Bloomberg, “something is definitely going on under the hood...it’s not just smoke and mirrors anymore.”
Having been accused, and found guilty, of rigging and manipulating virtually every possible asset class, perhaps it was inevitable that Deutsche Bank (DE:DBKGn), currently on trial in Milan for helping Banca Monte deiPaschi conceal losses (as first reported last October in "Deutsche Bank Charged By Italy For Market Manipulation, Creating False Accounts") is now facing accusations that it was actually running an international criminal organization at the time.
