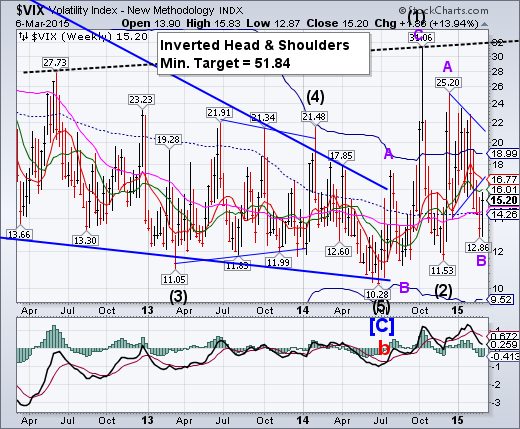
-- VIX a rally above weekly mid-Cycle resistance at 14.26 and Short-term resistance at 15.77 put the VIX on a buy signal (SPX sell signal. A rally above Long-term resistance at 16.77 and the Cycle Top resistance at 18.99 may put the VIX into high gear..
SPX has its first weekly loss since January.
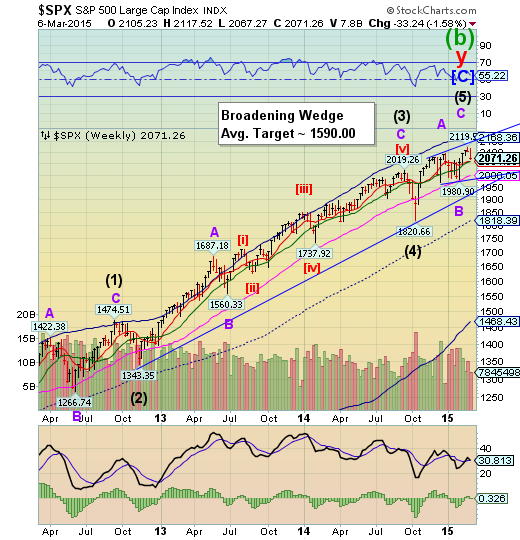
SPX gave up all of its gains for 2015 as it reversed down to weekly Short-term support at 2061.06. A further decline beneath that level confirms the reversal and beneath Long-term support at 2000.05 puts the uptrend in jeopardy. The next decline may not be saved at Long-term support as the last one did on January 29.
(Bloomberg) -- U.S. stocks fell, with benchmark indexes tumbling the most in two months, as better-than-forecast jobs data fueled speculation the Federal Reserve is moving closer to raising interest rates.
The Standard & Poor’s 500 Index fell 1.4 percent, the most since Jan. 5, to 2,071.26 at 4 p.m. in New York. The equity gauge lost 1.8 percent for the week.
“Investors are looking and focusing entirely on what the Federal Reserve will do in the coming months,” Chad Morganlander, a money manager at St. Louis-based Stifel, Nicolaus & Co., which oversees about $170 billion, said by telephone. “Effectively good news in this data point supports the notion that they will raise rates in the not-too-distant future. That scotches the speculative fervor within the equity market.”
NDX meets the upper trendline.
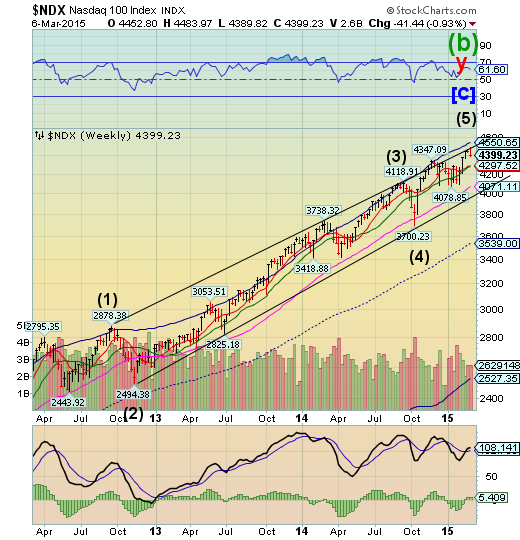
NDX tested the upper trendline of its trading channel on Monday but retreated into the week end.The Composite Index managed to cross above its former high of 5000.00 for two days, but did not close above it.
(ZeroHedge) In the aftermath of Marc Cuban's op-ed from two days ago, that the current,second tech bubble is worse than the first dot com bubble of 2000, there has been much anguish by those deeply invested (on margin) in (bio)tech stocks, to demonstrate that the Nasdaq at 5000, or Biotechs trading at 50x or 5000xP/E, is perfectly normal and the global central banks' $13 trillion in liquidity has nothing to do with it. Of course, the answer who is right and wrong on this issue will not be revealed until after the current bubble pops.
Luckily, there are some very clear clues.
Yield gives up all support.
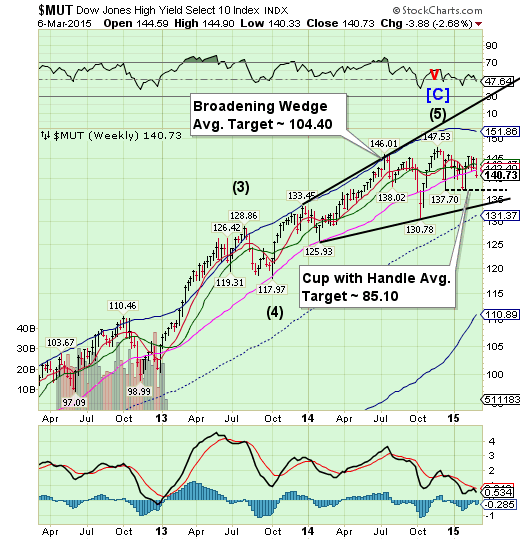
The High Yield Index declined through the entire cluster of Model support levels, leaving the Cup with Handle formation the next target. The Cup with Handle formation has a very high probability of success.The mainstream press has no idea what might be coming…
(NYTimes) Actavis Inc (NYSE:ACT) is showcasing the value of being barely investment grade. The company, a drug maker that has been making many acquisitions, attracted huge demand this week for $21 billion of bonds it is selling at a mere notch above junk status. They yield less than a bigger and higher-rated debt issue that Verizon did in 2013. Buyers of top-tier debt can’t help but keep looking further downward. Fears of deflation, government bond buying, slow growth and a lack of alternatives are squeezing interest rates in developed countries. Germany, for example, persuaded investors to pay for the privilege of lending to it for five years. The United States bond markets are a bit less desperate. The government here is paying 2.09 percent for 10-year debt.That has left corporate issuers in a sweet spot, especially those edging toward junk. When Verizon issued $49 billion of debt rated BBB-plus, it caused a stampede. There was more than $100 billion of demand for a yield of 2.25 percentage points over 10-year Treasuries, or a rate of about 5.2 percent at the time.
The euro pushes lower.
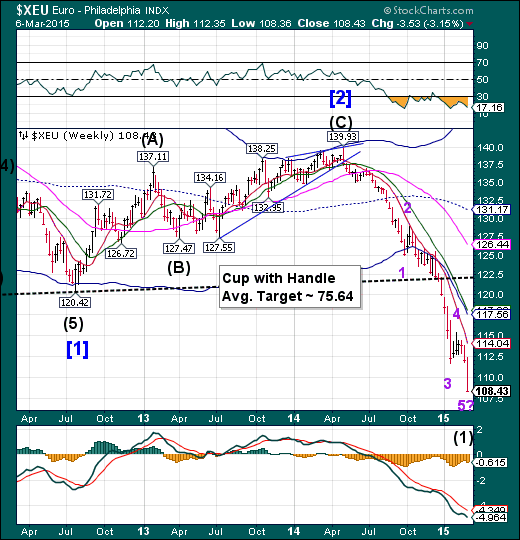
The euro broke below its Wave (3) low and is pushing lower. It anticipates its next Master Cycle low (Wave 5) momentarily, which may surprise the short-sellers. The discussion now is, “How far below parity will the euro go?”
(TheGuardian) The pound has hit a seven-year high against the euro, bringing cheer for British holidaymakers but underscoring fears about the fragile European single currency as markets prepare for a flood of emergency electronic cash.
The euro sank to €1.387 against the pound and also sold off sharply against the dollar before next week’s launch of a €1.1tn stimulus programme in the eurozone. The European Central Bank is to start pumping €60bn a month into the euro economy as the first phase in its quantitative easing programme. The scheme is intended to help get the eurozone back on the path to sustained growth.
Euro Stoxx 50 is challenging its Broadening Top.
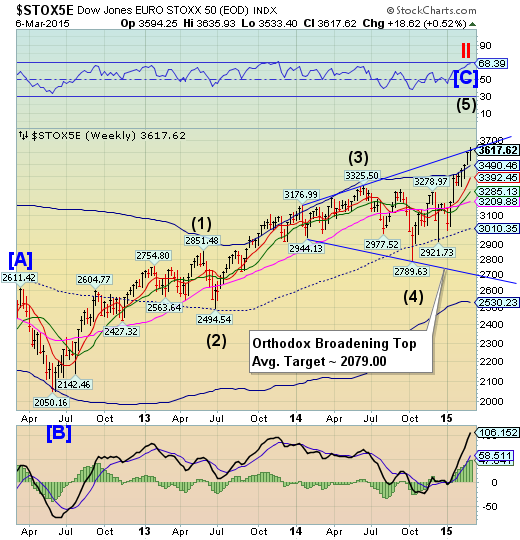
The Euro Stoxx 50 Index appears to be challenging the upper trendline of its Orthodox Broadening Top. This may be a case of “Buy the rumor and sell the news.”The Cycles Model now suggests the top is only days away.
(Bloomberg) -- European stocks are already enjoying their strongest start to a year in more than two decades. Citigroup (NYSE:C) says there’s still further to go.
European stocks will surge another 14 percent this year, Jonathan Stubbs, the bank’s head of Europe and U.K. equity strategy, wrote in a note dated March 5. Citigroup boosted its 2015 forecast for the Stoxx Europe 600 Index to 450 from 400. The benchmark gauge already rallied 15 percent in 2015 to a seven-year high.
The yen may make a deeper low.
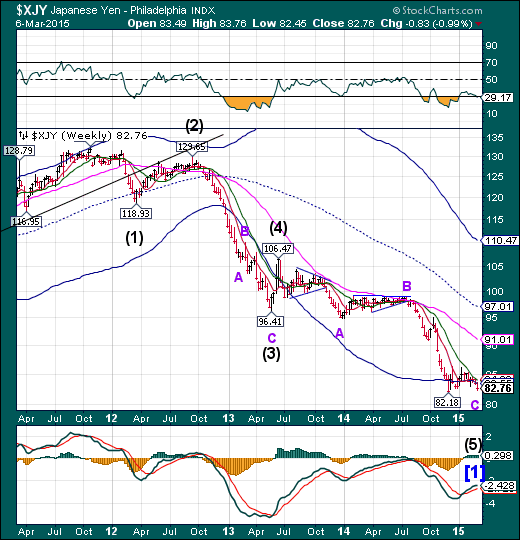
The yen appears poised to make a deeper low. A sideways consolidation often leads to a continuation of the trend and it is down. This may last just a few more weeks at most, but if so, may decline as far as 78.00.
(Bloomberg) -- Japan’s small and medium-sized companies aren’t feeling the benefits of Prime Minister Shinzo Abe’s reflationary policies, said the leader of a labor group that’s fighting for pay increases.
The decline in the yen, which has slumped 29 percent since Abe took office in December 2012, is squeezing these companies through higher import costs, said Yukio Manaka, the president of the Japanese Association of Metal, Machinery and Manufacturing Workers.
“We are seeing raw material costs skyrocket because of the yen’s depreciation, putting pressure on business performance,” Manaka, 59, said at a briefing in Tokyo on March 4.
The Nikkei Average appears to lose momentum.
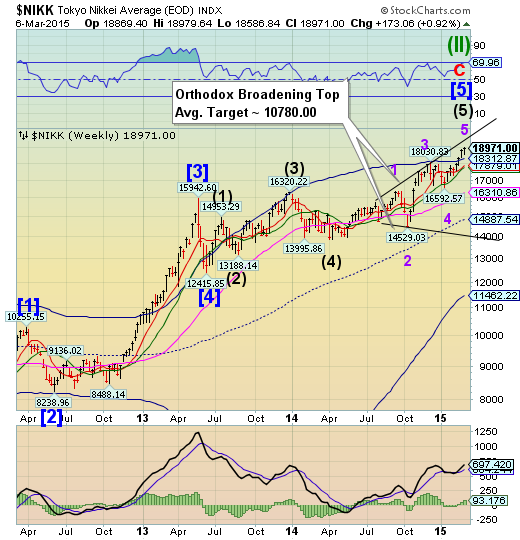
The Nikkei appears to be losing upward momentum as it approaches its 6-year anniversary of the March 9, 2009 low. It may continue rising to its anniversary, but the risk of a reversal is mounting. The Orthodox Broadening Top agrees with that outcome, since it represents a market that is out of control and has a highly emotional public participation. This may be the start of a dramatic decline that may be imminently due.
(JapanTimes) The Nikkei 225 average on Friday rewrote its highest closing level in 14 years and 10 months, boosted by purchases on persistent hopes for fund flows into global stock markets.
The key market gauge surged 219.16 points, or 1.17 percent, to close at 18,971.00, the best finish since April 19, 2000.
The Topix gained 17.12 points, or 1.12 percent, to end at 1,540.84.
The TSE opened higher after the European Central Bank on Thursday announced details of its quantitative monetary easing.
A wide range of issues attracted purchases on the back of heightened hopes that more investment money will flow into stock markets around the world, with the Nikkei average coming within striking distance of 19,000.
U.S. Dollar heading higher, but may reverse abruptly.
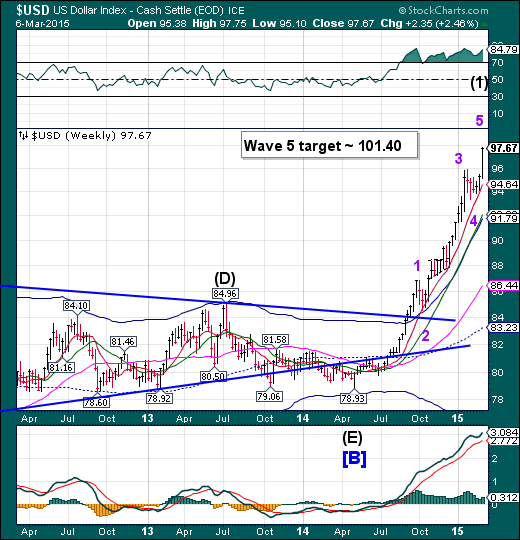
The US dollar appears to be in need of finishing Minor wave 5 before reversing back down. The rally may stop at 100.00, but seems to be targeting 101.40. This has been an extended rally and the Cycle is getting stretched. It’s time for caution here.
(WSJ) The dollar pushed to an 11-year high against the euro on Friday, after a strong U.S. jobs report solidified market expectations for the Federal Reserve to raise interest rates around midyear.
The euro fell to $1.0839 in late-afternoon trading in New York, its lowest level against the dollar since Sept. 4, 2003. The euro recovered slightly to end the session down 1.7% at $1.0843 in its largest one-day decline in six weeks.
The U.S. economy added 295,000 jobs and the unemployment rate ticked down to 5.5% in February, according to the Labor Department. Economists had predicted 240,000 jobs were created last month and the unemployment rate would fall to 5.6%.
USB in a shake out.
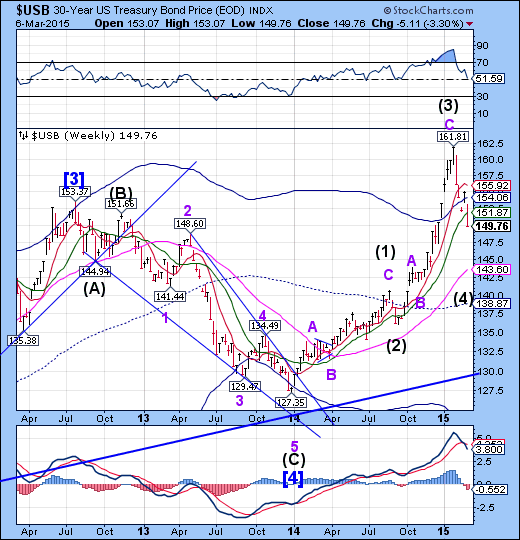
The Long Bond is doing a shake out of weaker hands in Wave (4).Since the end of January liquidity has been rotating out of bonds and into stocks and commodities as the Cycle inverted. The decline appears to be targeting weekly Long-term support, currently at 143.60. Once accomplished, the rally in bonds may continue through mid-year.
The Bond Vigilantes are back!
(WSJ) U.S. government bonds suffered the biggest one-day selloff since November 2013 as a solid U.S. employment report stoked fears that the Federal Reserve may raise interest rates in June.
Investors including hedge funds and portfolio managers shed holdings as they are worried that higher official interest rates from the central bank would undermine the value of outstanding bonds. Traders said the selloff reminded them of the “taper tantrum” during the summer of 2013 when the bond market was rattled by concerns of a pullback in the Fed’s bond buying monetary stimulus.
“The selloff is seriously ugly and quite bloody,” said Christopher Sullivan, who oversees $2.45 billion as chief investment officer at the United Nations Federal Credit Union. “The U.S. economy is poised to continue to be on an upward slope. A rate increase in June cannot be ruled out.”
Gold breaks down.
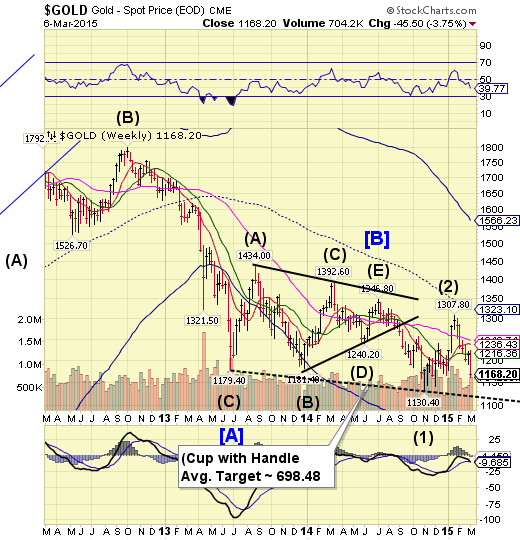
Gold broke down beneath its January 2 low and appears to be capable of declining to or beneath its Cup with Handle formation. If so, the decline may last through the end of March.
(WSJ) Gold prices saw their sharpest drop in more than a year Friday, after data showing strong U.S. job growth last month bolstered the case for the Federal Reserve to raise interest rates around the middle of 2015.
Gold for April delivery, the most actively traded contract, fell 2.7% to $1,164.30 a troy ounce on the Comex division of the New York Mercantile Exchange. That was the lowest settlement for the most-active gold contract since Nov. 13, 2014, and the biggest drop for gold prices since December 2013.
For the year, prices are down 1.7%, below the Dec. 31 settlement of $1,184.10 for the first time.
Crude may be ready to rejoin the decline.
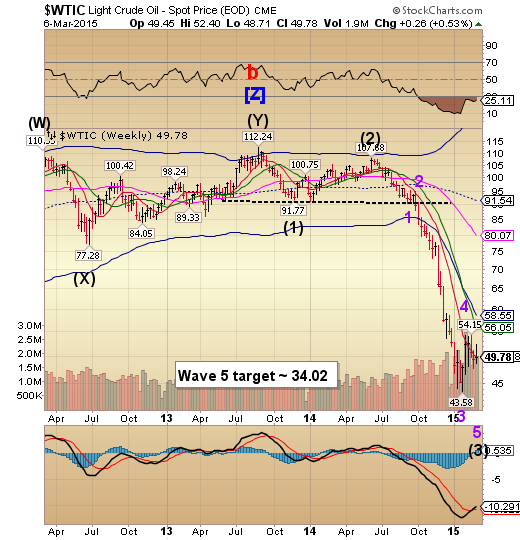
Crude appears to be st up to rejoin the decline. The shakeout attempt ran out of gas. There may be a mid-month pause in the decline, but it appears capable of running through the month of March before another correction may be due.
(ZeroHedge) Don’t look now, but the sharp slide in crude prices may be leading the proverbial sheep to slaughter. Investors have piled into the market’s largest crude ETF over the last several months sending the number of shares outstanding to the highest level since 2009. We suspect many of these “investors” might be unaware that they’re currently staring down the most severe decoupling between second- and first- month contracts in four years.
"normal" knife catching BTFD'ers piled into USO for the bounce...
Shanghai Index completing a reversal pattern.
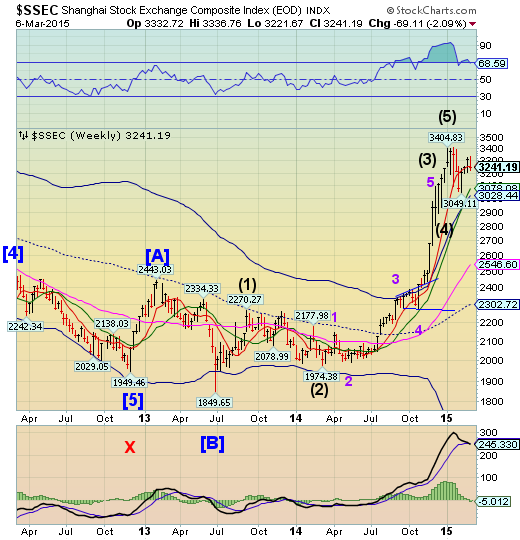
The Shanghai Index fell back below weekly Short-term support/resistance at 3255.80 this week, confirming the retracement and resumption of the decline. The Shanghai Index may be in a panic decline that could last into May. The index had its final ramp on Monday and has been in decline since. Volatility is on the rise in China, despite massive liquidity injections.
(ZeroHedge) You wouldn't know it if you looked at the price of oil, but arguably the world's largest economy just unloaded a kitchen sink of fears, warnings, and downgrades on its economy; the most notable being:
*CHINA SETS 2015 GDP GROWTH TARGET AT ABOUT 7% (from 7.5% in 2014)
In a report to be delivered to the government tonight, Premier Li Keqiang warned China may face more economic difficulties in 2015 vs 2014 and downward economic pressure is still growing (despite Western 'analysts' proclaiming China fixed). The currency is weakening on the news and AsiaPac stocks are lower and as Chinese stocks open lower (despite hints at more easing), millions of newly minted "can't lose" Chinese investors begin to worry.
The Banking Index spiked, but no new high.
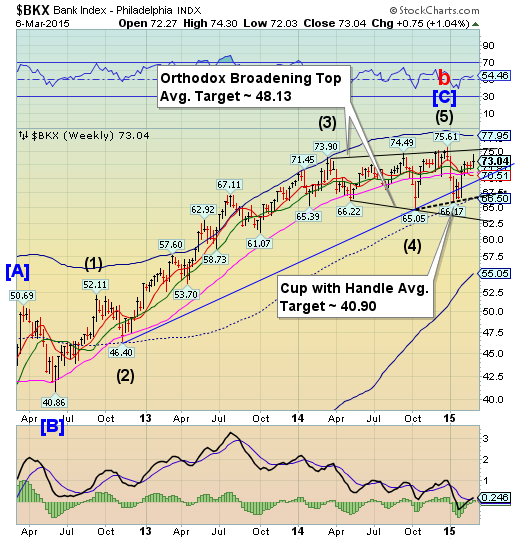
--BKX spiked higher today, but couldn’t change its bearish outlook. This is the index that will lead equities and commodities in their next decline. The Cycles Model now implies that the next decline may last through mid-April. Could this be a waterfall event?
(ArmstrongEconomics) The biggest problem we have with central banks is that they are run by academics with ZERO real world experience. This applies not just at the Fed, but most central banks with the lone exception of Bank of China. The greatest danger this presents is that the money-center banks manipulate the central bankers during states of financial panic and they who are so frightened, they will do whatever the money-center banks tell them
In the USA, there is nobody who would investigate the dark corners of the Federal Reserve being manipulated by the NY bankers who walk of water without ice. However, the system is much more open in Britain where the bankers do not control the courts as they do in New York City. Consequently, the Bank of England (BoE) is now being investigated by the Serious Fraud Office (SFO) for being “too” friendly with the money-center banks during the crisis of 2008.
(ZeroHedge) Not "contained." Just six short months ago, the 2Y bonds of Austria's bank bank - HETA Asset Resolution AG - were trading well above par as the world and his mom reached for yield (~6%) in all the wrong places. Today, following the "spectacular development" over the weekend that the bank will be wound down due to the discovery of an $8.5bn "hole" in its balance sheet, the 2Y HETA bonds are trading below 50c on the dollar (at a yield of 54%). This is indeed Austria's "Lehman" moment as for the first time in the new European 'bail-in' era, senior debt is getting a massive haircut.
(TheEconomist) BANKS are yet again in trouble—not pure investment banks such as Lehman Brothers, or mortgage specialists such as Northern Rock; but a handful of huge global “network” banks. These lumbering giants are the woolly mammoths of finance, and if they cannot improve their performance they deserve a similarly grievous fate.
(ZeroHedge) For the first time in public, though practically the entire world assumed it, an official from The IMF has admitted that the various Greek bailouts were not for The Greeks at all... "They gave money to save German and French banks, not Greece,” Paolo Batista, one of the Executive Directors of International Monetary Fund told Greek private Alpha TV on Tuesday. As KeepTalkingGreece reports, Batista then went on to strongly criticized not only the euro zone and the European Central Bank but also the IMF and the Fund’s managing Director Christine Lagarde for defending Europe much too much...
