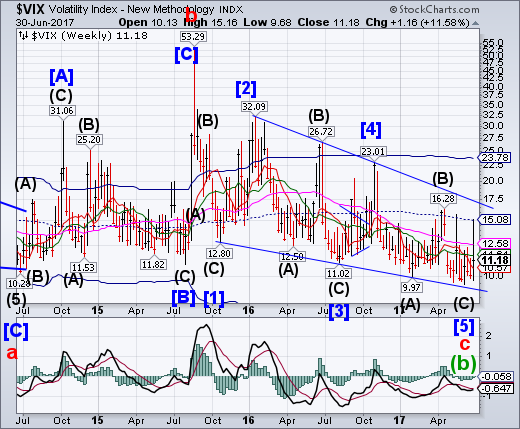
VIX challenged its mid-Cycle resistance at 15.08 before closing beneath Intermediate-term resistance at 11.61. A rally that closes above Long-term resistance at 12.58implies that VIX may challenge its Ending Diagonal trendline at 17.50 in the following move.
There’s been a growing chorus lately suggesting that perhaps the record low VIX readings aren’t due to record low feelings about volatility, but instead due to the dramatic increase in VIX products and assets betting on decreases in volatility.
As RCM Alternatives notes, it sure feels like that is the case, with every move higher in the VIX seemingly smacked down earlier, and with more force, than the one before it.
SPX breaks its Diagonal trendline.
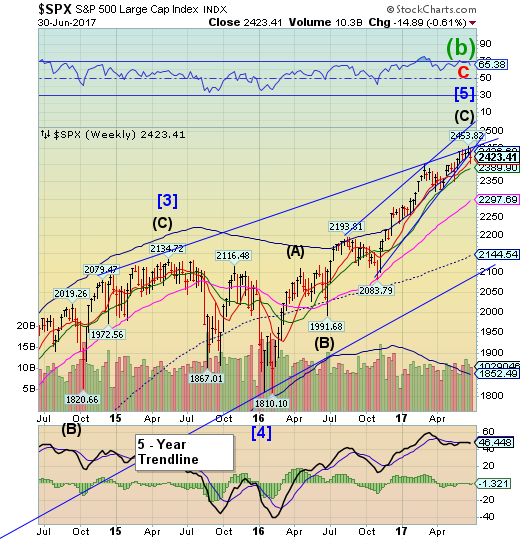
SPX broke through its Cycle Top and Ending Diagonal trendline at 2436.60, closing beneath them.It has also challenged the Weekly Short-term support at 2413.76, suggesting the next decline may successfully continue beneath it. This may be the start of a decline that completely retraces the rally from the February 2016 low.
With the Shiller CAPE index having surpassed the 30x for the first time since September 2001, its creator, Nobel Laureate and Yale School of Management Economics Professor Robert Shiller is warning investors that they should be cautious about investing in such an “unusual” market.
“… the CAPE index that John Campbell and I devised 30 years ago is at unusual highs.
The only time in history going back to 1881 when it has been higher are, A: 1929 and B: 2000.
We are at a high level, and its concerning.
NDX also declines beneath its trendline.
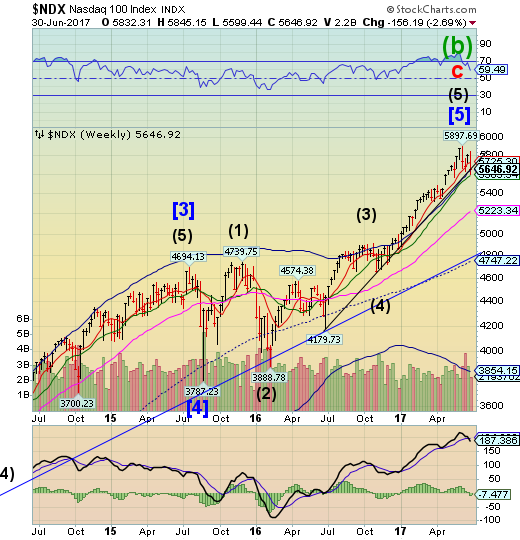
NDX had another bad week as it broke beneath its Brexit trendline.A decline beneath Intermediate-termsupport at 5583.84implies that a deepercorrection is in order. Both SPX and NDX have a potential 3-week decline ahead of them. Its time to take necessary precautions.
The sell-off in government bonds that extended for a fourth day on Friday could signal pain ahead for the stock markets, particularly for an unexpected sector: Technology stocks.
In fact, some analysts have noticed a strong correlation between bonds and the likes of Facebook (NASDAQ:FB), Amazon (NASDAQ:AMZN), Apple (NASDAQ:AAPL), Microsoft (NASDAQ:MSFT), and Alphabet (NASDAQ:GOOGL). This is odd because tech companies are cyclical and their stocks are expected to do the exact opposite of that and then some.
High Yield Bond Index declines to support.
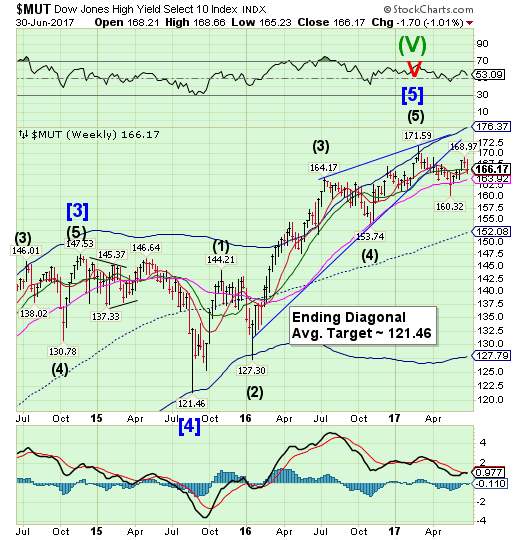
The High Yield Bond Indexdeclined to challenge Intermediate-term support at 166.05 before a small bounce into the weekly close.The sell signal may be reinstated beneath that support level.The Cycles Model suggestsweakness may continue on a timetable similar to that of equities.
Oil’s plunge into a bear market has broken the link between bonds of junk-rated U.S. energy companies and their peers. The yield on a Bloomberg Barclays (LON:BARC) index of high-yielding energy-company debt has jumped 1 percentage point in the past month, while the average yield on a junk bond index that excludes energy companies has barely moved. A drop in oil prices below $35 a barrel may drive yields higher across the board, strategists at Deutsche Bank AG (DE:DBKGn) said in research note this week.
USB tests Short-term support.
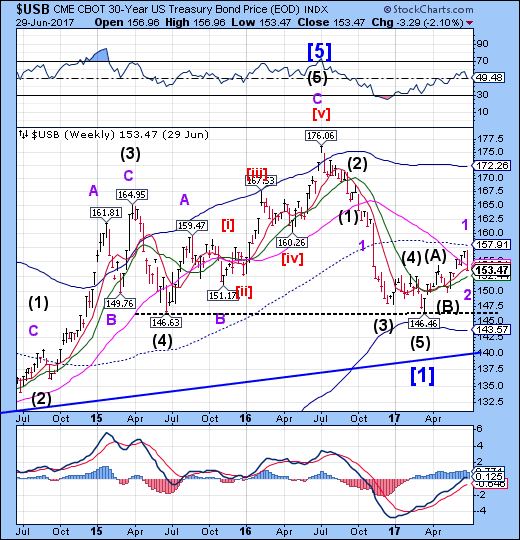
The Long Bond pulled back from its rally to challenge Short-term support at 153.81. The next higher challenge appears to be mid-term resistance at 157.91 Therally has quite a distance to go, since it must complete the right shoulder near 165.00 before plunging through the neckline near 146.00.
More central banks may be following the Federal Reserve's hawkish lead, sending bond yields skyrocketing
Treasury yields have broadly risen after a batch of mixed data offered some optimism to investors hoping for an improvement to second-quarter growth, but demonstrated the difficulty of anticipating the economy's near-term direction.
The 10-Year Treasury yield rose 1.8 basis point to 2.285%, contributing to a 14 basis point jump over the past week. The 30-Year bond, or the long bond, gained 1.7 basis point to 2.831%, while the 2-Year note was relatively unchanged at 1.370%. Bond prices move up when yields go down; one basis point is one hundredth of a percentage point.
The euro testing resistance.
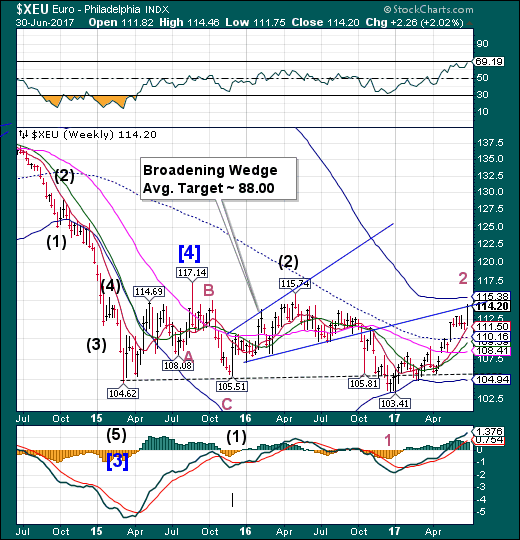
The euro attempted a test ofits weekly Cycle Top resistance at 115.38, but fell short at the Broadening Wedge trendline. Should it break through, the rally may only last a few more days. There is an alternate pattern that suggests a potential rally beyond the Cycle Top. However, a pullback should develop first. .
The euro extended its gains and rose to levels not seen since May 2016 as momentum buying kept the shared currency above $1.14 amid better-than-forecast German regional inflation data.
European Central Bank President Mario Draghi may have suggested that the ECB is moving toward a less inflation-sensitive stance, but investors couldn’t overlook beats in consumer prices in Saxony and other German regions. Profit-taking and fresh supply was met by model accounts buying the dip each time during the London session, traders in Europe said.
Euro Stoxx declines through Intermediate-term support.
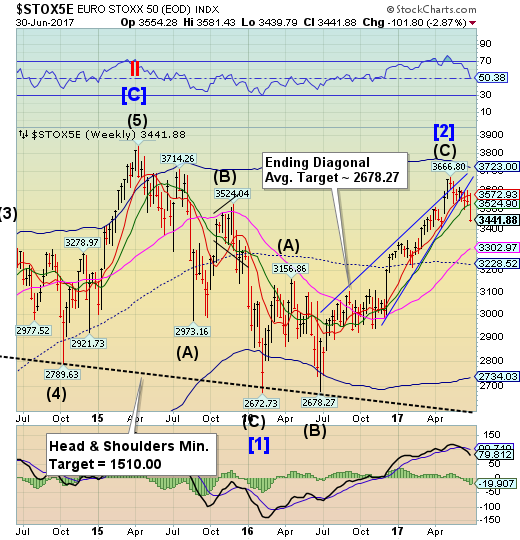
The Euro Stoxx 50 Indexfell through Intermediate-term support at 3524.90 for the worst weekly loss of the year. This decline has confirmed the sell signal for the EuroStoxx. The Cycles Model calls for up to three more weeks of decline.
After a choppy day, European shares sealed their worst month and first quarterly loss in a year as worries over signs of tightening monetary conditions soured the mood.
The pan-European STOXX 600 index closed down 0.3 percent and euro zone blue chips fell 0.9 percent, while Britain's FTSE 100 fell 0.5 percent.
The STOXX was down 2.7 percent in June, following four straight months of gains driven by an easing of political worries in the euro zone and brighter economic prospects.
But hawkish remarks from central bankers this week that boosted bond yields and the euro sparked a broad sell-off, with stocks that benefit from lower rates and export-oriented companies particularly under pressure.
The yen tests Mid-Cycle support.
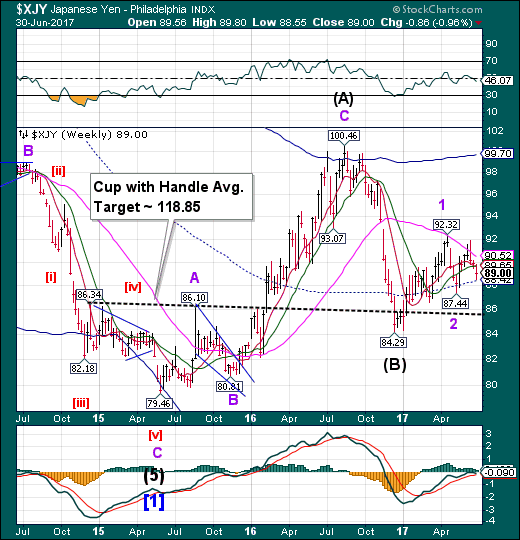
The yen tested mid-Cycle support at 88.42, closing above it.This week’s pullback appears to be an important test of support prior to launching higher. The rally appears to have resumed as indicated. A breakout above Long-term resistance at 90.52may alter the pace of the rally.
The market has focused on one key issue — the tone of central bankers' comments. That's why we have seen euro and poundrising, while the yen fell against US dollar.
The ECB and the BOE adopted a more hawkish position than the market expected, the Fed didn't surprise by the words "gradual rate increase", and the BOJ keep saying it's too early to remove the stimulus.
However, the USD/JPY moves on Thursday make us think the reversal is coming. Weaker-than-expected GDP coupled with decreasing Personal Consumption point to a subdued inflation pressure. And it means the Fed has no reason to rush with further rate increases.
The Nikkei eases from its high.
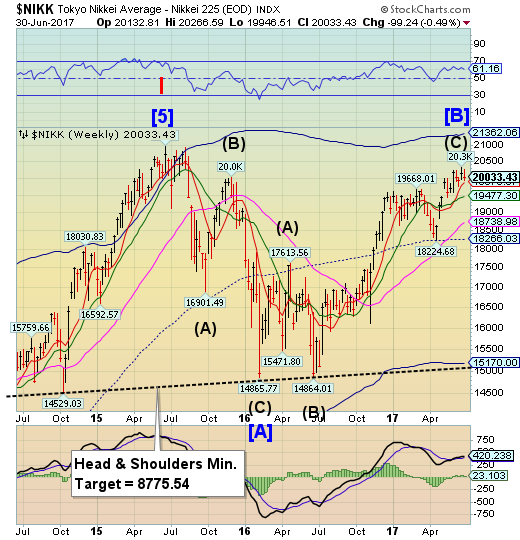
The Nikkei eased away from its high, but managed to close above 20000.00.The Cycles Model suggests areversal may be developing, but a sell signal may not be generated until the NIKK declines beneath Short-term support at 19878.57. Further confirmation of the decline lies at Intermediate-term support at 19477.30.
Stocks in Japan declined, led by electronic makers and technology companies, following the biggest selloff on the S&P 500 Index in six weeks as investors assessed the prospects that central banks worldwide are turning hawkish.
Nintendo Co (T:7974)., SoftBank Group Corp.and Sony Corp (T:6758). were among the biggest drags on the Topix index. A gauge that measures fluctuations in Nikkei 225 Stock Average constituents jumped 16 percent, the most in three months, after volatility in U.S. equities surged as much as 51 percent on Thursday when the yield on the 10-year Treasury note topped 2.29 percent for the first time in a month. The dollar remained weaker against the yen into a third day.
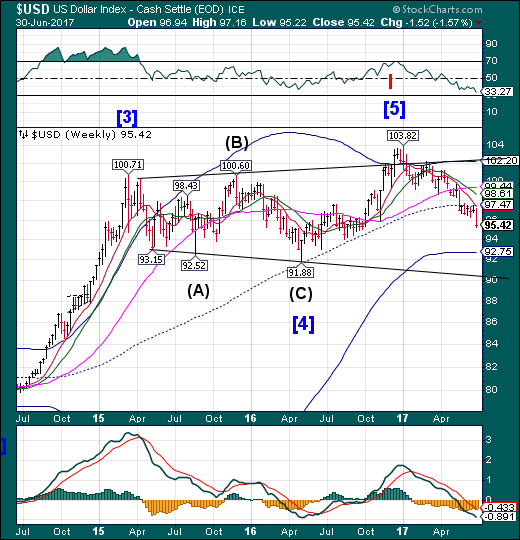
USD resumed its decline from Sort-term resistance at 97.41and mid-Cycle resistance at 97.47.The Cycles Model now allows for a continued decline for another three weeks. The near-term Orthodox Broadening Top target appears to be near 85.50.
The U.S. dollar recovered slightly on Friday, but posted its biggest quarterly decline against a basket of rival currencies in nearly seven years after hawkish signals from foreign central banks this week pressured the greenback further.
Investors have ramped-up expectations for tighter monetary policy from the European Central Bank, Bank of England and Bank of Canada after hints from officials this week.
This has made the greenback less attractive, in addition to skepticism that the Federal Reserve would be able to raise interest rates again this year given a recent batch of weak U.S. economic data and doubts that U.S. President Donald Trump could enact his pro-growth agenda.
Gold challenges Long-term support.
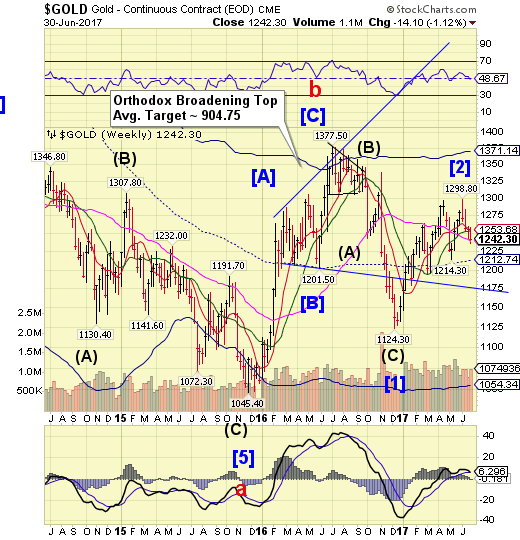
Gold declined to challenge Long-term support at 1239.41 before closing above it.The Cycles Model suggests that the expected Master Cycle low may have occurred on Monday. This implies a probable two weeks of rally before resuming its decline.However, a break of Long-term support implies that the decline has resumed.
Gold and silver prices slipped this week in the international as well as domestic markets. Gold prices are heading for the first monthly loss in June 2017 with Comex gold declining by 1% week-on-week and MCX futures by 0.9% week-on-week. Rising interest rate scenarios, weak investment demand, and optimism about the US economic growth and hints from leading central banks to end the era of easy money policy spells trouble for gold prices. Although, dollar index is standing at nine mon ..
Crude bounces from a new Head & Shoulders neckline.
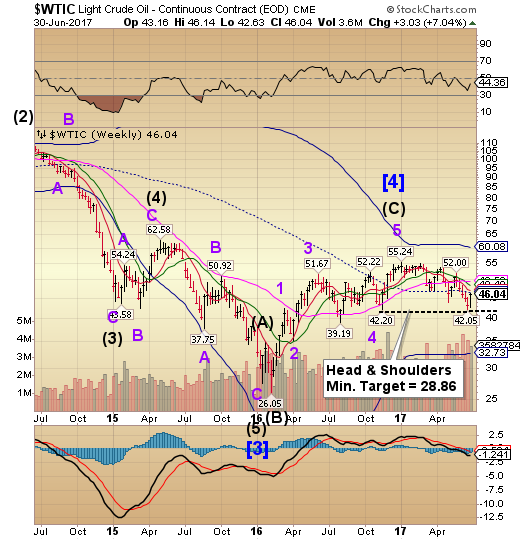
Crude bounced at 42.05, leaving a new Head & Shoulders neckline then stopped beneath mid-Cycle resistance at 46.41.The bounce may last a few days to a week, but the decline is due to resume shortly. A decline beneath the Head & Shoulders neckline is bearish and treated with respect.
Oil climbed on Friday for a seventh straight session as a decrease in the U.S. rig count and stronger demand data from China lifted depressed prices that still finished the first half with the biggest decline for that period since 1998.
Earlier, Chinese data showed factories grew at the quickest pace in three months. Rob Haworth, senior investment strategist at U.S. Bank Wealth Management, said the Chinese data "certainly gives you hope that demand is growing globally."
Shanghai Index closes above Intermediate-term resistance.
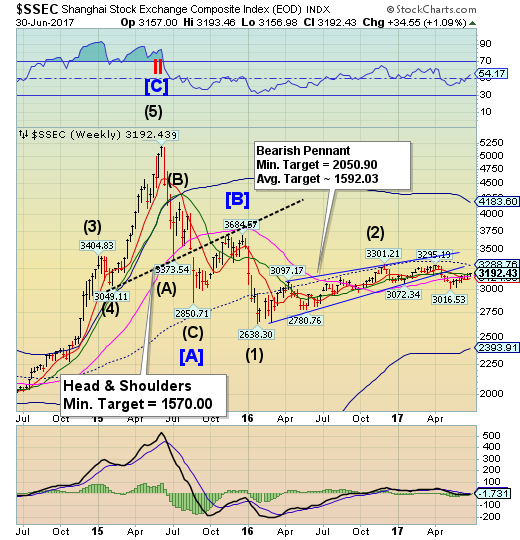
The Shanghai Index closed above Intermediate-term resistance at 3173.95, but is nearing the end of its Cyclical period of strength. It is now due for up to three weeks of weakness. The potential for a sharp sell-off is rising.
Validating the recent surge in iron ore, which has jumped more than 18% from 2017 lows hit just two weeks ago on speculation the PBOC may be willing to flirt with another round of inflation, overnight Beijing reported an unexpectedly strong bounce in its manufacturing and service sectors.
China’s NBS June manufacturing PMI came in at 51.7 for June, above both the previous reading of 51.2 and expectations of a 51 print, remaining comfortably above the 50-point expansion line. This was the second highest level of 2017, on the back of improving market sentiment and industrial upgrading, according to an NBS statement posted on its website, despite an ongoing troubling contraction in the employment subindex. Unlike the Caixin PMI, the official index tracks mostly larger, state-owned enterprises.
The Banking Index completes its correction.
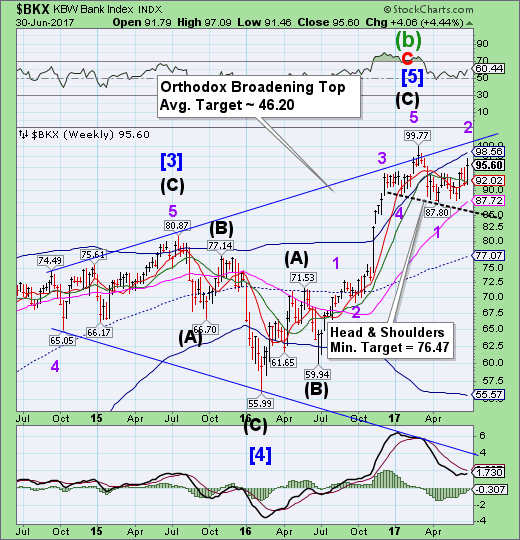
BKX challenged Intermediate-term support at 92.02 before rallying to a new retracement high.Theshorts were being squeezed again.Weakness may develop as BKX declines beneath its Intermediate-term support again.
For the fourth straight quarter, several of the biggest U.S. banks are reporting earnings on the same day, setting up a situation that overwhelms analysts covering the industry.
In a report on Friday, Barclays analyst Jason Goldberg noted that 10 of the 19 largest banks by market value are reporting results on just two days next month, on July 14 and 21st.
"Seems excessive," he wrote.
Big bank earnings days can be a hectic and frazzled experience for analysts, who must interpret thick documents packed with financial arcana, juggle multiple conference calls with management teams, investor relations departments and clients, and meet hard deadlines to distribute a final take on whether stocks remain a buy, hold or sell.
It took a decade — and $200 billion in fines — but the big banks are back.
The Federal Reserve’s passing grade for all 34 of the institutions it checks annually for financial soundness — the first all-clear since the Fed tests began in 2011 — is a watershed moment.
While some of the consequences will be felt sooner than others, they will be far-reaching. The immediate winners include investors as well as bank executives, who could see their already ample pay packages expand further.
Even as the broader market fell Thursday, bank stocks surged as investors cheered the big dividend increases announced by JPMorgan Chase (NYSE:JPM), Wells Fargo (NYSE:WFC), Citigroup (NYSE:C) and others following the Fed’s statement.
As we previewed exactly 24 hours ago, Buffett’s Berkshire Hathaway (NYSE:BRKa) said it will exercise warrants to swap its preferred Bank of America (NYSE:BAC) shares for 700 million shares of BAC common stock, making Buffett the largest shareholder, surpassing BlackRock, Vanguard and State Street . Buffett is also the top shareholder at Wells Fargo.
Buffett exercised his warrants, which were due to expire in 2021, to swap $5 billion in preferred stock worth about 6% of the company for common stock at $7.14 a share, less than a third of yesterday’s closing price of $24.32, effectively translating in a profit of $12 billion for the Omaha octogenarian. The decision was prompted by the latest Fed stress test, which allowed the bank to hike its dividend by 60%, from 30 cents to 48 cents. BofA also announced its plans for a record $12 billion stock buyback, almost immediately after the Federal Reserve gave it the green light on Wednesday, while also approving the capital-return plans of 32 other US banks that received the SIFI designation.
The hedge fund industry is finding itself in increasingly dire straits as persistently weak returns and the advent of low-cost investing have forced more and more funds to shut down. So, it's unsurprising that, amid this steadily worsening backdrop, more traders are heading for the exits. But where are the heading? Increasingly, more traders are moving back from where they came - i.e. the big banks, which expect to see a boost in trading revenue as President Donald Trump has vowed to dial back postcrisis regulations that forced banks to wind down their prop desks.
