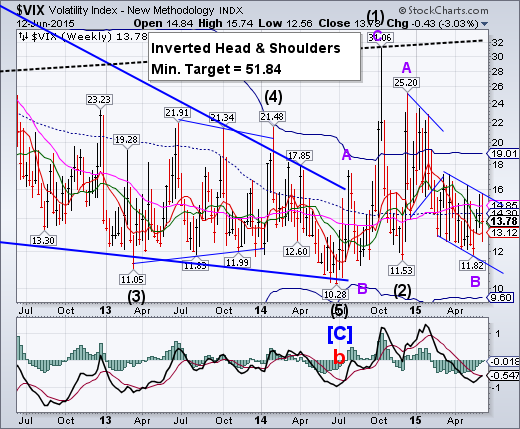
-- VIX challenged its Short-term support at 13.13, then closed above Intermediate-term support at 13.66, maintaining the aggressive sell signal for SPX. A breakout above its prior high at 15.74 will announce the resumption of the rally and confirm the sell signal.
SPX closes a second week beneath two major supports.
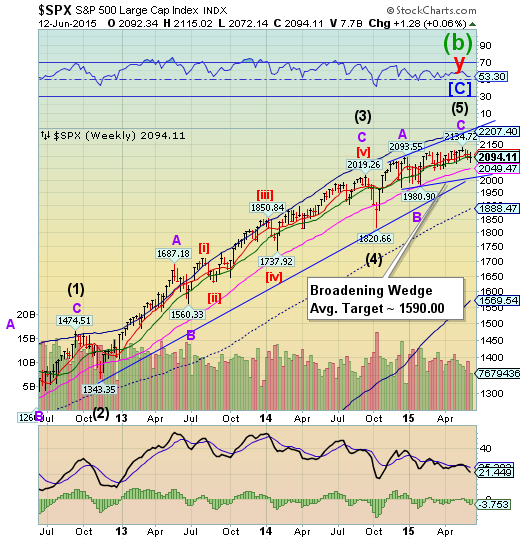
SPX remained beneath its Intermediate-term support at 2096.70 despite a massive effort to regain the topside. This leaves SPX on a sell signal and vulnerable to a drop to or below the next (Long-term) support level at 2049.47 and the double trendlines near 2020.00 (also round number support at 2000.00).
(OfTwoMinds) What happens to price in a bidless market? It goes off a cliff.
As you probably know by now, it turns out lemmings didn't voluntarily commit mass suicide: they were driven off the cliff by those in charge. Lemming Suicide Myth: Disney Film Faked Bogus Behavior.
Investors in stocks, bonds and real estate are being herded off the cliff by the Federal Reserve. The name of the game in the New Normal is to force investors large and small into risk assets. When the risk assets blow up, the herd plunges headlong over the cliff en masse.
NDX loses double support.
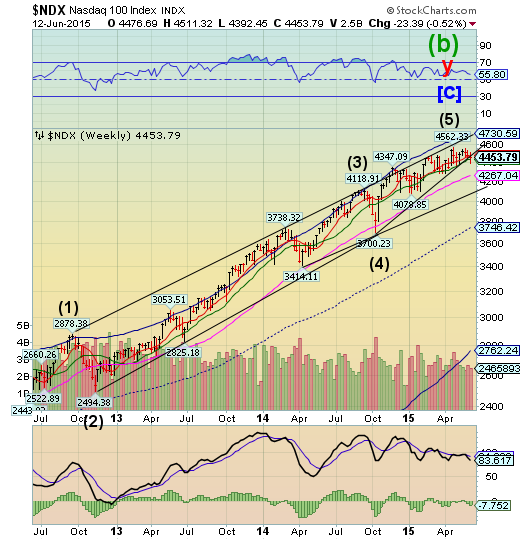
NDX lost its weekly Short-term support and Ending Diagonal trendline at 4476.33 this week.The loss of those supports puts NDX on a sell signal.This implies a complete retracement to its October 15 low at 3700.23.
(WSJ) U.S. stocks declined Friday as a setback in the financing talks between Greece and its creditors raised worries about the country’s ability to reach a bailout deal.
The Dow Jones Industrial Average dropped 140.53 points, or 0.78%, to 17898.84. The S&P 500 index fell 14.75 points, or 0.70%, to 2094.11, and the Nasdaq Composite Index declined 31.41 points, or 0.62%, to 5051.10.
Losses were broad-based, with all 30 Dow components and all S&P 500 sectors in negative territory. Energy stocks in the S&P 500 fell the most, down 1.2%, followed by health-care stocks which fell 1.1%.
High Yield Bonds have lost all nearby support.
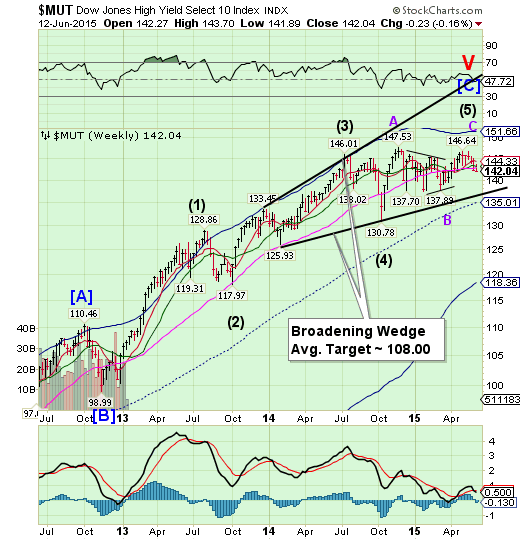
The High Yield Index has lost all Model supports and appears destined for the lower trendline of its Broadening Wedge formation.It is also due for a major low by early July. With that low, we may see the cessation of stock buyback announcements.
(ZeroHedge) While we are now well aware of the unpatriotic-ness of tax inversions, Goldman Sachs (NYSE:GS) raises the red flag on another corporate action that is about to become highly politicized - share buybacks. The last (and only) pillar of buying left in the US equity markets is set to draw political attention and likely to gain prominence, particularly ahead of the 2016 election.
Stock repurchases continue to grow and have begun to attract political scrutiny. Buybacks have increased throughout the recovery, totaling over $500 billion in 2014 among S&P 500 companies and representing more than one-third of cash use and about half of earnings. Our equity strategists expect buybacks to rise to around $600 billion in 2015.
The euro completed its retracement.
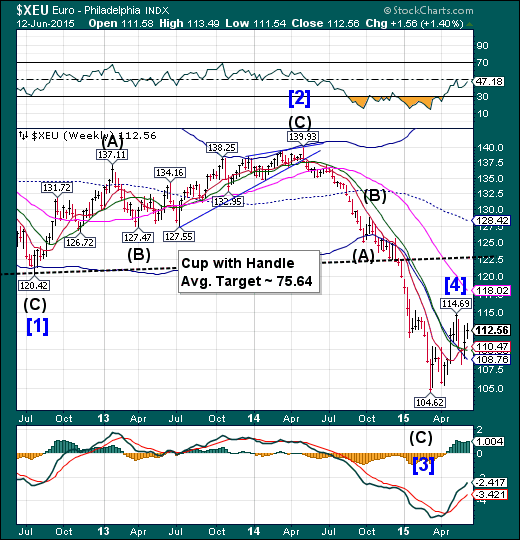
The euro completed an 82% retracement of its recent decline. This week the rumors about a solution to the Greek crisis are having less effect. We may see the euro resume its decline through mid-June next week.
(ZeroHedge) Headline hockey remains all that matters if one is "trading" European stocks, bonds, or FX. Today, so far, no deal... and so Athens Stock Exchange and Greek bank bonds are plunging (for now)...
Greek Bank Bonds are probably the most sensitive financial instrument to the endgame in Greece...
(And again) While talking heads have proclaimed any Grexit contagion will be contained... it appears they are wrong (surprise!). The last 2 days have seen sovereign bond spreads soar 25-35bps for Spain, Portugal and Italy. On the yield side, Spain 10Y spread to Bunds is at its highest since August 2014 and Portugal at its highest since Feb 2015.
Euro Stoxx bounce off weekly long-term support.
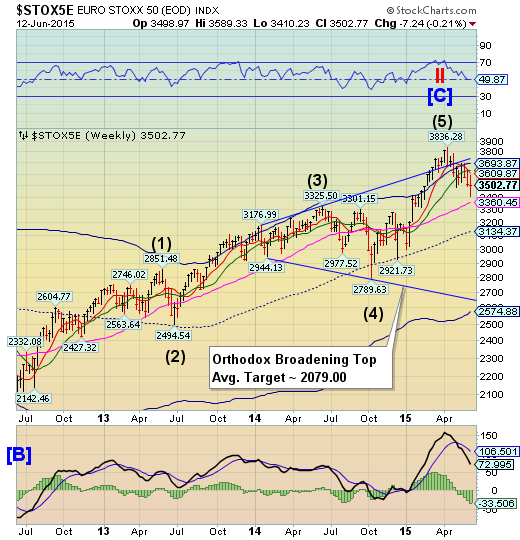
Euro Stoxx 50 declined toward its Long-term support at 3360.45 but bounced at the end of the week. It is on a sell signal that may last through the month of June.A panic decline through the end of June is not out of the question.
(Bloomberg) European stocks trimmed their weekly gain amid increasing concern that Greece’s efforts to renegotiate its debt and stay in the single currency will fail.
The Stoxx Europe 600 Index slipped 0.9 percent to 389.38 at the close of trading, paring its weekly gain to 0.1 percent. Greece’s ASE Index lost 5.9 percent, for the biggest decline among western-European markets, with National Bank of Greece SA and EurobankErgasias SA falling more than 10 percent. Portugal’s PSI 20 Index posted the second-worst performance, with a 1.5 percent drop.
The yen reverses from its Cycle Bottom.
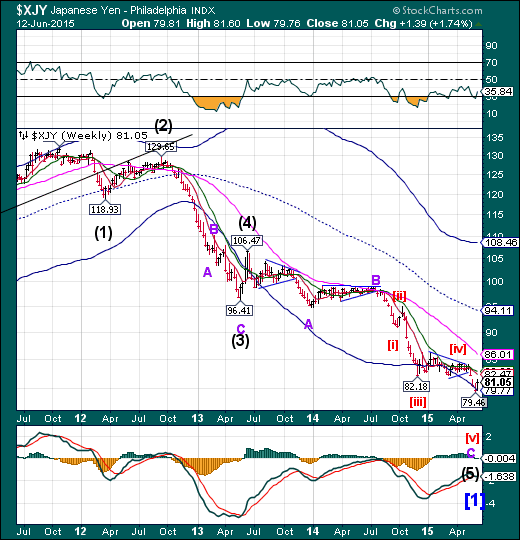
The yen reversed from its Cycle Bottom support this week, giving birth to a new upswing. The Cycle low came on June 5. The initial rally may last up to a month, according to the Model.
(Quartz) Up until this week, the view on Japan’s economy was decidedly negative. Despite a massive bond-buying program poised to continue expanding, economic growth was looking fairly weak and the policy had failed to stoke inflation. As a result, investors started dumping the currency, which fell hard against the US dollar, sliding 5% between May 13 and June 5 and bottoming out last week after a very solid US jobs report, which boosted the dollar in relative terms.
Then Japan surprised markets with an upward revision of its first-quarter GDP numbers, reviving investor confidence. More importantly, Bank of Japan governor Haruhiko Kuroda told legislators that the yen had probably fallen as much as it could against other major currencies, which sparked a rally. The surge has dissipated a bit since then, but in the meantime the yen took a 1.7% bite out of the greenback (as shown in chart below), showing it has more muscle than skeptics thought.
The Nikkei bounces, but no new high.
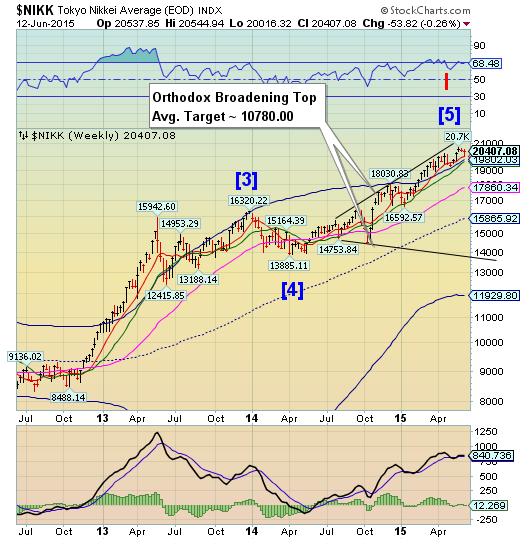
The Nikkei tested its weekly Short-term support at 20001.36, then bounced, but without the completion of a new high. This suggests that the strength of the rally is waning. A loss of Short-term support may warn us of an impending reversal.
(Reuters) Japanese stocks were choppy in early trade on Friday, as investors were cautious after another turn for the worse in Greece's debt talks, while Toshiba Corp. (TOKYO:6502) fell on a report that it will likely admit internal controls were inadequate.
The Nikkei share average was up 0.06 percent to 20,395.3 in mid-morning trade after nudging in and out of negative territory. The index soared 1.7 percent on Thursday, the biggest percentage gain in four months.
Investors were wary as Greece showed no sign of reaching a deal with its creditors. Making matters worse, the International Monetary Fund decided to leave negotiations in Brussels because of major differences with Athens.
US dollar extends its retracement.
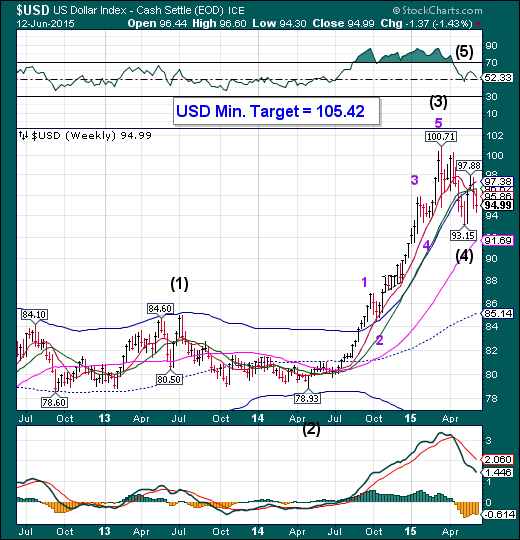
The US dollar extended the retracement of its recent gains. A brief period of weakness may extend through mid-week. The next probe higher is likely to break out above its high at 100.71. The next leg of the rally may last through the end of June, but may revive again later in July, after an expected Trading Cycle low
(Reuters) Speculators boosted bullish bets on the U.S. dollar for a third straight week, to their largest in six weeks, according to Reuters calculations and data from the Commodity Futures Trading Commission released on Friday.
The value of the dollar's net long position rose to $34.70 billion in the week ended June 9, from $34.15 billion the previous week. It was the second straight week net dollar longs came in above $30 billion.
To be long in a currency is to take a view it will rise,while being short is a bet its value will decline.
After a brief slide, the dollar has started to recover. For May, the dollar index was up 2.4 percent.
USB bounced from an expected Cycle low.
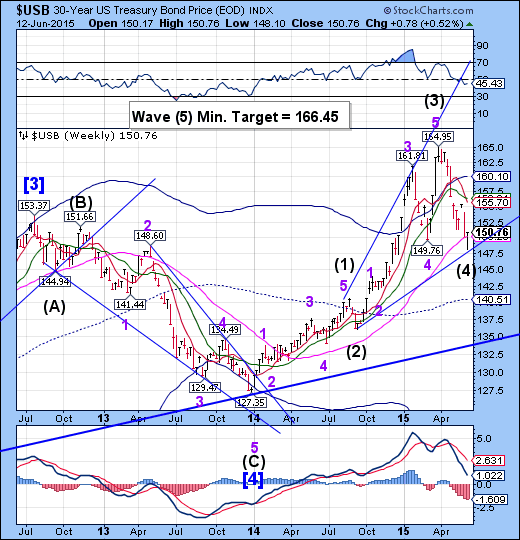
The Long Bond extended its Master Cycle low to Wednesday.The Cycles Model now suggests a period of strength that may propel USB higher through the end of June. The minimum target for this rally appears to be 166.45 later this Summer. USB may go higher in this Broadening Wedge formation, but is being challenged by a nearly 34-year-long overhead trendline near 166.00 (not shown).
(ZeroHedge) Yesterday, after the impressive 30 Year auction which as we explained performed as well as it did, due to a persistent short overhang resulting in a -0.35 bps repo rate, we noted something concerning: using SMRA data, we showed that benchmark 10Y has been trading negative in repo virtually all of 2015.
One day later, the shortage has gotten out of hand as following the Wednesday 10Y auction and ahead of its Monday settlement, there is not an On The Run cash bond to be found as all of them have been either removed from the repo market, or have been shorted.
Gold loses Cyclical support.
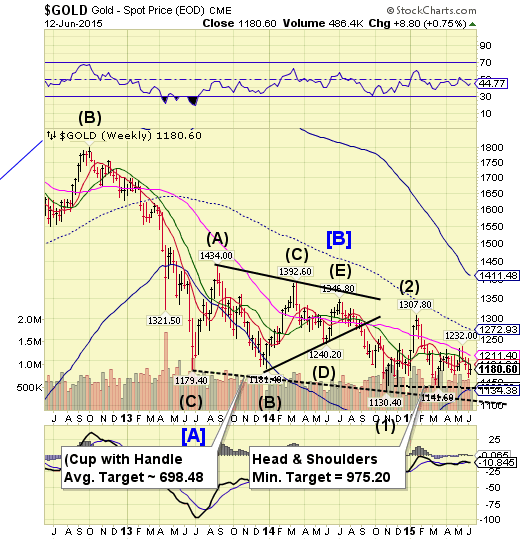
Gold traded beneath Intermediate-term support at 1191.39 and is due for a brief bout of extreme weakness that may extend for another two weeks.A probable decline beneath 1141.60 may develop, which may trigger the Head & Shoulders formation with a minimum target of 975.20. The Cycles Model now suggests a substantial low in late June.
(Bloomberg) The dollar is dominating the gold market.
With markets showing relative calm in the face of Greece’s debt crisis and equities near all-time highs, there’s little demand for the safety of haven assets like gold, giving changes in the dollar more sway. The metal has moved in the opposite direction as the Bloomberg Dollar Spot Index every day except one this month.
Both assets have been stuck in a trading range since April as the Federal Reserve plots when is the right time to start raising interest rates. The back-and-forth debate has kept gold and the dollar moving inversely as each U.S. economic report and Fed speech gets parsed for clues that may point to when rates will increase. Central bank policy makers start a two-day meeting on June 16.
Crude may make a final probe higher.
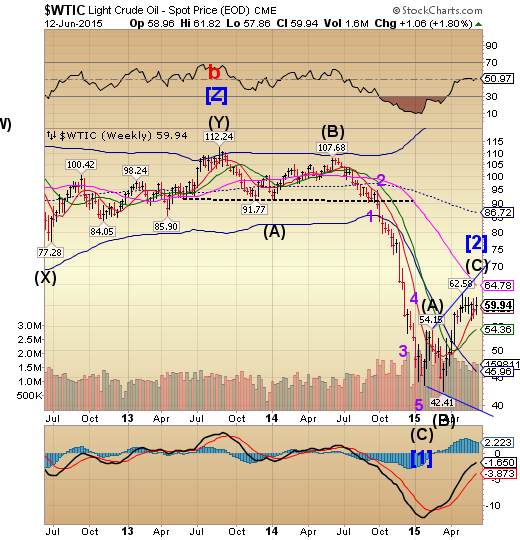
Crude appears to be capable of winding up its 6-week consolidation with a probe toward its weekly Long-term resistance at 64.78 next week in an inverted Trading Cycle high. Once accomplished, be prepared for a massive decline into mid-July once the supports are broken.
(BusinessInsider) US crude oil inventories continue to fall.
The latest data from the Energy Information Administration showed that inventories fell by 6.81 million barrels in the week ending June 5.
In the prior week, crude inventories fell by 1.9 million barrels.
Last week's decline brought the total to 470.6 million barrels, keeping inventories at the highest levels for this time of year in at least 80 years.
Shanghai Index may be winding up its final surge.
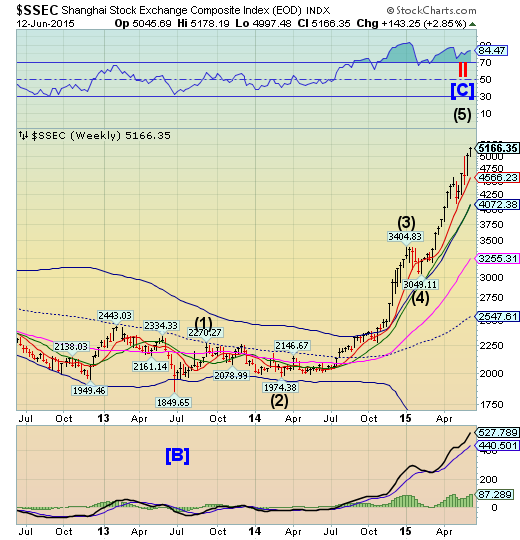
The Shanghai Index continues to make new highs, but with waning conviction.The Cycles Model suggests a probable reversal next week. It appears that this particular period of strength is almost over.
(ZeroHedge0Much has been said here about the relentless Chinese stock market bubble, where the Shanghai Composite closed just shy of fresh multi-year highs, and with a market cap of $10 trillion, or about 2.5x higher than where it was about one year ago, is well on its way to catching up to total US stock market capitalization; in volume terms, China has already surpassed the US.
A few days ago, we showed why the market in China is sucking in millions in new, inexperienced traders every week when we showed the case of one middle-aged rural Chinese "trader" who explained that "it's easier to make money from stocks than farm work."
In short: a bubble which is sucking in millions by the week, and which will end not only in tears but likely in riots and civil disobedience when the tens of millions of inexperienced traders, farmers, housewives, and unemployed lose everything once the bubble burst as it always does.
The Banking Index in a “throw-over” phase.
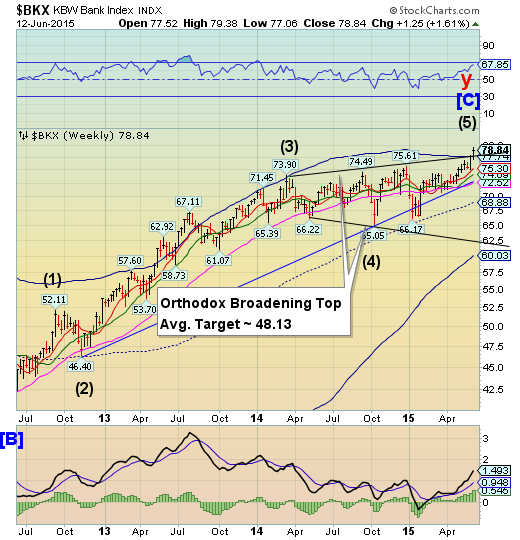
--BKX “threw over” its Cycle Top resistance and Megaphone trendline. This is usually the final phase of an Ending diagonal formation.This is an inverted Trading Cycle Top. The Cycles Model now implies that BKX may decline through the end of June
(BusinessInsider) Startups are chipping into every line of business big banks enjoyed leading up to the financial crisis.
The banks know it. A recent Goldman Sachs report suggested that $4.7 trillion of the financial-services industry’s business is jeopardized smaller competitors.
(ZeroHedge) Is Deutsche Bank (XETRA:DBKGn) The Next Lehman?
First, we must state the obvious: If Deutsche Bank is the next Lehman, we will not know until events are moving at an uncontrollable and accelerating speed. The nature of all fractional-reserve banks — who are by definition bankrupt at all times – is to project an aura of stability until that illusion has already begun to implode.
(ZeroHedge) One week ago we reported that, according to Greek sources, Greece had suffered a "massive" deposit outflow to the tune of €700 million just last Friday, culminating a week of €3.4 billion in total outflows following the acrimonious failure by the Greek government to reach a deal with the Troika.
This was confirmed by Wednesday's news that Greek banks had received another weekly boost in their ELA allotment, the biggest since February, amounting to €2.3 billion and bringing the total to a record €83 billion.
(ZeroHedge) The bank runs (and capital controls) begin. Macedonia Central Bank Governor Bogov states:
*GREEK BANKS IN MACEDONIA CAN’T WITHDRAW CASH: BOGOV
*MACEDONIAN BANKS PROTECTED IN CASE OF GREXIT: BOGOV
How long before the rest of Europe follows suit and a bank holiday is declared Monday to "Cyprus" depositors?
