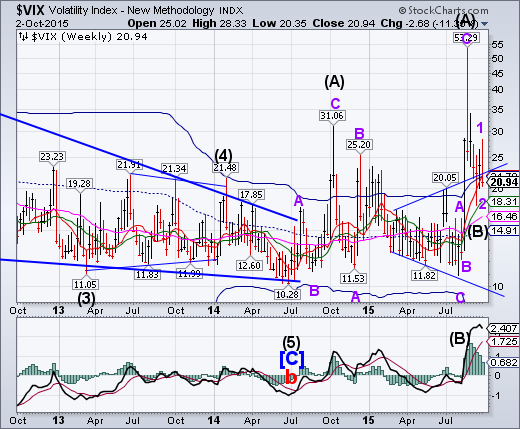
VIX pulled back beneath its weekly Short-term support/resistance at 22.02 after making a new monthly high, suggesting the next move may be positive.This week shows a dramatic non-commercial (retail) surge in bearish VIX ETFs being purchased.
The SPX bounced off a potential Head & Shoulders neckline.
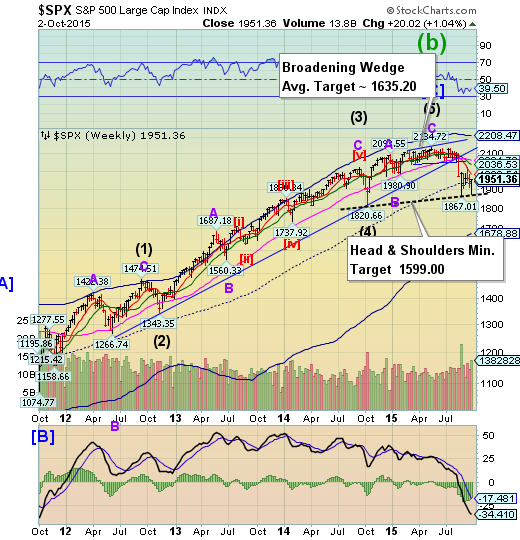
SPX bounced again from a potential Head & Shoulders neckline, closing aobve weekly mid-Cycle support/resistance at 1943.68. SPX remains vulnerable to a decline since no new highs were made and it remains beneath all Model resistance areas. The Cycles Model calls for a potential decline for the next 2 weeks or longer..
(WSJ) Stocks climbed, as a rally in the price of oil boosted the shares of energy and materials companies after a weak jobs report.
The gains pushed major stock indexes into positive territory for the week.
U.S. bond yields and stocks initially fell sharply after the weaker-than-expected September jobs report, which deepened concerns about how slowing global growth is affecting the U.S. economy and pushed back expectations of when the Federal Reserve will start to raise short-term interest rates.
NDX may be forming a right shoulder.
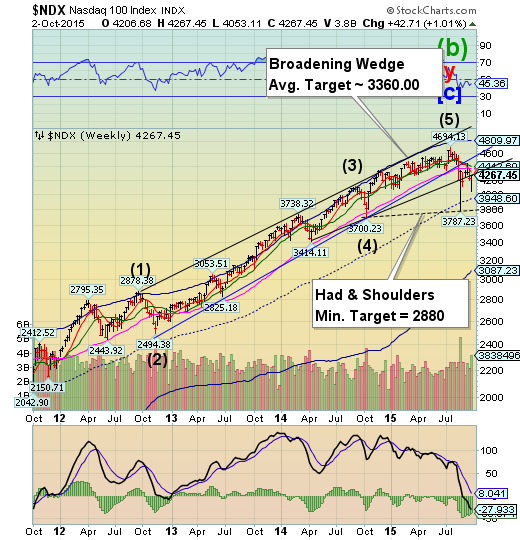
NDX dropped nearly to mid-Cycle support at 3948.60 before rebounding to the Broadening Wedge trendline.The right shoulder of a Head & Shoulders neckline appears to be under construction in NDX.
(Fortune) It’s about more than just the typical lag between public and private markets.
Biotech stocks spent the second half of September getting hammered, but it does not seem to be affecting prices or deal activity in the private markets. At least not yet.
On the public side, the carnage has been swift and deep. The S&P Biotech Select Industry Index lost nearly 25% between Sept. 17 and this past Tuesday. The NASDAQ Biotech index fell more than 20% over the same period. Both drops may be ultimately due to an overbought market, but they were triggered by the political backlash — namely from Hillary Clinton — to a small drugmaker named Turing Pharmaceuticals boosting the price of a toxoplasmosis treatment by more than 5,000%.
High Yield Bonds are saved from a retest of the Cycle Bottom.
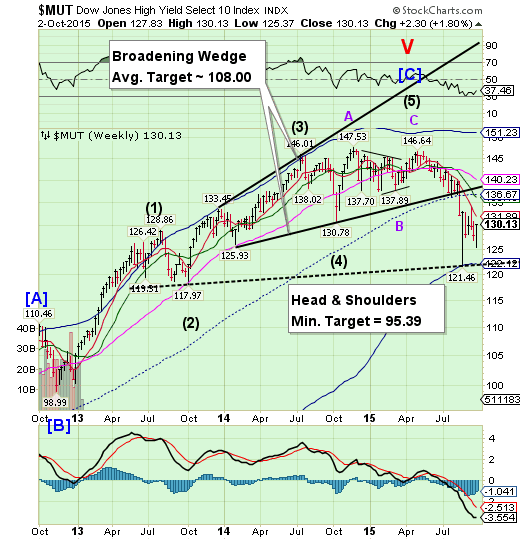
The High Yield Index appeared on its way to retest the weekly Cycle Bottom at 122.12 but got caught up in some quarterly window dressing. This does not change the bearish view for High Yield bonds. The Cycle Bottom/Head & Shoulders neckline may be challenged again. The Cycles Model suggests a substantial decline in HY over the next two weeks or more.
(ZeroHedge) It appears the post-PIMCO-effect is not wearing off. Having had a weekend to soak up the reality of what outflows will mean for Gross' old shop, credit markets are once again flashing bright red this morning as managers reach for protection ahead of expected redemptions which would force selling into an illiquid market. High-yield spreads are 25bps wider at their highest since early Oct 2013. Equity futures are legging lower with the weakness.
The euro continues to be repelled by Long-term resistance.
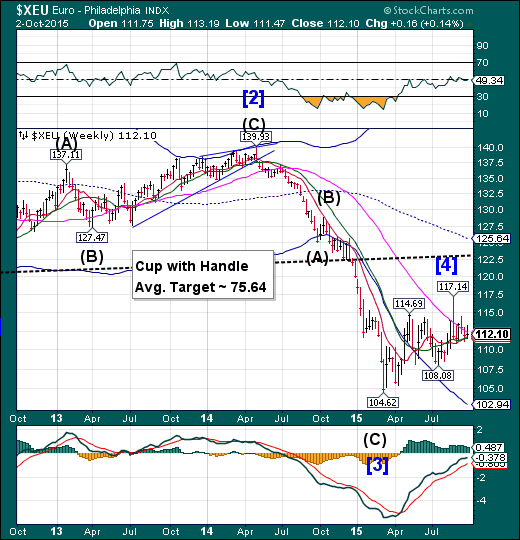
The euro continues to be repelled by Long-term resistance at 112.30, but Intermediate-term support at 111.57 held for another week, narrowing the consolidation. It is probable that the euro trend toward parity with the USD may be resuming shortly, as the next technical support lies at 102.94.
EuroStoxx bounces at the Broadening Wedge trendline.
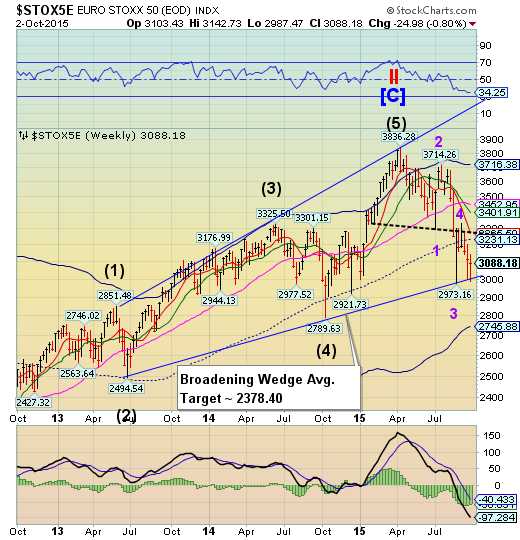
EuroStoxx 50 bounced at its Broadening Wedge trendline just under 3000.00 this week, but did nothing to change the bearish view. Crossing the trendline may cause a panic decline that may end beneath the October 2014 low.
(MarketWatch) European stock markets on Friday snapped back after firm losses fueled by a disappointing U.S. jobs report.
Investors turned their attention to the potential benefits of a weak labor market in the world’s largest economy, helping reignite buying appetite.
Tony Cross, market analyst at Trustnet Direct, said in a note that this cloud has a silver lining, as the lackluster U.S. data probably pushes a interest-rate hike by the Federal Reserve into 2016.
“The short term interpretation here is that this is good news for equities,” he said.
The yen may be emerging from its trading range.
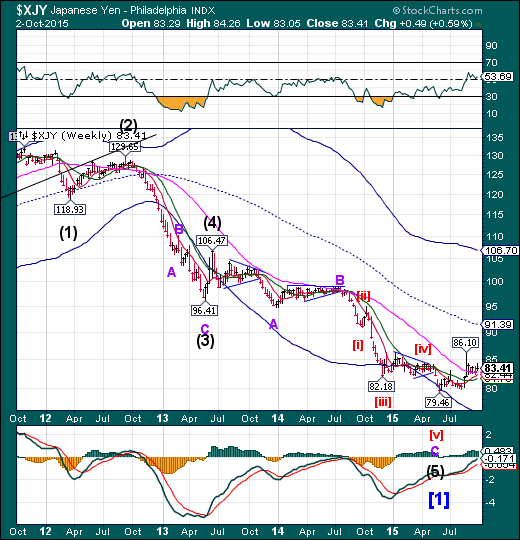
The yen emerged above its Long-term support at 82.77, appearing jolted by the weak US jobs picture. It may emerge to challenge its weekly Cycle Top at 106.70 by mid-October. Another breakout above 86.10 may confirm the actionable signals, as a rally in the yen is evidence of an unwinding of the yen carry trade that may be underway due to falling equities.
The Nikkei bounces from mid-Cycle support.
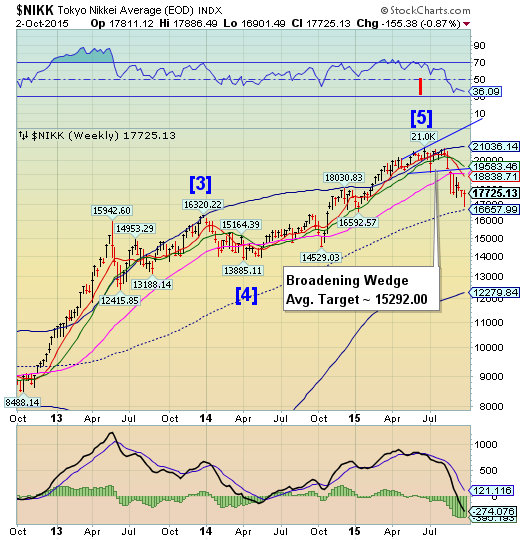
The Nikkei bounced from mid-Cycle support when it may have made a Master Cycle low on Tuesday. The low was expected. The leading question is whether the Nikkei will continue to rally for a few weeks, or possibly make a further decline..
(Reuters) Japanese stocks remained basically flat amid profit-taking and re-allocation during choppy trade on Friday morning as investors looked ahead to a key U.S. jobs report.
The Nikkei share average edged up 0.02 percent to 17,725.98 during the morning session.
Japan's retail sector outperformed after fresh data showed Japan's household spending rose in August for the first time in three months and that job availability improved to its best in more than two decades.
Market players said the tight labour market and increased household spending could ease recent fears of a recession.
U.S. dollar still range bound.
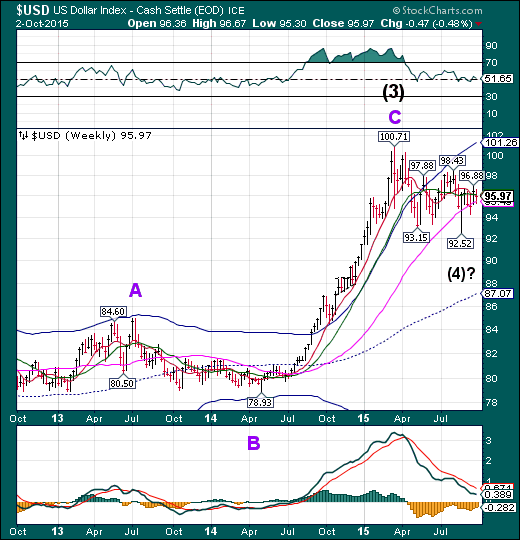
The US dollar declined to its weekly Long-term support at 95.49, but came back to close under Intermediate term support at 96.16. The Cycle Model suggests new lows may be possible through mid-October.
(WSJ) The dollar fell on Friday after a weak U.S. jobs report for September dented expectations that the Federal Reserve will raise interest rates from near zero this year.
The dollar pared losses against the euro, falling 0.2%, as the common currency bought $1.1216. The Wall Street Journal Dollar Index, which compares the greenback against a basket of 16 widely traded currencies, fell 0.3% to 88.53.
Disappointing numbers for job growth, prior-month revisions, earnings and labor participation fed into fears that the global growth slowdown has spread to the U.S. and darkened prospects for any near-term resumption in the dollar’s rally. The numbers sent the dollar plummeting as much as 1% against the euro and the yen before traders and investors booked profits on the move, allowing the greenback to recover somewhat.
USB rose above its consolidation range.
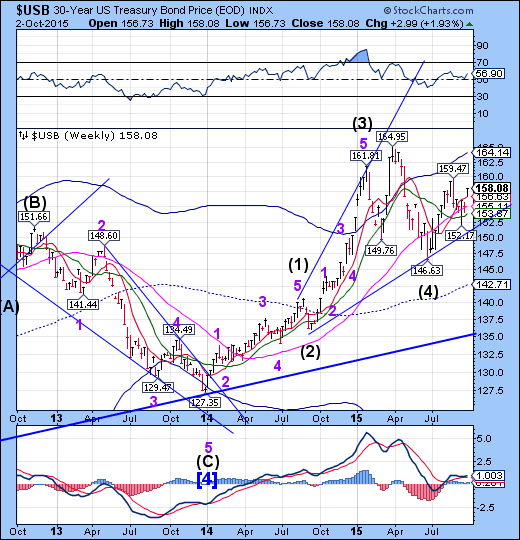
The Long Bond broke above its consolidation range. USB may be in a rally mode through mid-October, taking aim for its Cycle top at 164.14 and possibly new highs. There appears to be exceptional strength emerging over the next week.
(WSJ) The 10-year Treasury yield fell below 2% after a lackluster jobs report, signaling the bond market’s skepticism that the Federal Reserve will lift rates this year.
September’s weak jobs data and surprise decline in wages heightened concerns that slowing growth around the world is hurting the outlook for the U.S. economy. That, in turn, is reinforcing the Treasury market’s skepticism that inflation and growth are on a strong enough trajectory for the Fed to raise short-term interest rates at either its October or December meeting.
Gold bounces again from its Cycle Bottom support.
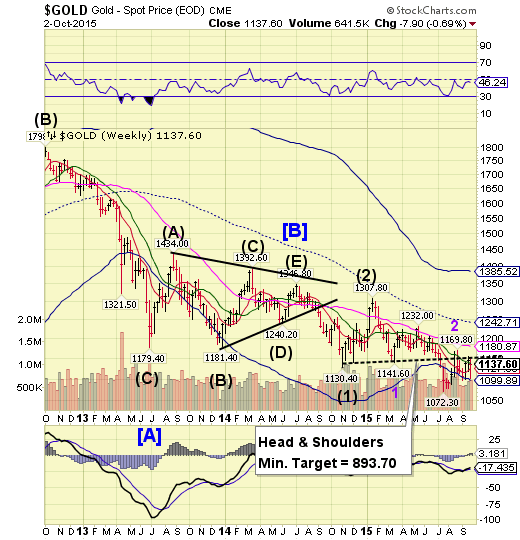
Gold bounced again from its Cycle Bottom support at 1099.89 in a retracement of its previous high. The Cycles Model suggests a decline that may take the next two weeks or longer. The next immediate target for gold may be new lows beneath 1072.30.
(WSJ) Gold prices jumped on Friday after U.S. employment data came in far lower than expected, signaling continued sluggish economic growth and easing expectations of an interest-rate increase this year but adding up to a bullish backdrop for safe-haven assets like precious metals.
Gold prices were down nearly 1% earlier in Friday’s trading session, but reversed losses after the release of the data. The most-actively traded December contract settled up 2.1% at $1,136.60 a troy ounce on the Comex division of the New York Mercantile Exchange.
Crude may have a false break this week.
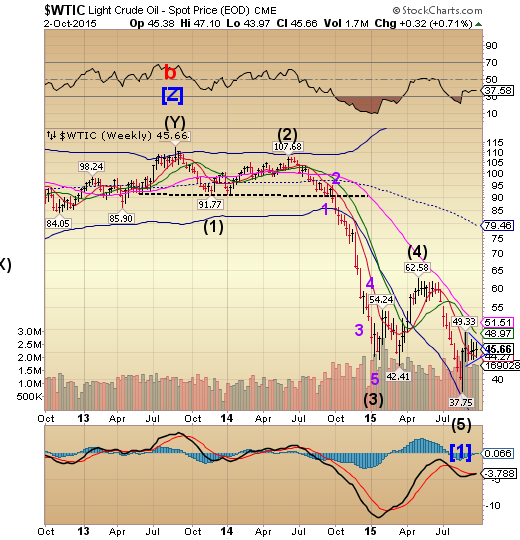
Crude appears to be completing a Triangle formation that will often give a false break before returning to the trend prior to the formation. The Cycles Model suggests a Master Cycle low may be due this week. Afterwards comes a resumption of the rally that may meet or exceed the 55.00 target. However, the decline may then extend through mid-October, which may reduce the probability of reaching its target
(CNBC) Crude prices erased early losses to rise nearly 2 percent on Friday after a report showing the fifth weekly decline in the U.S. oil rig count renewed the debate over falling production in the world's top oil consumer.
Softer-than-expected U.S. jobs data and other economic statistics had weighed on oil earlier, along with reduced threats to oil installations in the U.S. East Coast from Hurricane Joaquin.
U.S. energy companies this week cut the number of rigs drilling for oil by 26, a weekly survey by oil services company Baker Hughes (NYSE:BHI) showed. It was the largest number of rigs idled in a week since April.
Shanghai Index declines again toward 3000.
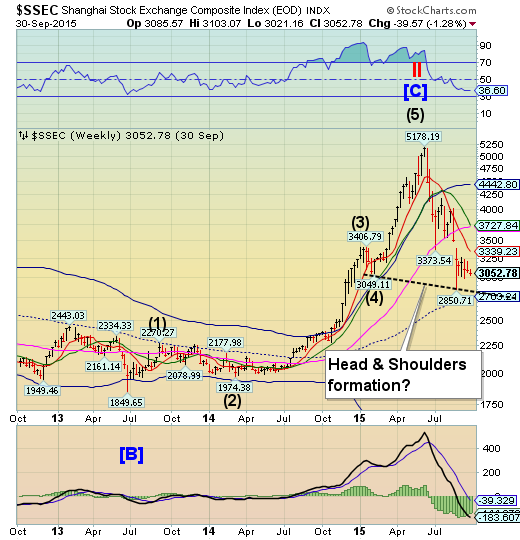
The Shanghai Index may have completed its consolidation and appears to be heading for a challenge of 3000.00 again. The massive intervention from the PBOC may not be enough to stave off a potentially massive decline. There may be a new Head & Shoulders formation suggesting a target beneath 1000.00. The Shanghai Index faces a double “Death Cross” where both Short and Intermediate-term support/resistance lines cross beneath weekly Long-term support/resistance.
(Mises) Last year, the world was stunned by an IMF report which found the Chinese economy larger and more productive than that of the United States, both in terms of raw GDP and purchasing power parity (PPP). The Chinese people created more goods and had more purchasing power with which to obtain them — a classic sign of prosperity. At the same time, the Shanghai Stock Exchange Composite more than doubled in value since October of 2014. This explosion in growth was accompanied by a post-recession construction boom that rivals anything the world has ever seen. In fact, in the three years from 2011 – 2013, the Chinese economy consumed more cement than the United States had in the entire twentieth century. Across the political spectrum, the narrative for the last fifteen years has been that of a rising Chinese hyperpower to rival American economic and cultural influence around the globe. China’s state-led “red capitalism” was a model to be admired and even emulated.
The Banking Index closes beneath mid-Cycle support.
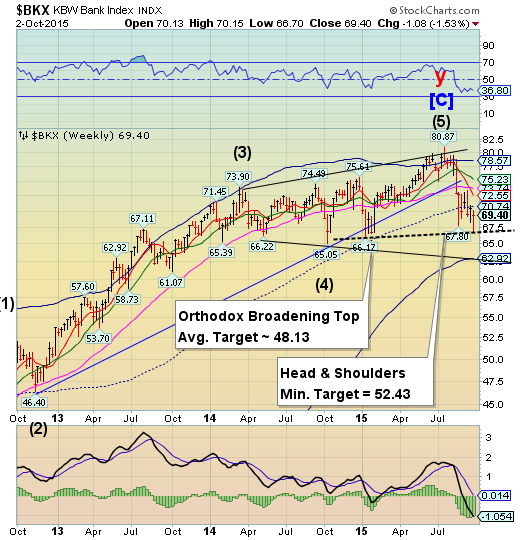
BKX may have made a new Master Cycle low on Friday. But it has a probability of extending until it meets its Cycle Bottom at 62.92. It may first test weekly mid-Cycle resistance at 70.74. If that effort fails, it may resume a retest of the lows next week. There is a potential new Head & Shoulders formation with a similar target as the Broadening Top.
(ZeroHedge) Late last year, the Bank of England followed in the venerable footsteps of virtually every sellside firm on the planet when it moved to dismiss its chief currency dealer Martin Mallett. Through his participation in central bank meetings with traders Mallet, who had worked at the bank for three decades, was aware of the possibility that the world’s largest banks were conspiring to manipulate the $5 trillion a day FX market but apparently failed to take the proper steps to escalate those concerns. The dismissal was of course accompanied by a cacophony of nonsense from the BOE.
But back to the Bank of England, which it turns out, lied about its involvement in FX rigging. According to Bloomberg, alongside the FX settlement announcement, the Bank of England fired its chief currency dealer - the abovementioned Martin Mallett - a day before he was faulted in an independent investigation for failing to alert his superiors that traders were sharing information about client orders.
(WSJ) A specter is haunting bank stocks: that interest rates remain stubbornly low while expectations for bank earnings remain too high.
The just-completed third quarter saw a continuation of the all-too-familiar headwinds that have held banks back. This will put even more pressure on banks to grow earnings by cutting costs further—which could risk cannibalizing future earnings.
The quarter’s tailwinds include the Federal Reserve’s decision not to raise rates in September and a flattening of the yield curve. This is likely to put further pressure on net-interest margins.
(ZeroHedge) Back in June, we noted that a group of investors which included hedge funds, pension funds, university endowments, and others were looking to push forward with a lawsuit that alleged Wall Street had conspired to limit competition in the CDS market.
Of course, the whole case was based on what amounts to tautological reasoning.
That is, everyone knows that Markit effectively monopolized the CDS market and because Markit was owned by Wall Street, it was self evident that big banks both monopolized and manipulated the market.
