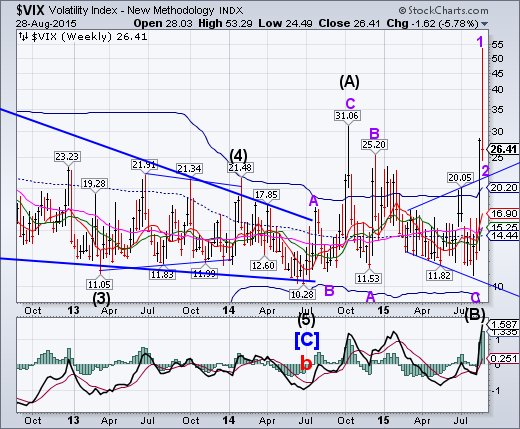
VIX rocketed to 53 on Monday morning, followed by a pullback to its Megaphone formation. While there was a huge push-down in VIX, the VIX ETFs had their shorts squeezed. An interesting dichotomy.
The SPX epic decline is rolled back.
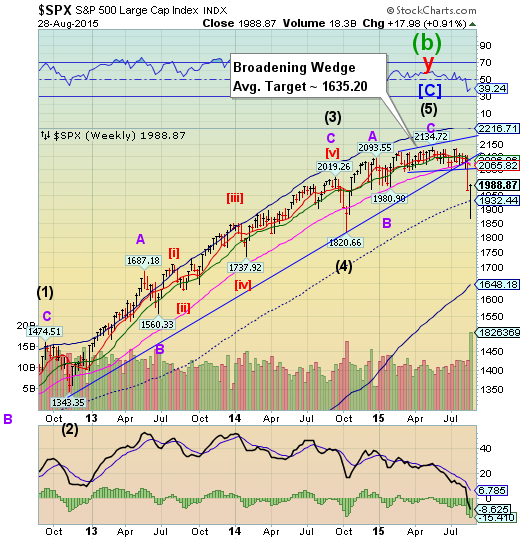
Monday’s epic decline in SPX was rolled back by a 50% retracement back into green in the days that followed. The volume bar in the chart is misleading, since the highest volume occurred on the down days. The rally was done on thin volume with the help of HFT computer programs that could trade the same shares multiple times over while investors were leaving the market.
(ZeroHedge) …given how predisposed household investors are to mistrust Wall Street in the post-crisis, post-Flash Boys world, retail outflows during uncertain times (like those that began last month when China’s stock market collapse began to make national news) shouldn’t come as a surprise, but as Credit Suisse (SIX:CSGN) notes, something happened in July and August that hasn’t happened since Q4 of 2008: retail investors pulled money from both stocks and bond funds.
In other words, mom and pop were selling everything.
NDX bounces back to its 3-year trendline.
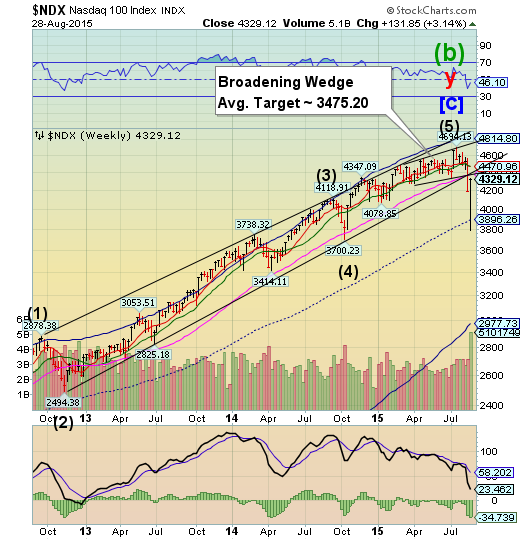
Monday’s epic decline in the NDX was also retraced on thin volume, but going further back to its Ending Diagonal trendline. NDX has no technical supports at this point, so the next decline may easily go to or beyond its Cycle Bottom at 2977.73.
(ZeroHedge) If anyone was curious why the Fear and Greed index is at 13 (up from 5) despite the biggest 2-day surge in the Dow Jones ever, the answer is very simple: nobody believes the "broken market" any more, as confirmed by the biggest weekly equity outflow on record.
The full details courtesy of Bank of America (NYSE:BAC):
Record Equity Outflows: weekly flows show $29.5bn outflows from equity funds (largest outflows on record – data since 2002)
High Yield Bonds Bounce off the Cycle Bottom, spreads widen.
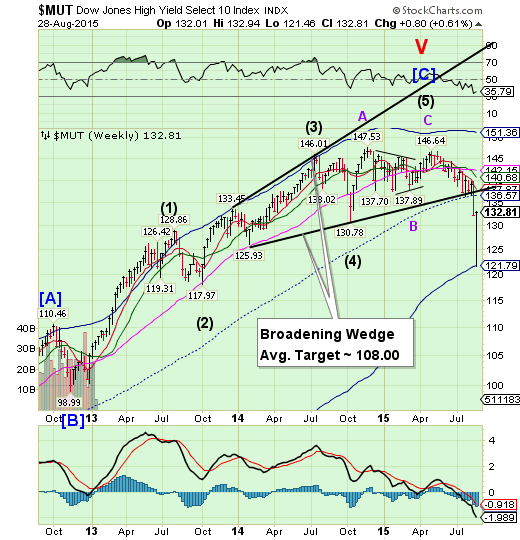
The High Yield plummeted to its weekly Cycle Bottom at 121.79 on Monday, then proceeded to take back the losses with a 64% retracement of the most recent 4-day decline. However, there appear to be more declines ahead. The index shows a loss for 2015, but at the low, showed losses back to 2013. There is a good probability of MUT being in double digits should it exceed Monday’s low.
(MarketRealist) For assessing the movement of high-yield bond yields, we’ll use the BofA Merrill Lynch U.S. High Yield Master II Effective Yield. The above graph shows that yields according to this measure have nearly uniformly risen, especially since February 2015. At their present level, they’ve even crossed the previous peak on December 16, 2014. On August 21, 2015, yields by this measure stood at 7.38%, the highest since June 30, 2012.
The euro extended its rally.
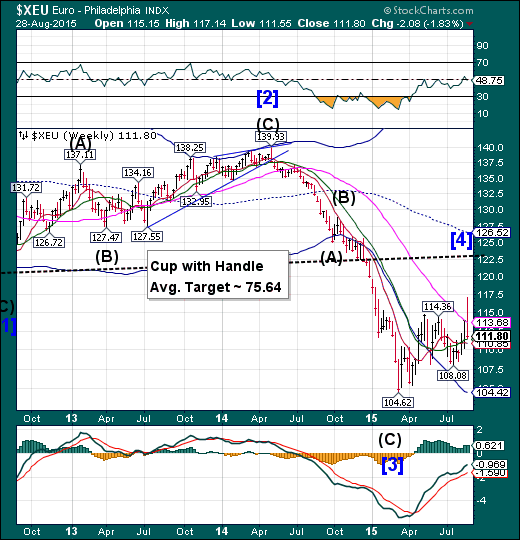
The euro extended its rally above Long-term resistance on Monday, but closed the week back beneath it. The surge in the euro was primarily due to the demand for the local currency as European stocks were sold. There is the potential that the euro may go higher in the next week.
(Bloomberg) Euro-area economic confidence unexpectedly rose in August, defying a slowdown in China and renewed political uncertainty in Greece.
An index of executive and consumer confidence increased to 104.2 in August from 104 in July, the European Commission said Friday. Economists predicted a decline to 103.8, according to the median estimate in a Bloomberg survey.
The report follows a roller-coaster week for global markets on concerns China’s slowdown is deepening. While Chinese authorities have taken steps to stimulate the world’s second-largest economy, cutting interest rates five times in 10 months and devaluing the yuan, questions remain over whether it’s heading for a hard landing after decades of surging growth.
EuroStoxx loses, then regains support line.
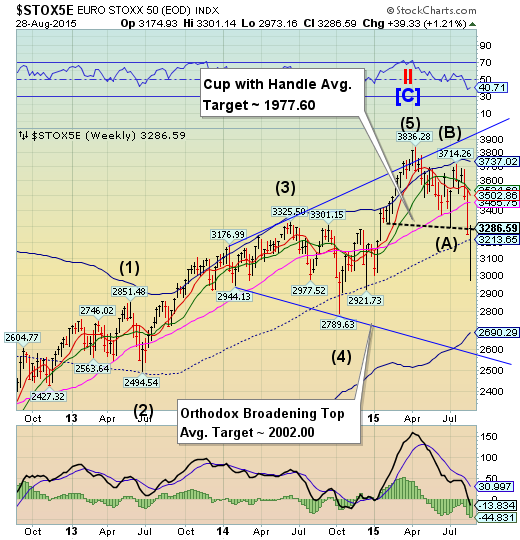
EuroStoxx 50 fell beneath the lip of its Cup with Handle formation, but rallied back to that resistance level. The Cycles Model suggests another possible week in a panic decline.
(Bloomberg) After wild swings over the past few days, European stocks ended up posting their first weekly gain since China devalued its currency.
The Stoxx Europe 600 Index rose 0.3 percent at the close of trading, adding most of those gains in the final settlement period. An advance of 0.3 percent in the first few minutes of trading gave way to losses of as much as 1 percent as the session progressed, before the gauge moved higher.
The stocks index had daily moves of 1.7 percent or more in the past seven days as China’s currency devaluation rattled markets. Despite the volatility, the Stoxx 600 ended the week 0.6 percent higher.
The yen surges off its bottom.
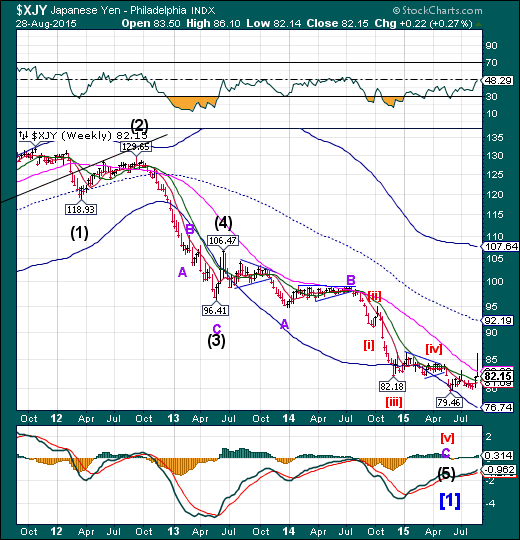
The Yen surged above Long-term support/resistance at 82.96, but did not close above that level. However, it may emerge to challenge its Cycle Top at 107.01 through the balance of August and September. A breakout above its prior high at 83.05 has occurred, giving actionable signals, as a rally in the yen is evidence of an unwind of the yen carry trade may be underway due to falling equities.
(SydneyMorningHerald) Asia yen bears say the currency's latest bout of strength has only made future declines all the more certain by heightening speculation that the Bank of Japan will increase monetary stimulus.
Westpac (NYSE:WBK) sold the yen on Tuesday after a global rush into haven assets propelled the currency to its strongest level since January. Commonwealth Bank Of Australia (ASX:CBA) and Standard Chartered (LONDON:STAN) say the BOJ will expand an unprecedented stimulus program as soon as October, while the median of forecasts tracked by Bloomberg sees the yen weakening about 5 per cent to 127 a dollar by March.
The Nikkei triggers its Broadening Wedge.
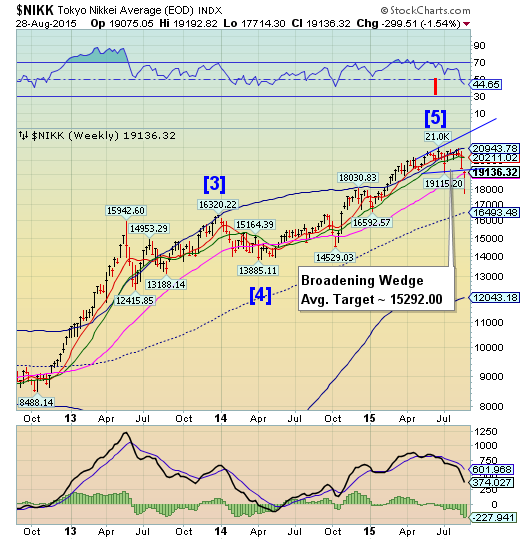
The Nikkei has triggered its Broadening Wedge formation and closed the week beneath it. A severe decline lasting up to a week may ensue as critical support may have been lost.
(TheJapanNews) Stocks surged on the Tokyo Stock Exchange Friday following overnight rises in European and U.S. markets, sending the benchmark Nikkei average to its first finish above 19,000 since Aug. 21.
The 225-issue Nikkei average jumped 561.88 points, or 3.03 percent, to end at 19,136.32. On Thursday, the key market gauge gained 197.61 points.
The TOPIX index of all First-Section issues closed up 49.39 points, or 3.29 percent, at 1,549.80, after advancing 21.44 points the previous day.
Tokyo stocks attracted hefty buying from the outset of Friday’s trading after major European and U.S. equities soared on Thursday. The key Shanghai index’s rise above the 3,000 line also helped brighten investor sentiment, brokers said.
U.S. dollar declines, then regains Model supports.
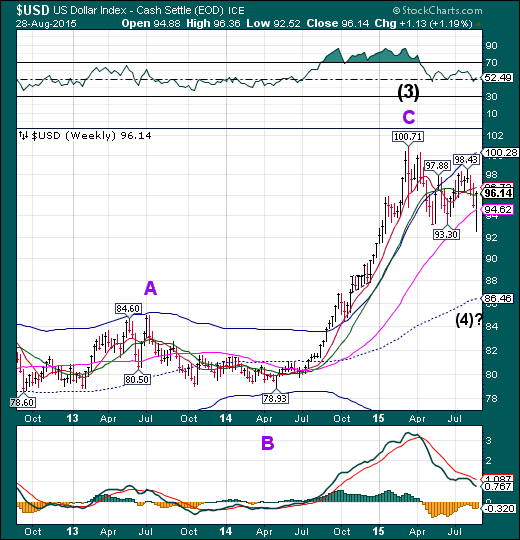
The US dollar fell through Long-term support at 94.62, which may precipitate a further decline as far as weekly mid-Cycle support at 86.46. The Cycle Model then suggests the rally may emerge late next week, pushing the USD higher through mid-September.
(Reuters) Speculators pared back bullish bets on the U.S. dollar in the latest week to their smallest in more than two months, according to Reuters calculations and data from the Commodity Futures Trading Commission released on Friday.
The value of the dollar's net long position fell to $23.99 billion in the week ended Aug. 25, from $32.26 billion the previous week. This was the first time in four weeks that net dollar longs came in below $30 billion.
To be long a currency is to make a bet it will rise, while being short is a bet its value will decline.
USB turns down.
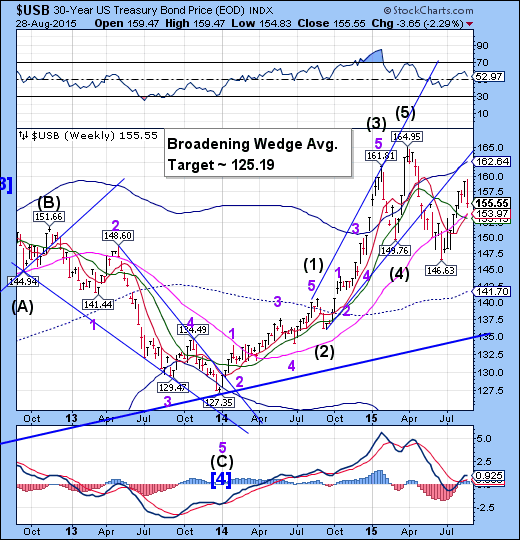
The Long Bond reversed down on selling pressure from China. Selling pressure may intensify next week as the Chinese government scrambles for liquidity. This may overpower other investors seeking a haven as markets continue to turmoil..
(WSJ) U.S. Treasury bonds pulled back on Friday, capping the biggest weekly price loss in two months, as comments from a top Federal Reserve official raised anxiety that the central bank could raise interest rates next month.
Fed Vice Chairman Stanley Fischer said Friday the case for a rate increase in September was “pretty strong” and that he could see markets settling down before the central bank’s Sept. 16-17 policy meeting. Mr. Fischer cautioned that whether the central bank would act depended on upcoming data. He was speaking on the sidelines of the central bank’s annual conference in Jackson Hole, Wyo.
Gold falls back below the neckline.
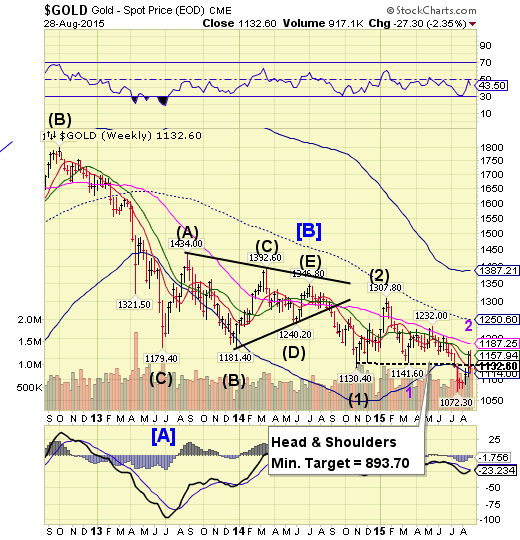
Gold fell back through its Head and Shoulders neckline, leaving the Head and Shoulders as a valid formation (3% rule). The downtrend may now resume for possibly another week, with greater intensity. Counter-trend bounces, known as dead cat bounces, can be rather sharp, but not long lasting. The next immediate target for the rally may be new lows beneath 1072.30.
(TheGuardian) A deathbed confession may have revealed the location of a Nazi train rumoured to have been carrying gold, which has been missing in Poland since the second world war.
Poland’s deputy culture minister, Piotr Zuchowski, said ground-penetrating radar had found images of a buried train near Wałbrzych, in the country’s south-west, on a 4km stretch of railway near the Wrocław-Wałbrzych line.
Calling it an exceptional find, Zuchowski said the fact that the train appeared to be armoured indicated that it might be carrying valuable cargo. A deathbed confession from an unnamed man had led officials to the site, he added. Zuchowski said the dying man was involved in the operation to hide the train 70 years ago. “I am more than 99% certain that this train exists,” he told a press conference on Friday.
Crude bounces.
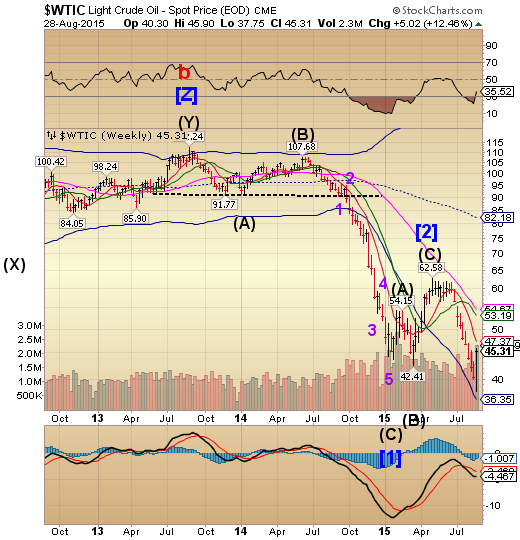
Crude appears to have hit its Cycle low on Monday, August 24. The bounce to Short-term resistance was made on heavy volume. This is a counter-trend bounce that may last another week or two with extreme volatility. However, the larger decline isn’t over.
(Reuters) Oil rocketed more than 10 percent higher on Thursday, posting its biggest one-day rally in over six years as recovering equity markets and news of diminished crude supplies set off a short-covering scramble by bearish traders.
Snapping back from a deep two-month slump that knocked U.S. crude to 6-1/2 year lows below $40 this week, oil climbed as world stock markets rose on hopes Chinese government measures to stimulate the economy would pay off, while the dollar strengthened as risk aversion eased.
Shanghai Index plunges.
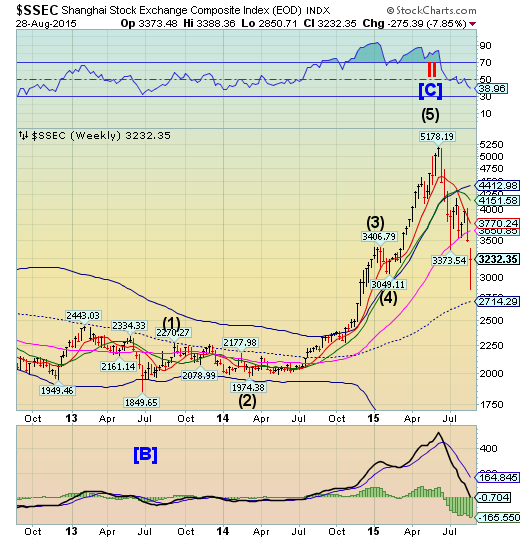
The Shanghai Index plunged nearly 19% this by Wednesday to its low with only a partial recovery by the end of the week. The panic decline may continue for another week or so. The technical landscape suggests that the attempt to “fill the gap” at 3500.00 may not succeed before the decline resumes.
(ZeroHedge) On Tuesday evening, we asked what would happen if emerging markets joined China in dumping US Treasuries. For months, we’ve documented the PBoC’s liquidation of its vast stack of US paper. Back in July for instance, we noted that China had dumped a record $143 billion in US Treasuries in three months via Belgium, leaving Goldman speechless for once.
We followed all of this up this week by noting that thanks to the new FX regime (which, in theory anyway, should have required less intervention), China has likely sold somewhere on the order of $100 billion in US Treasuries in the past two weeks alone in open FX ops to steady the yuan. Put simply, as part of China's devaluation and subsequent attempts to contain said devaluation, China has been purging an epic amount of Treasuries.
The Banking Index takes the plunge.
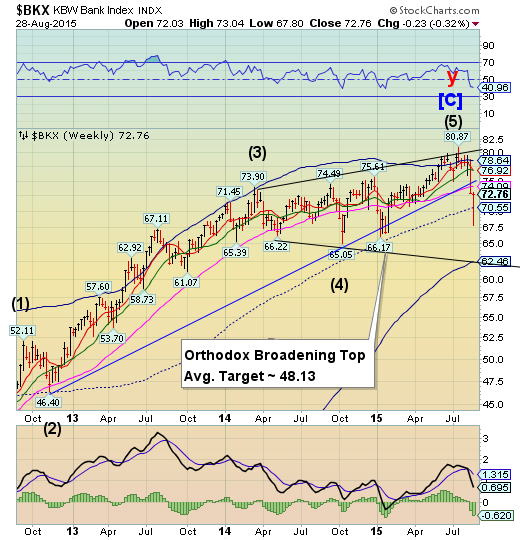
BKX plunged 7% by Wednesday before bouncing back to nearly break-even. The gap left from Monday’s decline was filled. The Cycles Model suggests that the decline may intensify very quickly next week for a possible drop to or beneath the Weekly Cycle Bottom at 62.46 before another bounce.
(WSJ) China’s biggest lenders are scrambling to clear rising bad loans from their books, as a faltering economy weighs on loan repayments and sets banks on pace for their worst year since they began listing shares 13 years ago.
The pace of profit growth at major lenders from January to June dropped sharply from the first quarter. The sagging performance adds to larger concerns about China’s weakening economy that wreaked turmoil across global markets this week, wiping at least $1 trillion off China’s stock market and sending the Dow Jones Industrial Average to an 18-month low.
(WSJ) The market crash in China and weakness across Asia is providing a short-term boost to bank revenues, but the picture for several Wall Street businesses is grimmer in the longer term.
Facing a slowing China and a stock market where seesawing moves have rattled global markets, investment banks operating in the region are likely to find that everything from underwriting shares to trading is crimped in coming quarters.
The bleak outlook marks a turnaround for banks in Asia, which chalked up record first-half revenues in some investment-banking businesses. They had trading gains from the inauguration last November of a program that allowed foreigners to trade Shanghai shares through Hong Kong, as Chinese stocks rocketed higher.
(WSJ) On the whole, foreign central banks increased their holdings of U.S. government debt over the past week, even as the biggest foreign owner of Treasury securities, China, shed some of its holdings.
The value of Treasury debt owned by foreign central banks via the Fed’s custody account rose by $5.6 billion to $3.018 trillion for the week ending Wednesday, according to the Fed’s weekly release Thursday afternoon. However, the holdings fell by $4.9 billion on a weekly average, according to Nancy VandenHouten, senior research analyst at Stone & McCarthy Research Associates who monitors the flows.
