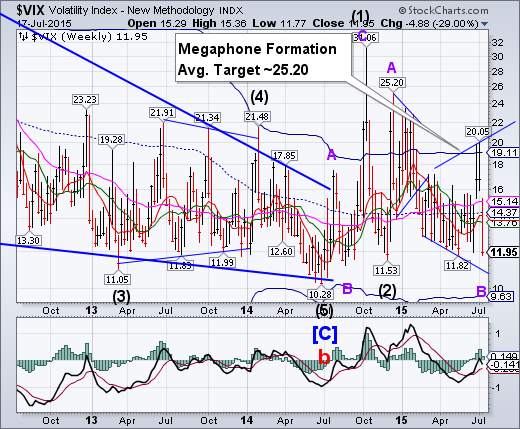
After breaking out above Cycle Top resistance, VIX dropped to the bottom of its trading range, making a new low in a supernormal collapse. This is referred to as a Broadening Bottom or Megaphone formation, which is a reversal pattern. Its average target matches that of the Wave A top in mid-December
SPX bounces from Long-term support.
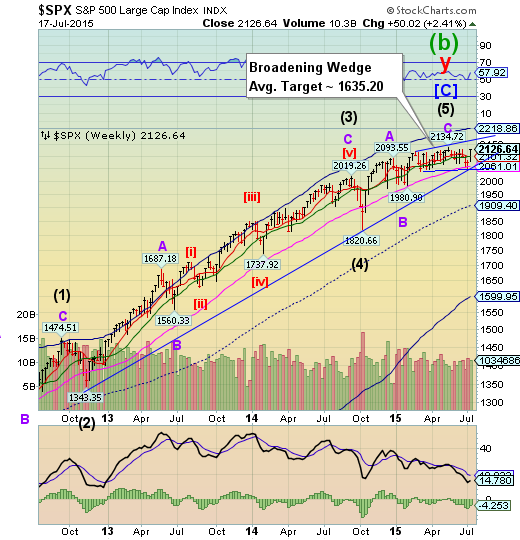
The SPX rally fell short of its all-time high this week. The Cycles Model suggests that Monday may be the next Pivot, but is unable to tell us at what level the reversal might come in. SPX may conclude its rally at 2140.00-2150.00 or crumble at the open on Monday. The inability to make a new high on Monday would be extremely bearish
(CNBC) Investors in U.S. equities should expect higher volatility and slow grind higher in the back half of the year, strategist Jeff Kleintop said Friday.
"Economic momentum in the U.S. has not been improving as we've seen in Europe and that means, I think, a bumpy ride as we look to the second half, coupled with the potential for rising interest rates from the Fed," the chief global investment strategist for Charles Schwab (NYSE:SCHW) said in an interview with CNBC's "Power Lunch."
Federal Reserve chair Janet Yellen has indicated the central banks first rate hike will probably come before the end of the year.
NDX makes a new high on Google (NASDAQ:GOOGL) performance.
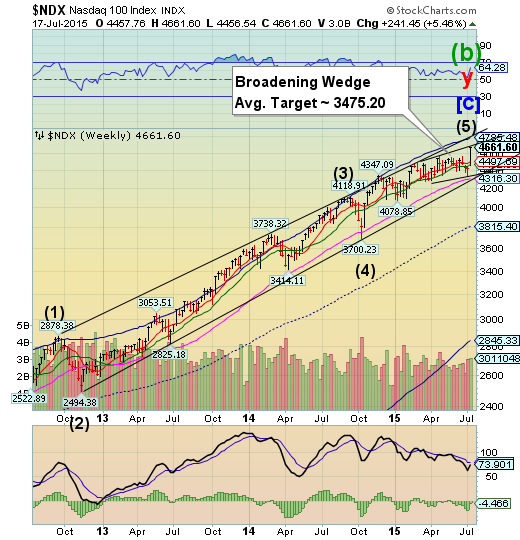
NDX made a new high after bouncing from Long-term support, which is unusual, in one week’s time. At the same time, it appears to have concluded a Broadening Top formation, which is a reversal pattern. NDX is the investment of choice for retail investors and hedge funds. This week’s move tells us that the bulk of retail investors are still very sanguine about risk.
(ZeroHedge) Google's result were good (even if the top-line revenue missed), but what investors were looking for, and what had pressured GOOG's stock price for the past year, was concern that runaway hiring and spending were eating away at the bottom line. And that is precisely what Ruth Porat, who was poached from Morgan Stanley (NYSE:MS) in March, decided to give to investors when she said just two words on the call: "expense management."
What happened next is the single biggest surge in GOOG market cap in history: at last check the stock was up 14% on the day, equivalent to about $55 billion increase in market cap in just one day.
Putting this in perspective, just today, the value of Google has increased by more than the market cap of 415 S&P 500 companies!
High Yield Bonds bounce to resistance.
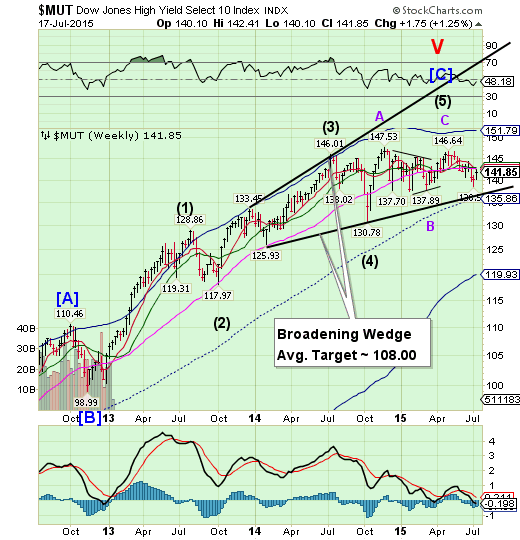
The High Yield Index bounced back to Long-term resistance at 142.57 this week. The inability to overcome resistance may turn into a decline to the lower trendline of its Broadening Wedge formation. It appears that the Master Cycle low was made last week, suggesting that a failure to overcome overhead resistance (a bounce) may result in a very serious decline straight ahead. The financing of stock buybacks is being seriously threatened.
(Bloomberg) Carl Icahn criticized asset management firms such as BlackRock Inc. (NYSE:BLK) for selling exchange traded funds that give an illusion of liquidity for “extremely illiquid, and extremely overpriced” securities such as high yield bonds.
The billionaire investor, who has said in the past that he’s betting against the high-yield market, told BlackRock Chief Executive Officer Laurence D. Fink at the CNBC Institutional Investor Delivering Alpha Conference that such instruments are “extremely dangerous.” Fink disputed the characterization.
“This thing is going to go over this cliff and you know what’s going to destroy it? They’re going to hit a black rock,” Icahn said at the conference Wednesday in New York.
The euro is declining toward its Cycle Bottom.
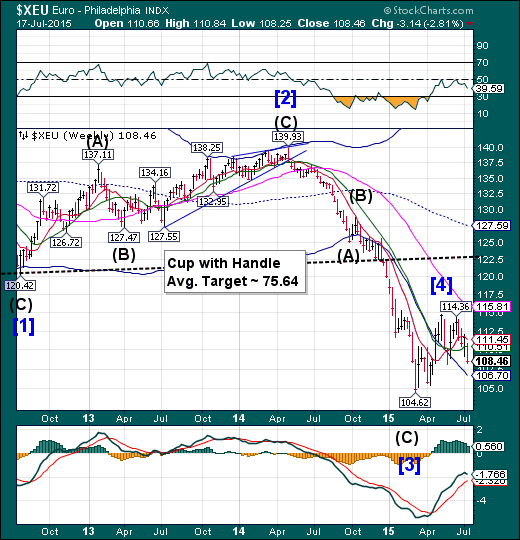
The euro fell from Intermediate-term support at 110.51 this week. We may see another week of decline before the next bounce. A likely target may be weekly Cycle Bottom support at 106.70.
(Bloomberg) The latest round of wrangling between Greece and its European creditors has demonstrated yet again that countries with such disparate economies should never have entered a currency union. It would be better for all involved, though, if Germany, rather than Greece, were the first to exit.
After months of grueling negotiations, recriminations and reversals, it's hard to see any winners. The deal Greece reached with its creditors — if it lasts — pursues the same economic strategy that has failed repeatedly to heal the country. Greeks will get more of the brutal belt-tightening that they voted against. The creditors will probably see even less of their money than they would with a package of reduced austerity and immediate debt relief.
EuroStoxx is resisted by its Cycle top.
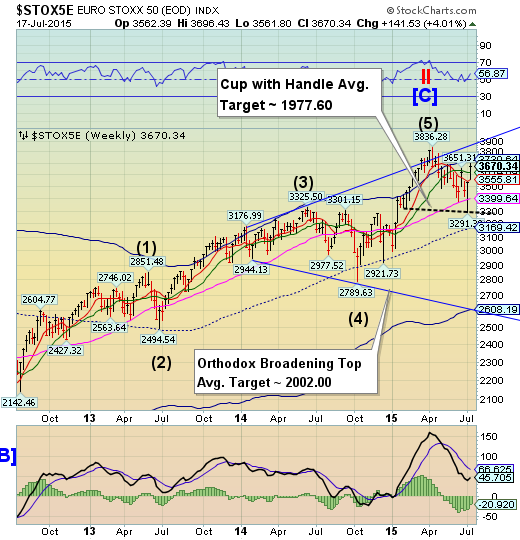
EuroStoxx 50 continued its bounce from the lip of a Cup with Handle formation, but stopped beneath its Cycle Top resistance at 3730.64. Its Cyclical period of strength may be over this weekend. Should it fail to go higher, a panic decline may result.
(WSJ) A rally in European stocks extended into its seventh session Thursday, as investors grew more optimistic that Greece would be able to avoid tumbling out of the eurozone.
The Stoxx Europe 600 closed 1.4% higher. The pan-European index has risen more than 4% so far this week, and more than 6% so far in July, largely fueled by Greek developments.
Some pressure was taken off the cash-strapped country Thursday. The European Central Bank said it was raising its emergency lending to the country’s banks. Eurozone finance ministers granted “in principle” a bailout from the bloc’s fund, after Greece’s Parliament approved austerity measures. However, several top decision makers expressed reservations about whether Athens could see through its promised overhauls.
The yen consolidates, giving back some gains.
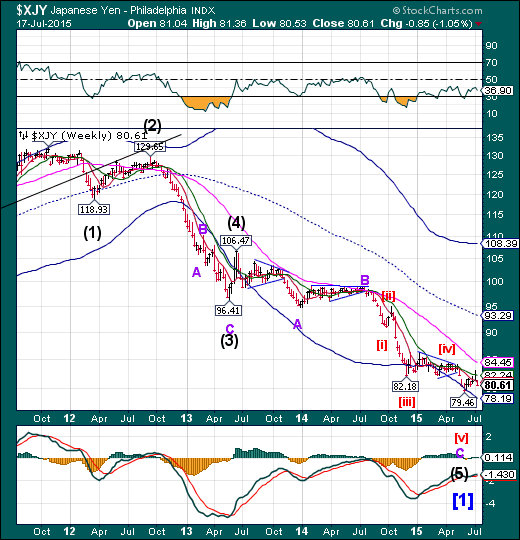
The yen may be over its period of weakness this weekend. If so, it may see a stronger rally that may last through the month of July.
(WSJ) Prime Minister Shinzo Abe’s policies have favored a weaker yen, and he has pointed to a rising stock market, improved corporate profits and a revival in manufacturing as marks of success.
Some aren’t persuaded, and Japan Real Time spoke with one opposition lawmaker who is particularly concerned about Japan’s standing among the world’s economic powers.
“The value of a country’s currency normally reflects its national power,” said Motohisa Furukawa, a former economics minister who is a member of the Democratic Party of Japan. “The yen’s further slide would do more harm than good” because Japan relies on imports for much of its energy and food, he added.
The Nikkei challenged its Cycle Top.
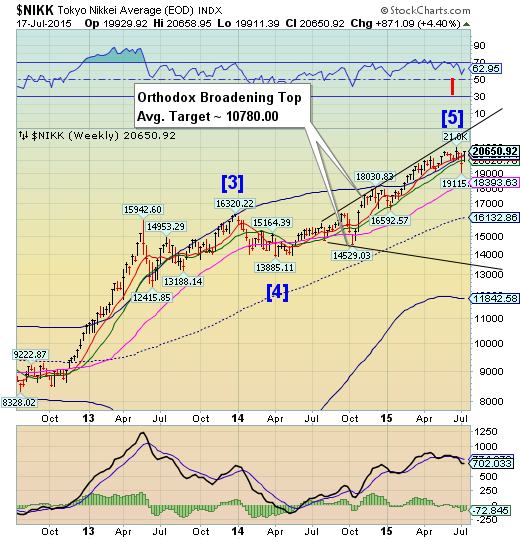
The Nikkei closed above its Cycle Top at 20423.14, but the rally may run out of steam by early next week. The Nikkei may need to make a final new high before it reverses, but the period of strength will be over in short order. We may expect a sharp decline through the rest July and possibly the entire month of August to follow.
(BBC) Japan's Nikkei index registered its biggest weekly gain since October, while Asian shares were mostly higher, as worries over Greece and China eased.
The Nikkei 225 closed up 50.80 points at 20,650.92, its fifth gain in a row, having risen by 4.4% over the week.
U.S. dollar may challenge its Cycle Top next.
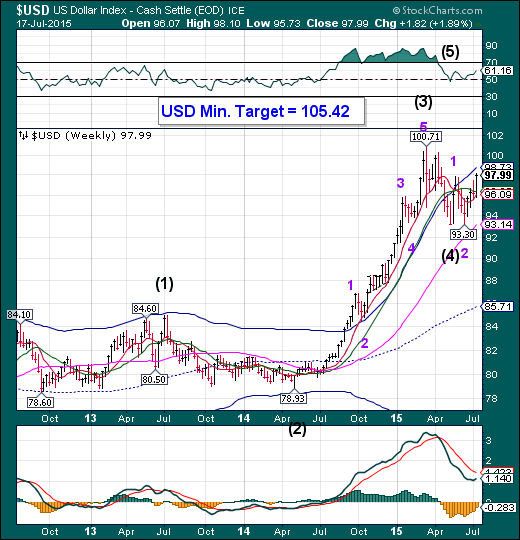
The US dollar had the best week since January, but may see weakness creep in through the end of July. Since this probe did not break out above its Cycle Top resistance at 98.73, it may fall back in a retracement to consolidate its gains. The Cycles suggest a brief correction lasting about two weeks before the rally continues.
(Globe And Mail) The U.S. dollar was set for its biggest weekly rise since May on Friday, as economic data reinforced expectations for a U.S. rate hike by the end of 2015, with eurozone shares steadying after strong gains, as Greece looked set to secure a bailout.
The dollar steadied near a seven-week high against a basket of major currencies, receiving a boost against its peers after lower U.S. jobless claims. The dollar index is up 1.5 percent this week.
USB fell, then rallied to Long-term support.
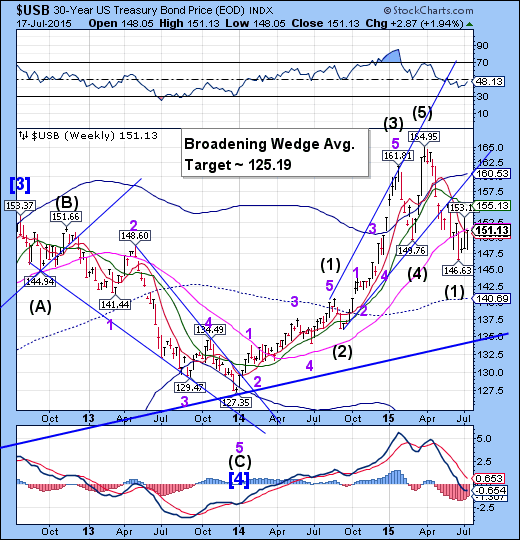
The Long Bond established a toehold above Long-term support at 150.60, after testing its prior lows. This may be an early sign of liquidity flowing from stocks to Treasuries. If so, the rally may see a breakout next week.
(WSJ) Signs of economic momentum and continued subdued inflation extended a week-long pattern on Friday that supported prices of long-dated Treasuries, while those of shorter maturities struggled.
In late-afternoon trading, benchmark 10-year notes gained 1/32 in price to yield 2.349%. Two-year notes shed 1/32 to yield 0.669%, the highest since July 1. Bond yields move inversely to their prices.
The mixed performance came as the U.S. reported upbeat housing activity, with more homes breaking ground in June than expected. But a separate report showed relatively tame consumer prices last month, against many economists’ expectations early this year for a stronger price revival.
Gold bounced from the Head and Shoulders neckline.
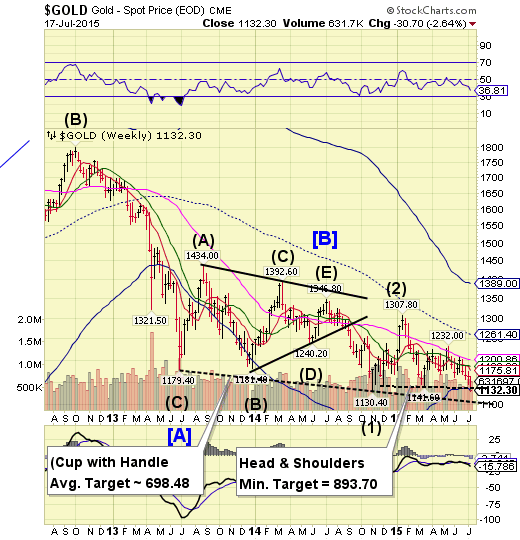
Gold closed beneath the neckline of the Head and Shoulders formation with a minimum target of 893.70, and beneath Cycle Bottom support at 1133.80. The Cycles Model now suggests a substantial decline into late July.
(WSJ) Gold prices tumbled to a five-year low on Friday, reeling from upbeat U.S. economic data that boosted expectations for higher interest rates.
Investors are dumping gold because they see little chance of the precious metal resuming a decade long rally that ended in 2011. Gold, which throws off no income and costs money to hold, will lose even more of its appeal, analysts say, once the Federal Reserve raises rates for the first time in nearly a decade, a move that’s expected to push yields higher across bond markets.
Crude decline continues.
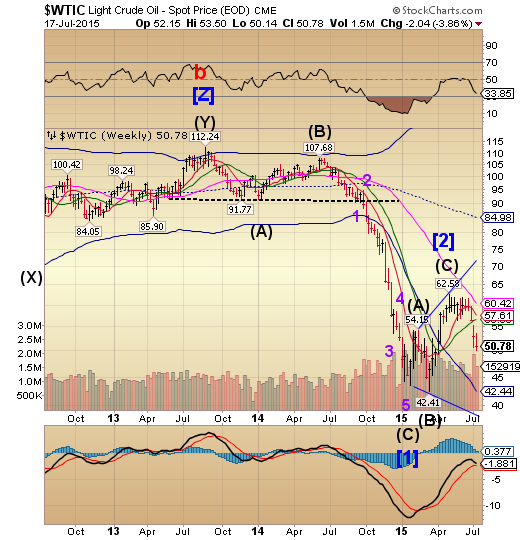
Crude made a brief consolidation last week, but closed near its lows, suggesting more downside is due. The decline appears to be capable of lasting another week or longer, according to the Cycles Model.
(WSJ) U.S. oil prices recovered from an intraday drop Friday to settle nearly flat, after data showed a decline in the number of oil-drilling rigs.
Light, sweet crude for August delivery settled down 2 cents at $50.89 a barrel on the New York Mercantile Exchange, the lowest settlement since April 9. The contract fell 3.5% this week.
Brent, the global benchmark, rose 18 cents, or 0.3%, to $57.10 a barrel on ICE Futures Europe. Prices fell 3.2% on the week.
The number of rigs drilling for oil in the U.S. fell by seven this week, according to oil-field-services company Baker Hughes (NYSE:BHI) Inc. The oil-rig count plummeted to multi-year lows earlier this year, as companies cut spending in response to low oil prices, but then rose for two straight weeks, weighing on prices.
Shanghai Index is on the rebound.
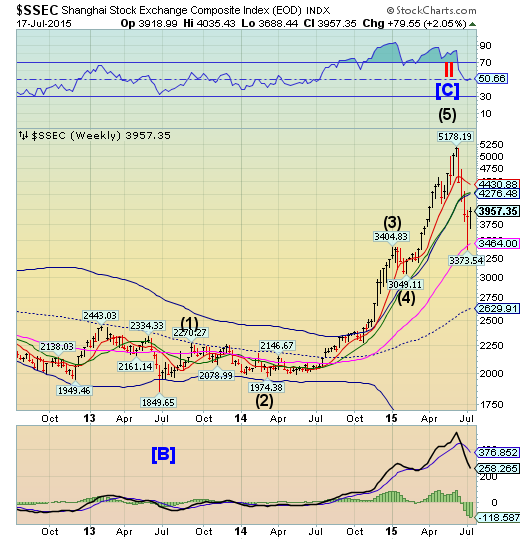
The Shanghai Index is on the rebound, with a Cyclical period of strength that may last through the end of the month. The bounce may challenge its Cycle Top at 4276.48.The retracement rally still appears to have some life in it.
(ZeroHedge) About a month ago, China ran into a small problem.
The country’s "world-beating" equity bubble - which has served as a wonderful distraction from China’s decelerating economy and bursting property bubble - suddenly collapsed.
Starting earlier this year and accelerating into June, when the CDSC channeled its inner Ronald McDonald and cancelled the series, data out of China suggested that semi-literate farmers, housewives, and famously, banana vendors, were opening millions of new stock trading accounts each and every month.
Subsequently, analysts began to take a hard look at margin lending, which eventually rose to CNY 2.2 trillion and touched a record 18% of the SHCOMP free float market cap on July 3.
The Banking Index makes another attempt at the high.
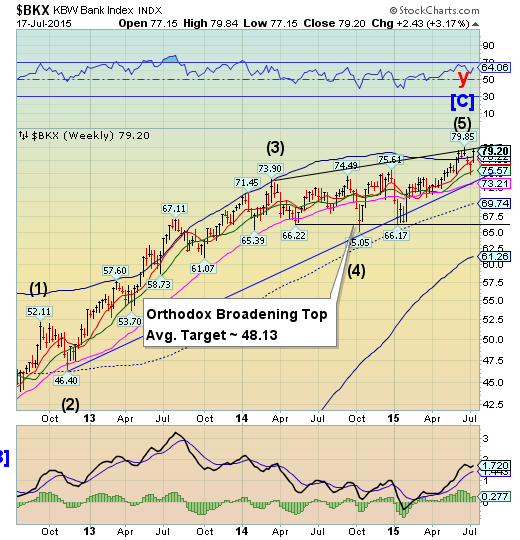
BKX rallied back to the upper trendline of its Orthodox Broadening Top. The odds are that the rally may be over, or nearly so. Broadening tops, also known as Megaphone formations, usually signal a change in trend. They are also highly emotional and unpredictable.
(FirstLook) Three top Democrats are accusing the Department of Housing and Urban Development of quietly removing a key clause in its requirements for taxpayer-guaranteed mortgage insurance in order to spare two banks recently convicted of federal crimes from being frozen out of the lucrative market.
HUD’s action is the latest in a series of steps by federal agencies to eliminate real-world consequences for serial financial felons, even as the Obama administration has touted its efforts to hold banks accountable.
In this sense, the guilty plea has become as meaningless to banks as their other ways of resolving criminal charges: out-of-court settlements, or deferred prosecution agreements. “Too Big to Fail” has morphed into “Too Big to Jail” — and then again, into “Bank Lives Matter.”
(Liberty Blitzkrieg) This is impressive. Very, very impressive.
It appears that Ryan Coonerty, the Supervisor of the Third District of Santa Cruz County, wrote a letter back in June to the rest of the Board of Supervisors, in which he bravely pleaded the county to cease business operations with five of the TBTF Wall Street Mega Banks. Why, you ask? Well, because they are criminal felons. Considering Eric Holder refused to punish them (see: Cronyism Pays – Eric “Too Big to Jail” Holder Triumphantly Returns to His Prior Corporate Law Firm Job), someone has to take a stand.
Here are a few choice excerpts from the letter:
The banks have agreed to plead guilty to felony charges of conspiring to manipulate the price of U.S. dollars and euros exchanged in the foreign currency exchange spot market… The behavior of these banks is offensive, and signals a Wall Street culture in which several big banks broke the law even after years of strong criticism and increased regulation following the economic crisis.
(ZeroHedge) You’re likely thinking that a discussion of “sound banking” will be a bit boring. Well, banking should be boring. And we’re sure officials at central banks all over the world today—many of whom have trouble sleeping—wish it were.
