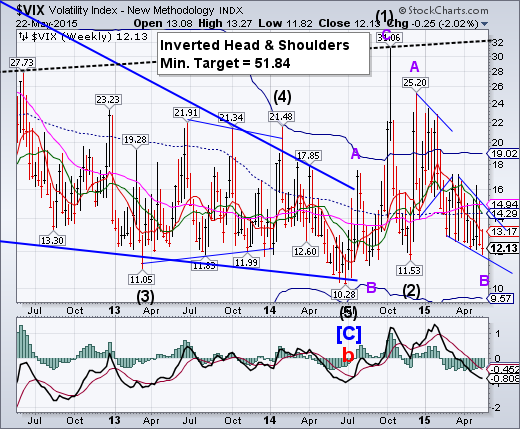
- VIX made a new Cycle low on Friday, May 22. A close above the 50-day Moving Average at 14.94 may break out of the declining wedge formation and confirm a sell signal for SPX.
SPX may be ending its sideways consolidation.
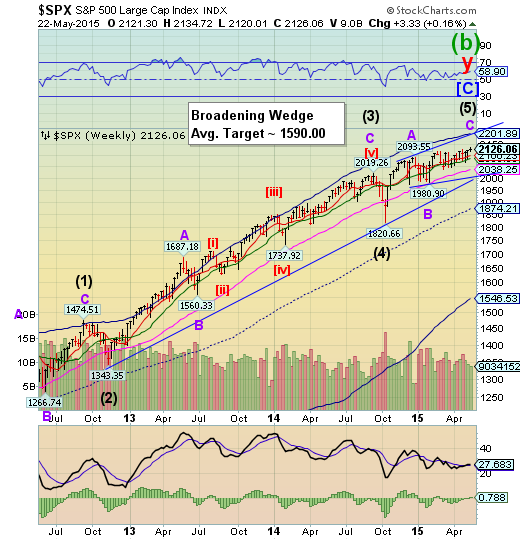
SPX made a new intra-day high on Wednesday (2134.72), and possibly its final closing high on Thursday (2130.82). A loss of Short-term support at 2100.23 and Intermediate-term support at 2088.06 may signal a panic decline through the end of June.
(ZeroHedge) Retired central banker, blogger, bond guru and hedge fund consultant Ben Bernanke just uttered the following total rubbish...
*BERNANKE: NO LARGE MISPRICINGS IN U.S. SECURITIES, ASSET PRICES
In an effort to save whoever it is that will pay him $250,000 next for these wise words, we offer five charts.
NDX does not make a new high.
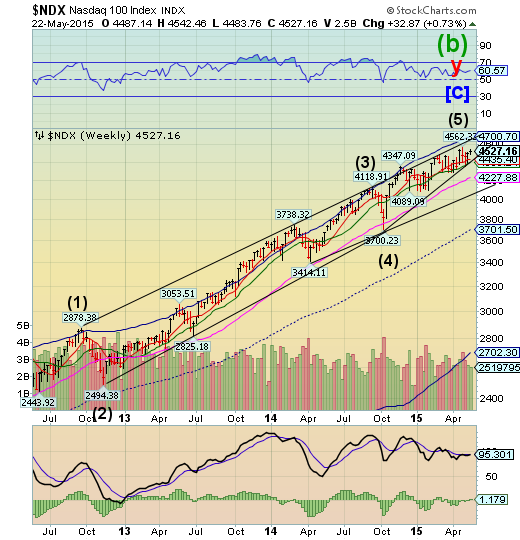
NDX made its final high on April 27, ending a five wave rally. Since then, it has made an impulse down and a significant, and possibly a complete, retracement. This is important, since the declining impulse was a Master Cycle low on May 6. Its Ending Diagonal trendline is at 4435.00. Breaking the trendline implies a complete retracement to its October 15 low at 3700.23.
(ZeroHedge) More than merely a subjective, psychological state, the complacency of market participants can be effectively quantified, which is precisely what Deutsche Bank (XETRA:DBKGn)'s David Bianco has done by looking at the ratio of the market's P/E to implied vol or VIX.
As Bianco notes,
"Our PE/VIX market emotion indicator climbed to 1.3 on S&P trailing PE of 18 and 3m avg VIX of 14. A level between 1.2-1.5 signals complacency. There was similar complacency going into summer last year, with S&P trailing PE at 17.5 and a calm market kept VIX at 10-14. The complacency persisted to July but then faded as the risk of higher yields came on falling unemployment, but yields ultimately stayed subdued preventing any major summer sell-off. Yet a selloff began in late Sept as oil prices started cracking and the dollar climbing."
High Yield Bonds in a final attempt at a new high.
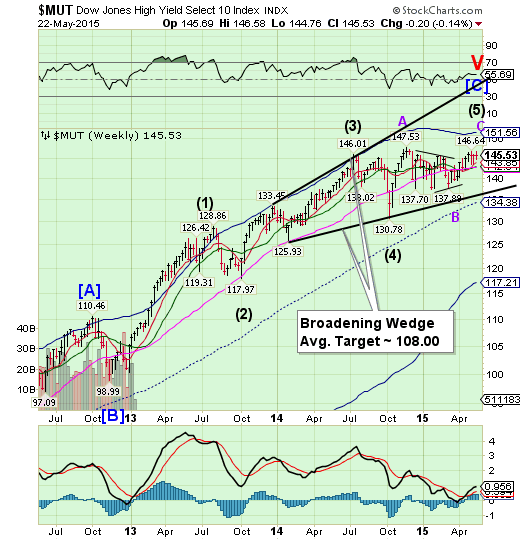
The High Yield Index may be making its final attempt at bettering its November 28 high at 147.53. As investor cash flows into High Yield, its target appears to be near 148.50. However, it may be finishing a period of strength that could give way to weakness rather quickly. It may simply make a nominal new high before a reversal. It is also due for a major low by the end of June.
(MarketRealist) Issuance volume for the week ended May 15, 2015 was marginally lower from the previous week. Junk bond, or high-yield debt, issuers continued on a strong spree of fundraising from the primary junk bond market. High-yield debt is tracked by the SPDR Barclays (LONDON:BARC) Capital High Yield Bond (ARCA:JNK) and theiShares iBoxx $ High Yield Corporate Bond Fund (ARCA:HYG).
According to data from S&P Capital IQ/LCD, dollar-denominated high-yield debt amounting to $8.5 billion was issued in the week ended May 15. The issuance volume fell by 2.1% from the week ended May 8. The number of transactions rose from 14 to 18 week-over-week.
The euro ends its rally.
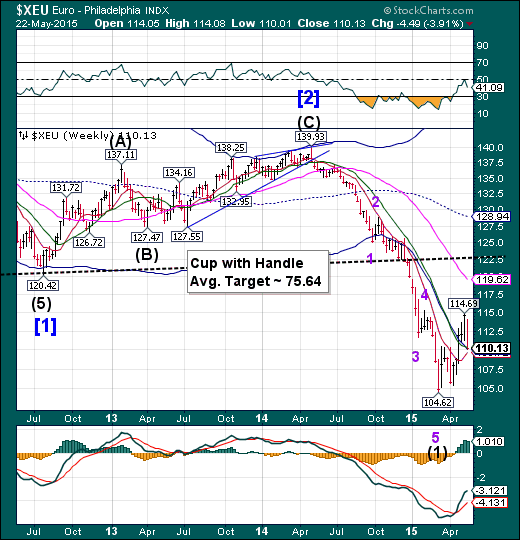
The euro made a sharp reversal down to its Weekly Cycle Bottom support at 110.12, as expected. It is probable that it will break its final supports this week as it resumes its decline over the next 3-4 weeks.
(Bloomberg) The euro weakened after Greece told creditors to lower demands that are holding up bailout funds. Emerging-market stocks fell as speculation grew the U.S. was moving closer to raising interest rates, while Polish equities slid the most in four months and Spanish markets dropped.
Europe’s currency slid 0.3 percent to $1.0980 at 3:56 p.m. in New York. The MSCI Emerging Markets Index of stocks fell 0.5 percent. Poland’s stocks sank after an opposition candidate won the presidency, while Spanish shares retreated as local elections showed support for parties seeking to overturn the status quo.
EuroStoxx extends a brief period of strength.
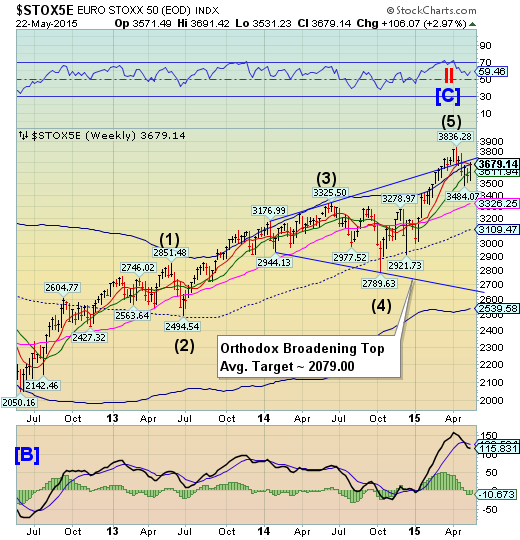
EuroStoxx 50 rallied to its Cycle Top resistance at 3679.35 in a probable retracement this week. It may be on a sell signal once it declines beneath weekly Short-term support at 3611.94. This may be considered a reversal in trend that may receive further confirmation by declining beneath its Long-term support at 3314.53. The Cycles Model suggested a potential panic decline beginning on Wednesday. However, it may have been extended to the weekend.
(Reuters) - European shares fell on Monday, with the Spanish and Greek stock markets hit by investors' concerns over Greece's debt problems and a poor local election result for the government in Madrid.
Athens' main ATG equity index fell 3.1 percent as the Greek government said on Monday that it intended to make good on its debt obligations, but urgently needed aid to be able to do so. The ATG is down by around 1.5 percent since the start of 2015, under-performing other European stock markets.
The Greek government's comments came as several senior officials insisted Athens had no money to pay a loan installment due next week.
The yen breaks beneath its Triangle.
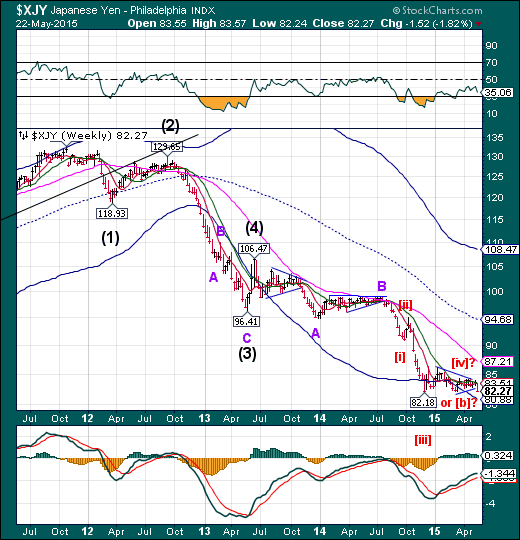
The yen broke beneath its Triangle formation, but did not exceed the December 5 low of 82.18. The Cycles Model suggests a probable period of weakness for the next week or two. A downside break may confirm that view.
The Nikkei makes a new high at 20320.00.
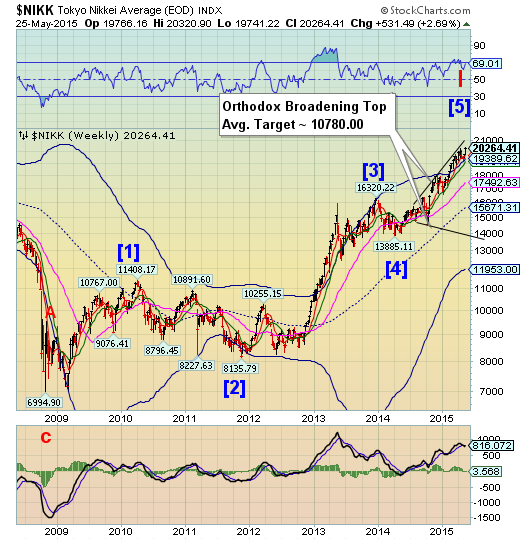
The Nikkei made a new high (not seen since 2000) at 20320.00 on Thursday, which may close out this period of strength. A period of weakness is waiting in the wings, which may kick off a six week decline. The reversal may be confirmed with the loss of weekly Short-term and Intermediate-term supports.
(Bloomberg) Japanese stocks climbed for a seventh day, buoyed by carmakers, after the nation’s exports rose more than forecast and expectations for an U.S. interest-rate increase this year weakened the yen.
Toyota Motor Corp. (NYSE:TM) was the biggest boost to the Topix index as government figures showed vehicles were the largest contributor to April’s gain in exports. Tokyo Electric Power Co. (TOKYO:9501) jumped 6.7 percent after a report the utility won an order to build a gas-fired power plant in Qatar. Takata Corp. (TOKYO:7312) slumped 4.3 percent after automakers announced more recalls in Japan and Australia related to the company’s air bags.
U.S. dollar reverses higher from its Cycle low.
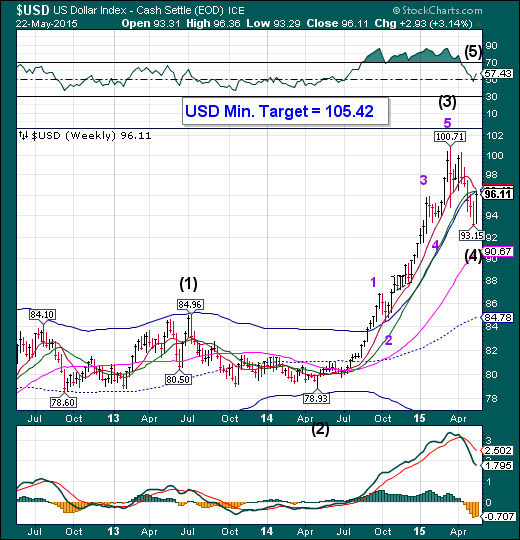
The US dollar reversed from its cycle low on Monday. A final blow-off top may ensue, with a minimum target of 105.42. The first leg of the rally may last through the end of June, but may revive again later in July, after an expected Trading Cycle low
(MarketPulse) Over the past few weeks, dollar bulls have been trading with their backs against the wall, pressured by the spike in global sovereign bond yields, and the unknown timing of the Federal Reserve’s first rate hike.
However, they can breathe a little easier. The USD moved higher against Group of 10 currencies supported by Friday’s upbeat U.S. inflation data and comments by Fed Chair Janet Yellen. The dollar is looking to build upon its gains last week, in which it saw its best weekly performance in four years.
USB bounces a second time off the trendline.
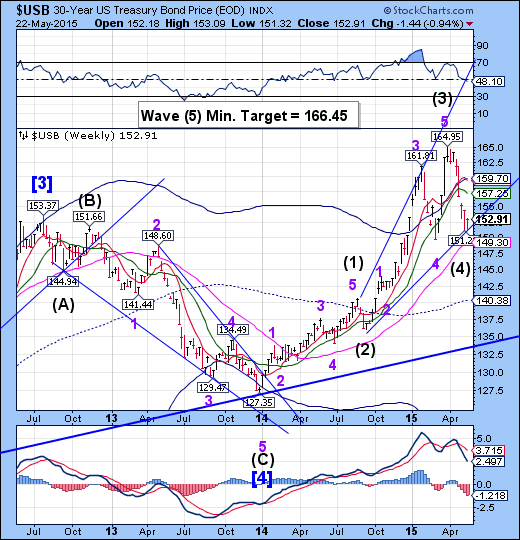
The Long Bond bounced from a significant low at 151.26 on May 13 and retested its Master Cycle low this week. It had an “inside” week, suggesting uncertainty in the market. However, there may be a period of strength that may propel USB higher through the end of June. The minimum target for this rally appears to be 166.45. USB may go higher in this Broadening Wedge formation.
(WSJ) U.S. Treasury bonds fell Friday, capping a losing week, after an inflation reading posted the biggest monthly gain since January 2013.
The Federal Reserve is closely watching inflation data to decide when to raise short-term interest rates. Inflation has been subdued and running below the Fed’s 2% target. Investors are concerned that if inflation picks up speed, the Fed could raise interest rates sooner than many investors expect, which would hurt the value of outstanding bonds.
Fed Chairwoman Janet Yellen reiterated Friday in a speech that the central bank is on track to raise interest rates some time this year. Ms. Yellen continued to expect the U.S. economy to rebound from a soft patch during the first quarter.
Gold retested Long-term resistance, then reversed.
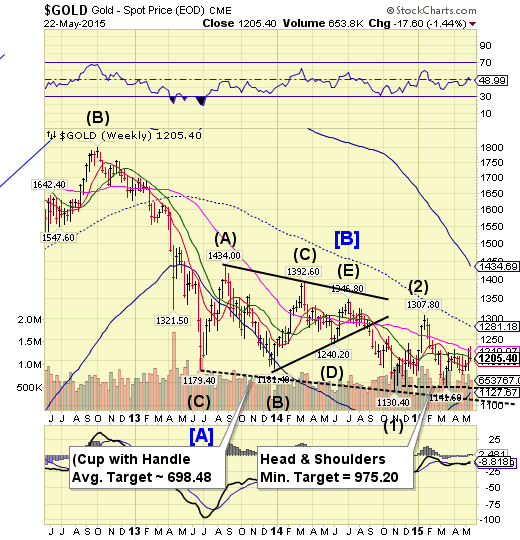
Gold retested its Long-term resistance at 1210.07 on Monday, then sold off. It closed just above weekly Intermediate-term support at 1203.27. A decline beneath 1141.60 triggers the Head and Shoulders formation with a minimum target of 975.20. The Cycles Model now suggests a substantial low in late June.
(Bloomberg) Gold prices traded little, slipped as prospects for the first U.S. interest rate increase since 2006 helped to push the dollar to a one-month high. Silver and palladium declined.
Federal Reserve Chair Janet Yellen said she expects to raise rates this year if the economy meets her forecasts. Inflation is moving toward the Fed’s 2 percent target, with a report on Friday showing that core consumer prices climbed 0.3 percent in April, the biggest gain in more than two years. While a pickup in inflation can boost demand for bullion as a hedge, higher borrowing costs cut the allure of the metal, which generally provides returns only through price gains.
Crude spent another week beneath its retracement high.
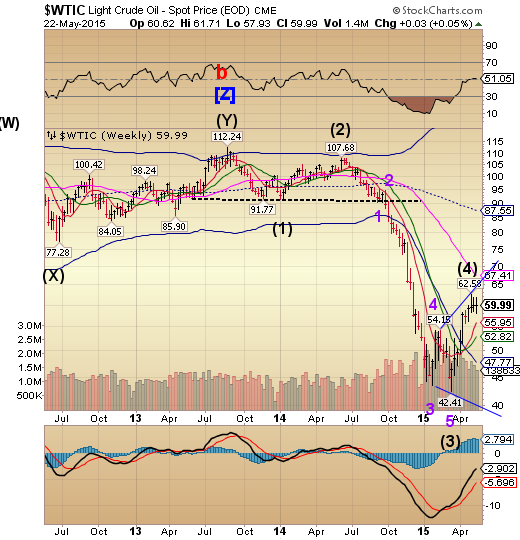
Crude reversed on May 6, in line with the cycles Model after exceeding its target high.The Cycles Model now suggests a sharp decline through the end of May.The near-term target is 40, but it may descend even further.
(MarketRealist) WTI (West Texas Intermediate) crude oil futures for July delivery show a trading range pattern. Prices have been oscillating between $58 and $61 per barrel for almost a month. Declining US crude oil inventory and an appreciating dollar are swinging crude oil prices.
Bearish sentiment could drive oil prices lower. The nearest support for crude oil is at $55 per barrel. Prices last tested this mark in April 2015. Massive production from Russia and OPEC (the Organization of the Petroleum Exporting Countries) should drive oil prices lower. On the other hand, bullish traders could see resistance at $61 per barrel. Prices last hit this level in May 2015.
The trading range suggests that prices could oscillate between $55 and $64 per barrel. The oversupply consensus will drive crude oil prices down to $45 per barrel by October 2015, as per Goldman Sachs (NYSE:GS) estimates. July WTI oil prices are trading below the 20-day moving average of $60.22 per barrel.
Shanghai Index makes a new high.
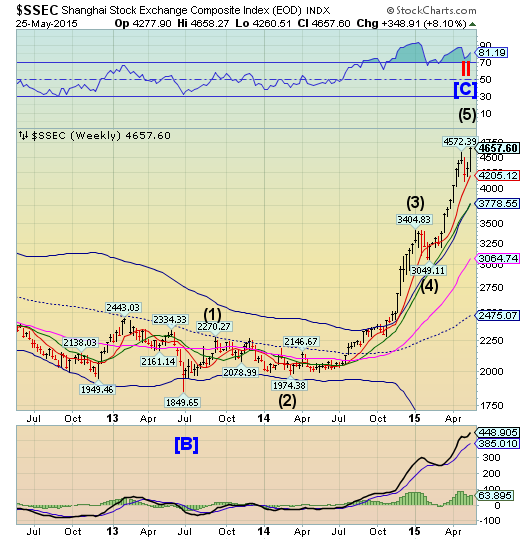
The Shanghai Index made a new retracement high. The September 2007 high at 6128.04 remains unchallenged. It appears that this particular period of strength may last through the end of this week.
(The Globe And Mail) Only in China can you predict the world’s biggest stock market rally and still come out looking like a pessimist.
A year ago, analysts who cover the 50 largest companies trading in Shanghai and Shenzhen said equities were set to rally 28 percent. Turns out, they weren’t anywhere near optimistic enough, as monetary easing and a buying frenzy among Chinese retail investors sent shares surging 111 percent through last week.
Analysts have been scrambling ever since, updating predictions, then reupdating them and re-reupdating them as stocks blew by their target prices. The rally that outran their forecasts is now making their jobs even more difficult as they try to assess the prospects of companies trading at multi-year highs with the possibility of further government stimulus.
The Banking Index reaches its Cycle high.
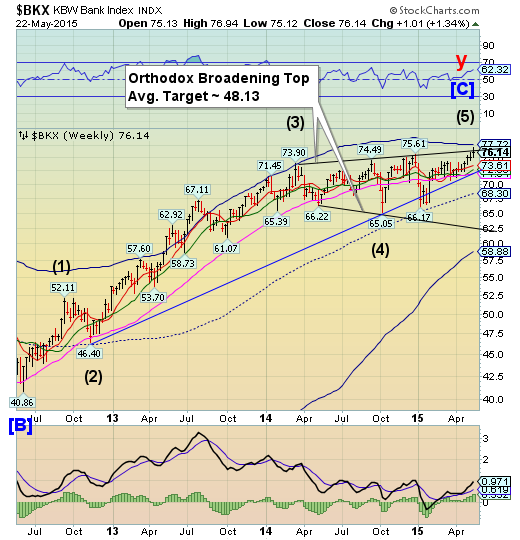
--BKX reached its weekly high on Tuesday at 76.94. In doing so, it briefly exceeded the upper trendline of its Megaphone formation, but did not reach its Cycle Top resistance. Critical supports and its first bearish trigger lie at 72.84, where the 3-year Ending Diagonal trendline and weekly Intermediate-term support lie. This is an inverted Cycle Top. The Cycles Model now implies that BKX may decline through the end of June
(WSJ) After losing ground in the first quarter, U.S. bank stocks are making a comeback.
The KBW Bank Index of large commercial-bank stocks is up 5.5% since March 31, compared with a 2.8% rise for the S&P 500. The bank index had dropped 2.8% in the first three months of the year, while the overall market made a slight gain.
Investors say several factors are at work.
Chiefly, many are growing more confident that U.S. growth will pick up in the second half of the year following a soft start to 2015, buoying long-term interest rates.
(ZeroHedge) Up until this moment, Greece may not have had the financial wherewithal to pay its creditors, forced instead to use circular math gimmicks in which the IMF paid the IMF for the country's most recent €750 million due on May 12 when it effectively pre-defaulted and used SDR reserves as "payment," but at least it had a united facade when facing Europe and political cohesion when dealing with the Troika.
That too may have just evaporated over the weekend, when in a surprisingly close vote showing just how deeply the ruling Greek Syriza party has splintered, the hard line "Left Platform," a faction within Syriza, proposed that Greece stop paying its creditors if they continue with "blackmailing tactics" and instead seek "an alternative plan" for the debt-racked country. Its motion called for the government to default on the IMF loans rather than compromise to creditor demands, among which a change to value-added tax rates, further liberalization of the labor market and changes to the pension system, including further cuts to pensions and wages.
(ZeroHedge) We're all about to be taken to the woodshed, warns David Stockman in this excellent interview. The huge wealth disparity is "not because of some flaw in capitalism, or Reagan tax cuts, or even the greed of Wall Street; the problem is central banks that are out of control." Simply put, they have "siphoned financial resources into pure gambling" and the people that own the stocks and bonds get the huge financial windfall. "The 10% at the top own 85% of the financial assets," and thus, thanks to the unleashing of almost limitless money-printing, which has created a massive worldwide financial inflation, "the central banks have created and exaggerated the wealth gap." Stockman concludes, rather ominously, "it's a coup d'etat, the central banks have taken over - unconstitutional domination of the entire economy."
