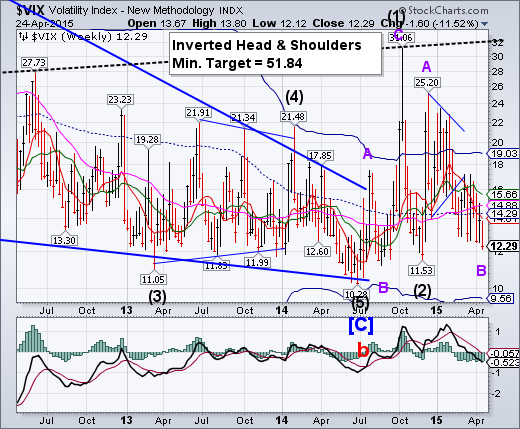
-- VIX made a new Master Cycle low on Thursday, 57 days after the initial Cycle low on February 25. It occurred in the form of a rare triple zigzag formation. Who is the deep pocketed Volatility seller?
SPX makes a new closing high.
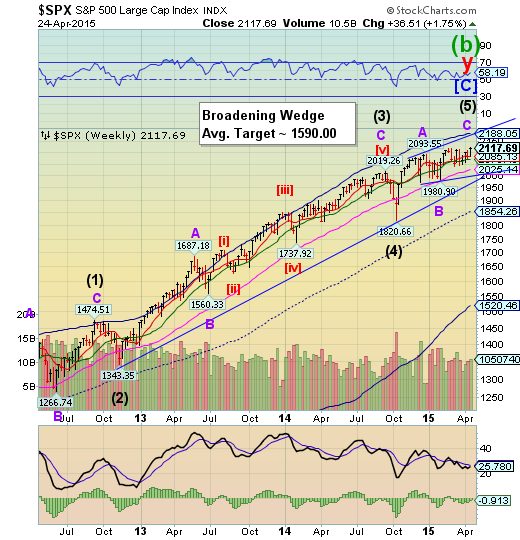
SPX eked out a new intra-day (2120.92) and closing high (2117.69) today. The support levels have become dangerously shallow, making it easier to break down. Weekly Intermediate-term support is at 2070.48, while weekly Long-term support is at 2025.44. The uptrend may be broken at the long-term trendline at 1985.00-1990.00. The next decline may not be saved at Long-term support as the last one did on October 15.
(ZeroHedge) Over the last three days, we have reported that some of the most important investment voices in the world are more than a little scared about the ravenous appetite for risk playing out in the market, and the fact that they have been ignored is beyond unnerving. Central banks are driving all investment decisions, and what this implies is that they are in this trade so deeply that there is no obvious or practical exit.
NDX making its final thrust.
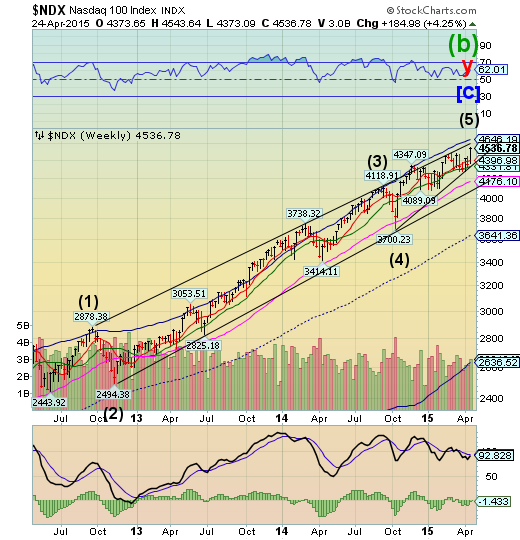
NDX appears to be making its final thrust to its high. Its proposed target is 4533.50, so it has met its price objective. The expected Cyclical low inverted to a Cyclical high, instead. The Cycle inversion may have been to allow NDX to meet its price target.
(ZeroHedge) With the Nasdaq sitting at new highs having finally eclipsed the previous record of 5,048 set in March of 2000 and with consumers not-so-eagerly awaiting their chance to get in on the supposed wave of the wearables future by purchasing their very own Apple Watch, we learn that the fate of the tech bubble now rests entirely on the shoulders of Tim Cook because as FactSet notes, "blended Q1 Y/Y EPS growth for the Information Technology sector is 0.7% [but] excluding Apple Inc (NASDAQ:AAPL), the blended earnings growth rate for the sector would fall to -5.1%.”
High Yield Bonds been there, done that.
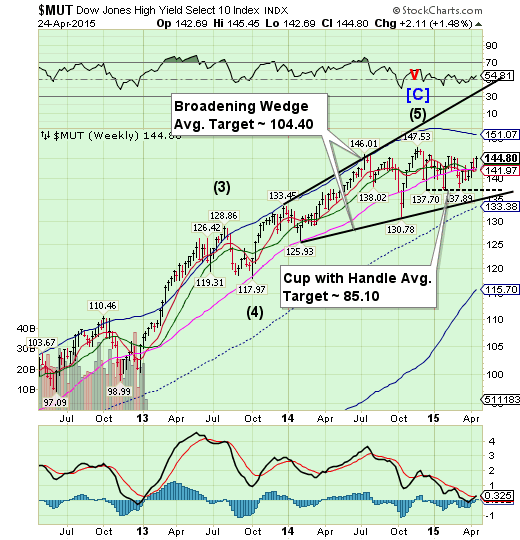
The High Yield Index closed only 21 ticks from its July 3, 2014 high. That’s over 9 months of sideways market at no gain or loss. This market has been literally buying time while supporting stock buybacks and more recently filling financing gaps left by banks withdrawal of credit lines. A failure at this point may cause difficulties in new high yield financing that has supported stock prices during a declining macroeconomic environment. This will not end well.
(WolfStreet) “In extreme overvaluation” – that’s how bond guru Marty Fridson characterizes the current junk-bond market. Junk bonds are supposed to offer high yields to entice investors to take on the risks. They’re still – somewhat quaintly – called “high yield” in polite society. But it has become a misnomer in this era when investors are scrambling to buy just about anything to get even a teeny-weeny bit of yield, regardless of the risks.
And now the risks are becoming apparent.
The euro goes higher.
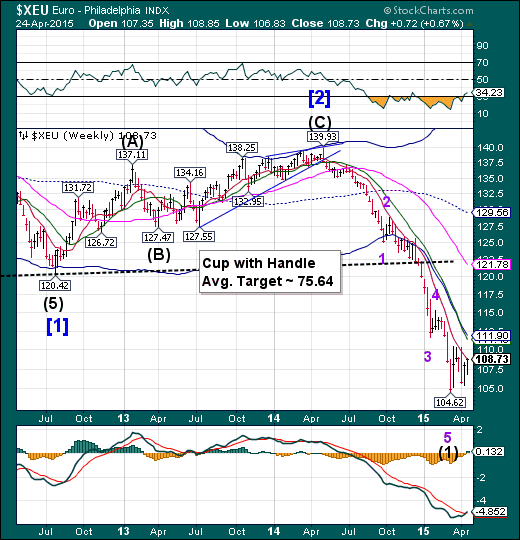
The euro continued its rally up to weekly Short-term resistance at 108.75 this week. A rally above weekly Short-term resistance may allow it to challenge its Cycle Bottom at 111.90, which may be the limit to the retracement.
(Forbes) The euro hit a two-week high against the U.S. dollar on Friday (€1.0900), buoyed by indomitable German confidence, and rumors that bankrupt Greece will manage to wiggle out of its default predicament in the nick of time.
The mighty buck is closing out this week in a slump thanks to soft new home sales data released yesterday that fell -11.4%, month-over-month. That knocked a number of fixed-income dealers’ faith in the likelihood of the Federal Reserve hiking rates this year.
Euro Stoxx hesitates at the trendline.
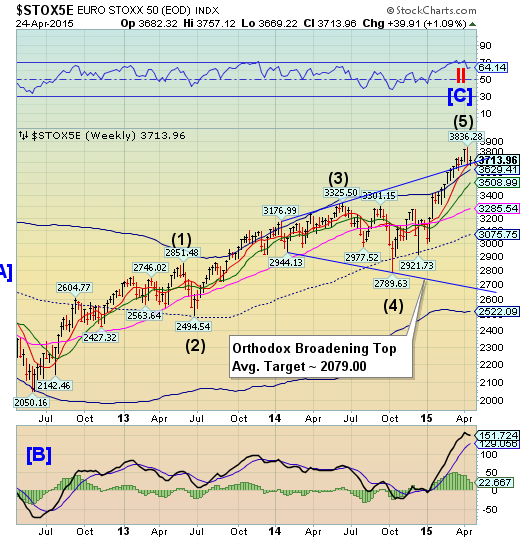
The Euro Stoxx 50 bounced at the upper trendline of the Orthodox Broadening Top. However, Stoxx only eked out a tepid bounce. Could a rising euro cause a sell-off in Stoxx?
(GlobeandMail) World shares weathered soft readings on Chinese and Japanese manufacturing on Thursday that merely drove expectations of more policy stimulus there, though lacklustre euro zone data was less well received.
European stock markets opened higher, spurred by multi-year highs in Asia, but the mood soured after sluggish euro zone and German purchasing manager data followed another dire set of numbers from France.
It meant that, overall, euro zone private sector business growth was weaker than forecast, despite a big fall in the euro that could support exports and the launch in March of a much-awaited sovereign bond buying program from the European Central Bank.
The yen also makes a tepid bounce.
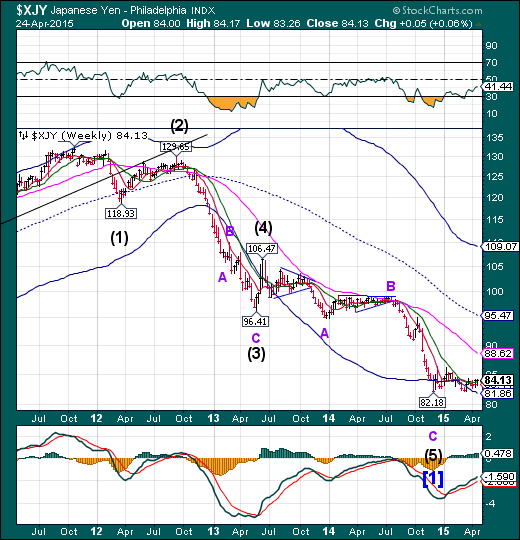
The yen rose this week, but did not break out of its sideways consolidation. All indications point to a probable strong breakout. The Cycles Model suggests a probable month-long rally may be brewing. This is the opposite of what many analysts are saying.
(CNBC) Reports the Bank of Japan (BOJ) is preparing to lower its inflation outlook could push the yen to its lowest level in 13 years, analysts say.
"Pushing out your inflation targets for a couple of years probably just means the yen will stay on this weakening trend," Trading Partners managing director Peter Boardman told CNBC. "[The yen] might go to 130-140 [against the U.S. dollar] in the future," levels not seen since the post-dotcom bust in 2002.
Two years after pledging to drag Japan out of a twenty-year deflationary spiral with a huge quantitative easing (QE) program, the BOJ's self-imposed two-percent inflation target remains out of reach.
The Nikkei closes above 20000.
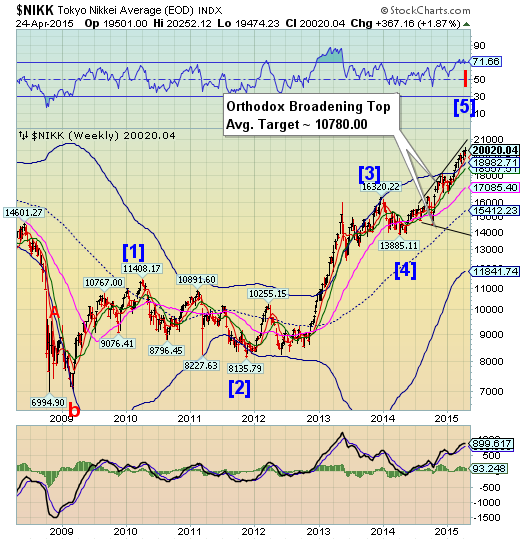
The Nikkei finally managed to close above 20000, but beneath the upper trendline of its Orthodox Broadening Top. The Nikkei at 20000 represents both round number resistance and its previous high in 2000. Both of these resistances pose a risk to the continuation of the rally. We’ll find out if this is true next week, since this weekend offers a Primary Cycle Pivot that may cause a strong reversal.
(TheEconomist) VETERAN investors well remember the last time Japan’s benchmark Nikkei index closed at 20,000, the sort of round number that pundits call “psychologically significant”. It was in April 2000, and the Nikkei went on to shed more than half its value over the following three years. So it was unsurprising that the dominant emotions elicited by the news on April 22nd that the Nikkei had closed above that level were shock and some foreboding. Earlier in the month, as the index approached the threshold, the economy minister suggested that there might be a “small bubble”.
U.S. dollar loses Short--term support.
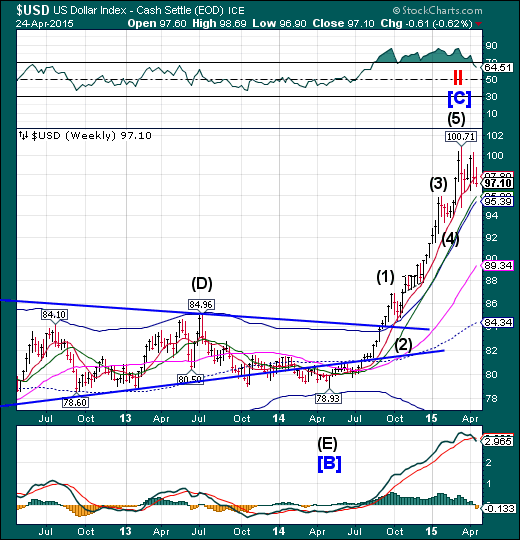
The US dollar broke through its weekly Short-term support at 97.80 this week. The Cycles Model calls for a continued decline, possibly to mid-Cycle support at 84.34. Critical support is at the Cycle Top at 95.39. Dollar longs may be crushed in a decline beneath that level.
(Reuters) - Speculators reduced positive bets on the U.S. dollar, pushing the currency's net long position to their lowest since September, according to data from the Commodity Futures Trading Commission and Thomson Reuters released on Friday.
The value of the dollar's net long position slipped to $37.87 billion in the week ended April 21 from $39.68 billion the previous week. Net longs on the dollar declined for a fourth straight week.
A recent string of disappointing U.S. economic data has supported the view that the pace of interest rate increases by the U.S. Federal Reserve will be slower than initially thought.
This has taken the steam out of the dollar rally.
USB declines.
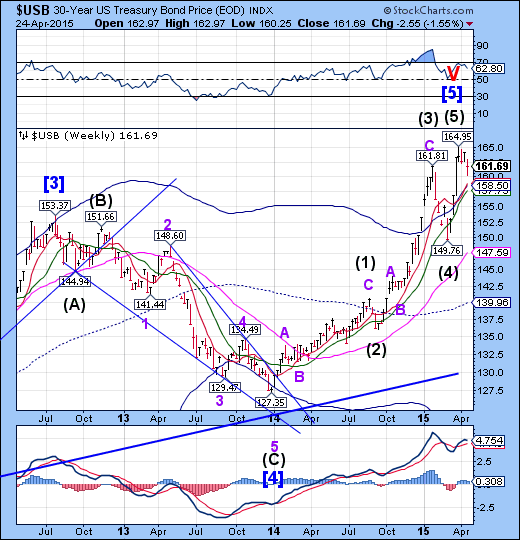
The Long Bond is down 2% from its high at 164.95. The next level of support is the weekly Cycle Top at 158.50. A decline beneath the weekly cycle top may incite a longer, deeper reaction. There seems to be no media commentary since Treasuries fell this week.
Gold may be completing its right shoulder.
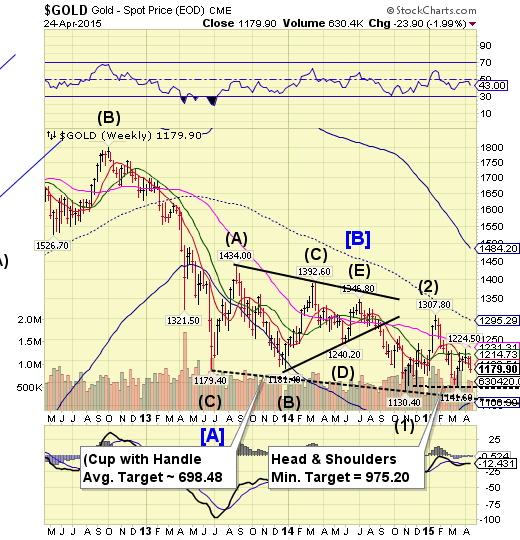
Gold resumed its decline, forming the right shoulder of the Head & Shoulders formation. A failure beneath 1141.60 triggers the formation with a minimum target of 975.20.
(WSJ) Gold prices fell to their lowest level in more than a month Friday, as a rally in U.S. technology stocks prompted investors to dump the safe-haven metal and buy equities.
Gold for June delivery, the most actively traded contract, slid 1.6% to $1,175 a troy ounce on the Comex division of the New York Mercantile Exchange, the lowest settlement since March 19. The percentage drop was the sharpest gold prices have seen since March 6.
It was a sharp detour for gold, which had climbed in recent weeks on worries over Greece’s future in the eurozone and on perceptions that the Federal Reserve may delay an expected interest-rate increase until after the summer. Some investors buy gold in times of uncertainty, believing it will outperform other assets. At the same time, gold benefits from continued low interest rates, as it doesn’t pay dividends or interest to its holders and struggles to compete with yield-bearing investments when borrowing costs rise.
Crude prices stall.
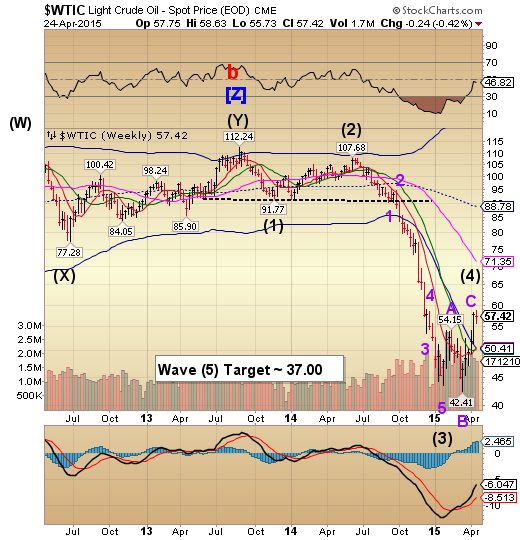
Crude made a marginal new high on Monday, then stalled. The Broadening Triangle Formation suggests a continuation of the original trend. There is a good probability of a further decline through mid-to-late May.
(WSJ) Oil prices rose to their highest level of the year on Thursday on expectations the oversupply of crude oil may be shrinking and concerns about violence in the Middle East.
Light, sweet crude for June delivery settled up $1.58, or 2.8%, to $57.74 a barrel, the highest settlement since Dec. 12, on the New York Mercantile Exchange. Brent, the global benchmark, rose $2.12, or 3.4%, to $64.85 a barrel on the ICE Futures Europe exchange, the highest level since Dec. 9.
In the U.S., signs of elevated demand for gasoline fuels boosted prices, along with a reported drop in crude-oil supplies at a key storage hub.
Shanghai Index at a Primary Cycle high?
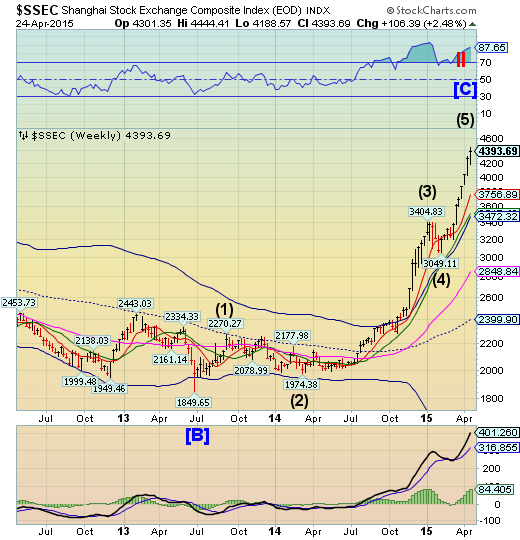
This weekend the Shanghai Index will have completed 90.3 months from its all-time high on October 16, 2007. This may be the cycles interval required to make the turn. Retail investors are piling onto this index, which is a good indication of an overbought market. Has it matched its 2007 peak yet? Please read the following… .
(ZeroHedge) We've all seen Chinese stocks explode in the last year; we've all seen margin lending soar to fund this exuberance; we've all read the dominant buyer in this trading frenzy is high-school-educated housewives; and we've all seen the analogs to the 2000 dotcom bubble. But, we guarentee you have never - ever - seen anything like this...
The number of new A-Share accounts opened just last week was a mind-boggling 3.25 million!!! That is double the number opened in the peak euphoria stage of the 2007 bubble...
The Banking Index hovers at Short-term support.
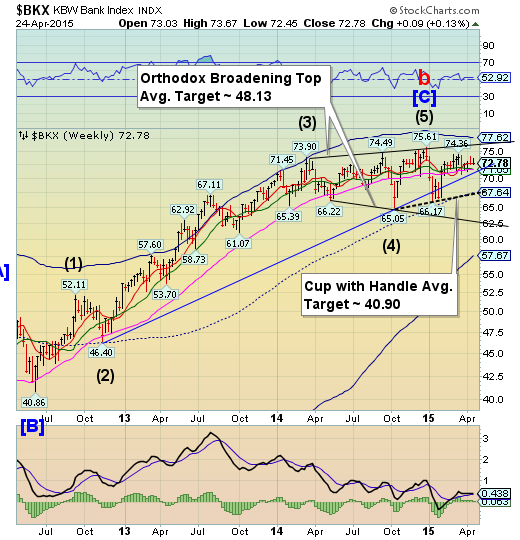
-- BKX rose just enough to close above Short-term support at 72.76. This kind of action is bearish but frustrating until supports finally give way. A resumption of the decline may break several critical supports and trigger as many as three bearish formations. The Cycles Model now implies that the next decline may last through mid-May. Could this be a waterfall event?
(ZeroHedge) We warned last week that capital controls were inevitable and it appears the first steps have been taken (very quietly):
GREECE ISSUES DECREE: LOCAL GOVTS OBLIGED TO TRANSFER DEPOSIT RESERVES AT CENTRAL BANK
So, following the pension fund raid, the Greek government is now centralizing all Greek cash citing an “extremely urgent and unforeseen need.".
One wonders if this is per Krugman's advice?
(ZeroHedge) And so another historic scandal involving the manipulation and rigging of one of the most important global markets, that of Libor which is the reference security for several hundred trillion in derivatives, goes in the history books.
Moments ago the NY Department for Financial Services announced that Deutsche Bank (XETRA:DBKGn) would pay $2.5 billion "in connection with the manipulation of the benchmark interest rates, including the London Interbank Offered Bank ("LIBOR"), the Euro Interbank Offered Rate ("EURIBOR") and Euroyen Tokyo Interbank Offered Rate ("TIBOR") (collectively, "IBOR")."
(ZeroHedge) The war on cash is escalating. Just a week ago, the infamous Willem Buiter, along with Ken Rogoff, voiced their support for a restriction (or ban altogether) on the use of cash (something that was already been implemented in Louisiana in 2011 for used goods). Today, as Mises' Jo Salerno reports, the war has acquired a powerful new ally in Chase, the largest bank in the U.S., which has enacted a policy restricting the use of cash in selected markets; bans cash payments for credit cards, mortgages, and auto loans; and disallows the storage of "any cash or coins" in safe deposit boxes.
(ZeroHedge) If you thought currency-wars were a problem, just wait until crony-wars begin. In a stunning show of disagreement among the omnipotent, The FT reports that a Freedom of Information Act request has confirmed The Bank of England wrote to US authorities seeking clarity about Berkshire’s absence from a provisional list of "systemically import" (Too Big To Fail) financial institutions (SIFIs). The US Treasury declined to comment...
Disclaimer: Nothing in this article should be construed as a personal recommendation to buy, hold or sell short any security. The Practical Investor, LLC (TPI) may provide a status report of certain indexes or their proxies using a proprietary model. At no time shall a reader be justified in inferring that personal investment advice is intended. Investing carries certain risks of losses and leveraged products and futures may be especially volatile. Information provided by TPI is expressed in good faith, but is not guaranteed. A perfect market service does not exist. Long-term success in the market demands recognition that error and uncertainty are a part of any effort to assess the probable outcome of any given investment. Please consult your financial advisor to explain all risks before making any investment decision. It is not possible to invest in any index.
The use of web-linked articles is meant to be informational in nature. It is not intended as an endorsement of their content and does not necessarily reflect the opinion of Anthony M. Cherniawski or The Practical Investor, LLC.
