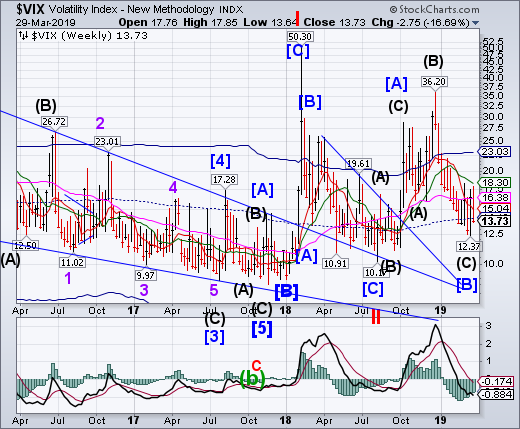
VIX rallied out of its Master Cycle low at 12.37 on March 19. It challenged long-term resistance at 16.38, but retreated, closing beneath mid-cycle support/resistance at 14.10. It is not far from a buy signal at 15.04.
(Bloomberg) Just how long can the eerie calm in stocks defy the panic buying in bonds?
As a key pocket of the U.S. yield curve inverts and benchmark bunds sit in negative territory, a measure of interest-rate volatility staged its biggest two-day surge since 2016 this week -- while the Cboe Volatility Index for the S&P 500 remains effectively unchanged for the month.
SPX consolidates beneath a lower high
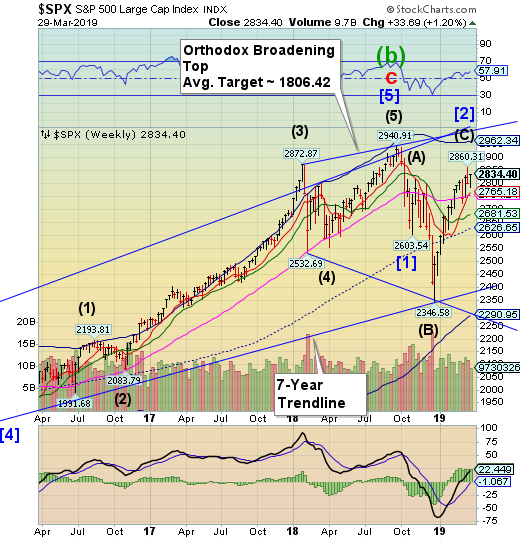
SPX came down from its peak on March 21, then made a 65% retracement of its decline. The rally is over 13 weeks long with the Economic Surprise Index at a 6-year low. The pattern on the Chart is an Orthodox Broadening Top, with a potential target at the 2016 low/
(MarketWatch) Stocks rallied into the close, ending just shy of session highs, as optimism over progress on U.S.-China trade talks appeared to overshadow concerns about a slowing economic expansion, while investors embraced the market debut of ride-hailing company Lyft, shares of which closed 8.7% higher than where they priced Thursday evening.
The session marked the final trading day for the first quarter of 2019, with the S&P 500 notching its best quarterly performance in nearly a decade.
NDX retraces 51% of last week’s decline
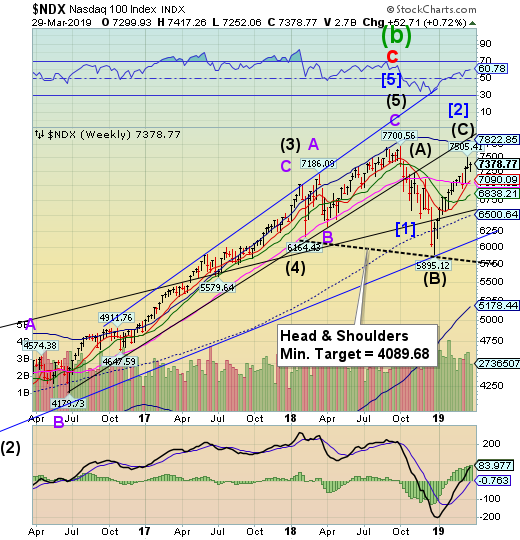
NDX bounced from its Short-term support (not shown), making a 51% retracement of its decline from its March 21 high. Stock prices and Treasury bond yields have decoupled as investors ignore the signs of a slowing economy.An aggressive sell signal awaits beneath the above-mentioned support at 7250.00.
(Bloomberg) What’s an investor to do when a tech stock is no longer a tech stock?
Bank of America Merrill Lynch’s U.S. stock market strategists said recently that investors should overweight technology shares. The catch is the group of tech stocks Bank of America recommended didn’t include Facebook, Netflix. or Google parent Alphabet., three of the closely watched FANG stocks — the other in that group is Apple — that are usually associated with the tech sector. In fact, Bank of America said those stocks should be avoided. Even more confusing: Neither of those investment calls included Amazon.com, which, along with the stocks of its sector — consumer discretionary — is a buy, according to Bank of America (NYSE:BAC).
High Yield Bond Index reverse from 14-month resistance
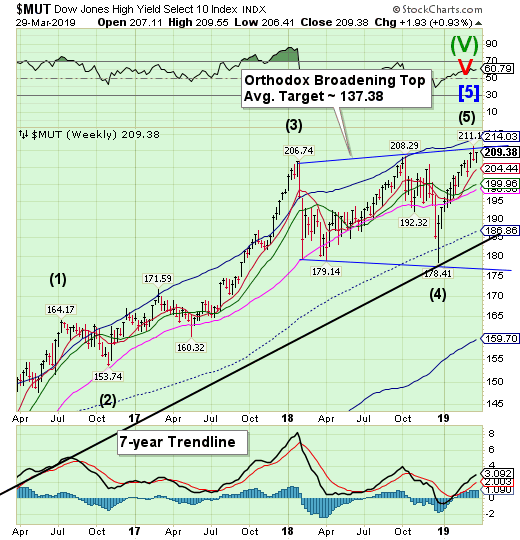
The High Yield Bond Index reversed from a resistance line established in January 2018. This completes a probable point 5 of an Orthodox Broadening Top. Point 6 may be the Cycle Bottom at 159.70. The Cycles Model warns of a probable month-long decline to follow.
(Bloomberg) After riding the best first quarter in at least a decade across assets including stocks, credit and crude, a growing chorus of investors has a new mantra: Don’t look down.
It’s the yin to this rally’s yang, the conclusion of the adage about things that keep going up. It also reflects growing unease that risk assets are running on little more than the fumes of a dovish turn by central banks.
As the sun sets on a remarkable quarter, discomfort is on display in the dash to bonds that pushed yields on the world’s safest debt to the lowest in years.
Treasuries are still going higher
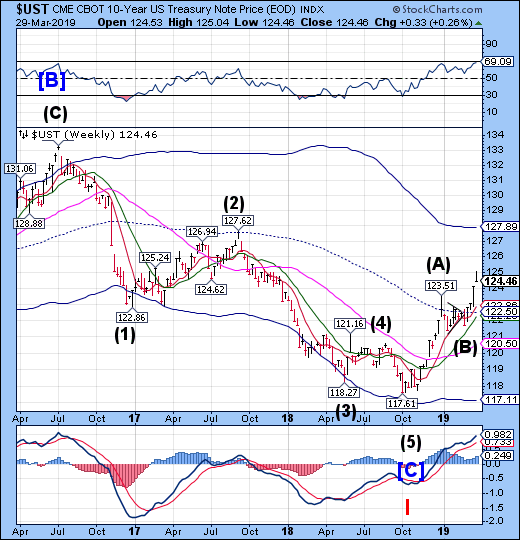
The 10-Year Treasury Note Index appears to be taking a rest after last week’s powerful breakout. It remains on a buy signal with a potential target at the Cycle Top resistance at 127.88. The Cycles Model suggests a continued rally through mid-April.
(ZeroHedge) Following the violent plunge in yields earlier this week and especially on Tuesday night into Wednesday morning, Nomura's Charlie McElligott summarized the recent rates action as "Scary Hours" in a bond market rocked by "Crazy, Panicky" moves. This full-blown capitulation by bond shorts, prompted by market expectations of not one but two rate cuts in the coming year, caught many by surprise and resulted in massive losses for any last traces of the "reflation" trade.
Looking at today's market action, this "breakdown in rates and equities" appears to have fizzled for now, and we are finally seeing some tactical selling in the front-end "downside" - especially after yesterday's widely discussed $40 million "EDZ9 put condor trade" leading McElligott to suggest that the front-end move has finally “overshot,” in conjunction with reversals in swap spreads, as the forced convexity hedgers look to be adjusted for now, potentially moderating the key driver of the multi-day panicky Rates move.
The euro eases lower
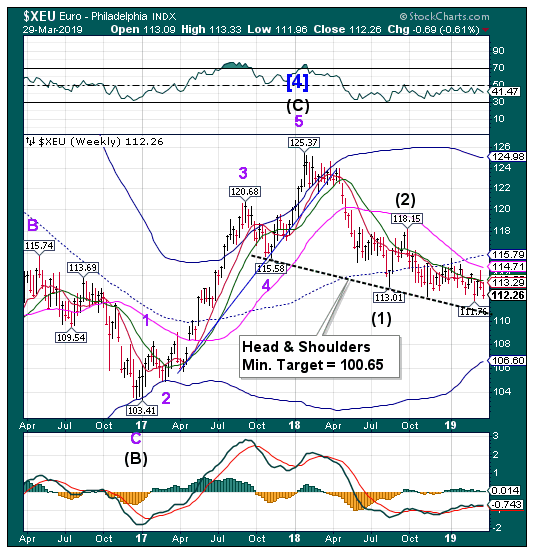
The euro may be reaching its breaking point with the Head & Shoulders formation near 110.00 that suggests a downside target that may be attained in the next month.
(Bloomberg) Economic confidence in the euro area sank for a ninth month in March, suggesting the region’s slowdown hasn’t yet bottomed out.
Sentiment soured markedly in industry, and sharp drops in Italy and Germany highlight the precarious situation in two of the region’s largest economies. With the former in recession and the latter narrowly avoiding one, the European Central Bank cut its euro-area growth outlook this month and repeated a warning about downside risks.
The European Commission’s headline index, which assesses the mood of households and businesses, fell more than economists expected and is now at its lowest level in more than two years.
Euro Stoxx challenges long-term support
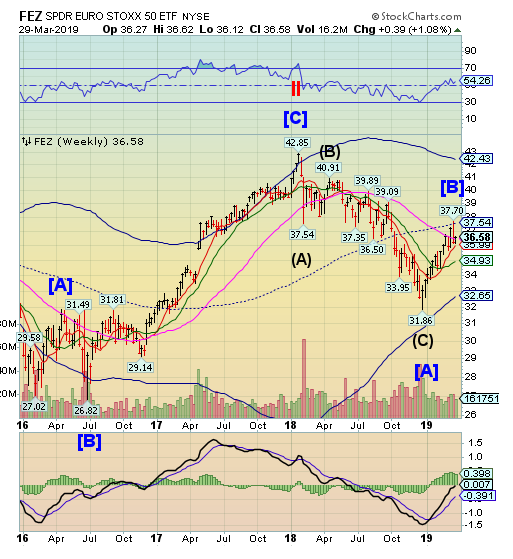
Note: StockCharts.com is not displaying the Euro Stoxx 50 Index at this time.
The Euro Stoxx50 SPDR was rejected last week at mid-Cycle resistance at 37.54. This week it challenged Long-term support at 36.40, closing above it. The Cycles Model suggests more than a month of decline may lie ahead.
(CNBC) The pan-European Stoxx 600 index closed provisionally 0.56 percent higher on the last trading session of the month. For the week, the index of European blue chip stocks finished 0.78 percent higher.
May’s draft proposal to leave the EU, which has been signed off by EU officials in Brussels, was beaten by 344 votes to 286, a margin of 58 votes. Friday’s vote was considered slightly different as it only covered the “withdrawal deal” — a near 600-page treaty that agreed citizen’s rights after Brexit, a £39 billion ($51 billion) divorce deal and how to treat the Irish land border.
The yen closed at mid-cycle
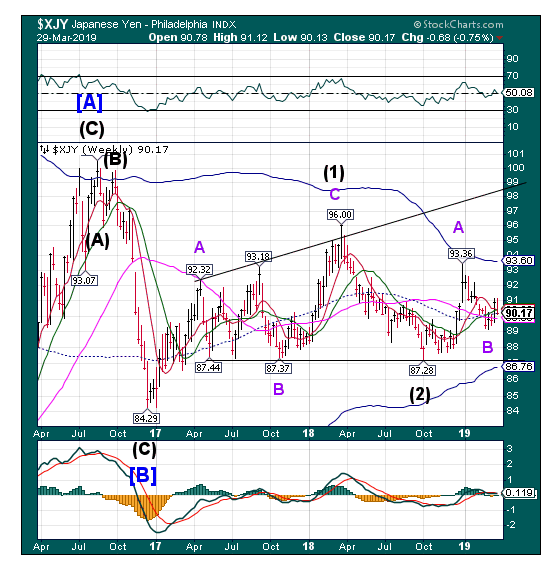
After probing above resistance, the yen appears to have closed at mid-Cycle support/resistance. It remained above Long-term support at 89.85. However, it may be due for a Master Cycle low next week. It is possible that the lower trendline may be tested again.
(BloombergVideo) UBS Wealth Has ‘Very Bullish’ Call on Yen, Tan Says
Nikkei declines beneath mid-cycle support
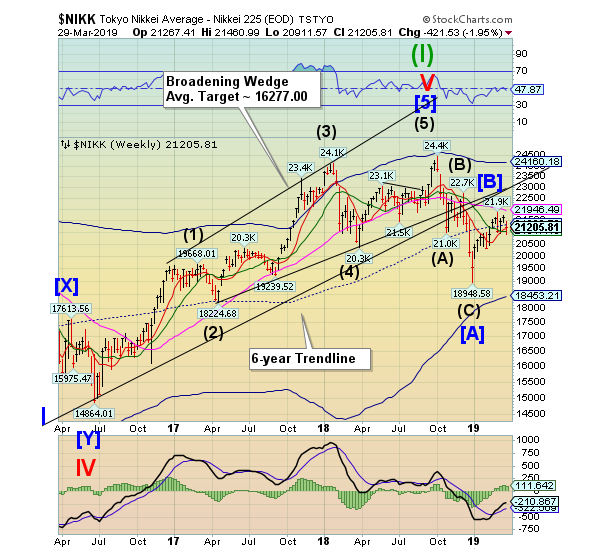
The Nikkei lost its perch above mid-Cycle support, testing Intermediate-term support at 21017.18 and closing above it. The Nikkei is on a sell signal beneath Intermediate-term support.
(Reuters) - Japan’s Nikkei rose on Friday on optimism about the latest round of U.S.-China trade talks, with cyclical sectors such as shipping and machinery advancing on the last day of the Japanese fiscal year.
Daiichi Sankyo Co grabbed the spotlight with a 16 percent jump to a daily-limit and record high of 5,100 yen. The drugmaker is joining forces with AstraZeneca Plc to develop and sell a Daiichi cancer drug.
The Nikkei share average rose 0.82 percent to 21,205.81. It fell 0.8 percent for the month, but gained 6.0 percent for the quarter.
U.S. dollar retraces 70% of its losses
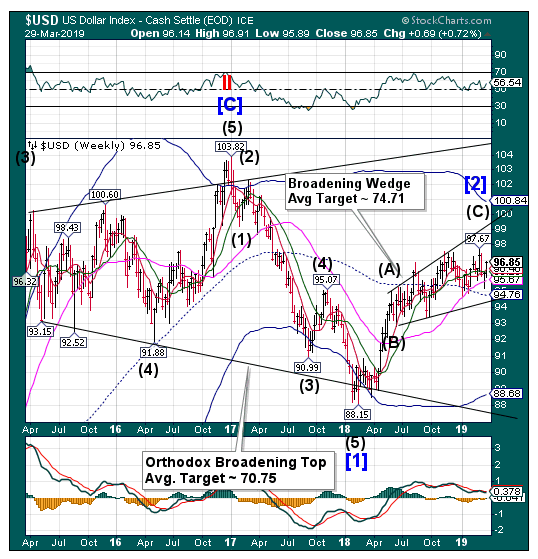
USD continued its rally, retracing nearly 70% of its recent decline. The short-term strength may be exhausted by the weekend. Once back beneath Intermediate-term support/resistance at 96.23, it may confirm the sell signal.
(Reuters) - The U.S. dollar’s share of currency reserves reported to the International Monetary Fund fell in the fourth quarter, down for the third straight quarter, while the euro’s share of reserves grew to the largest in four years, data released on Friday showed.
Reserves held in U.S. dollars fell to $6.62 trillion, or 61.69 percent of allocated reserves, in the fourth quarter, from $6.63 trillion, or 61.94 percent, in the third quarter.
Total allocated reserves increased to $10.73 trillion in the third quarter from $10.71 trillion in the previous quarter.
Global reserves are assets of central banks held in different currencies, primarily used to support their liabilities. Central banks sometimes use reserves to help support their respective currencies.
Gold reversed at the trendline
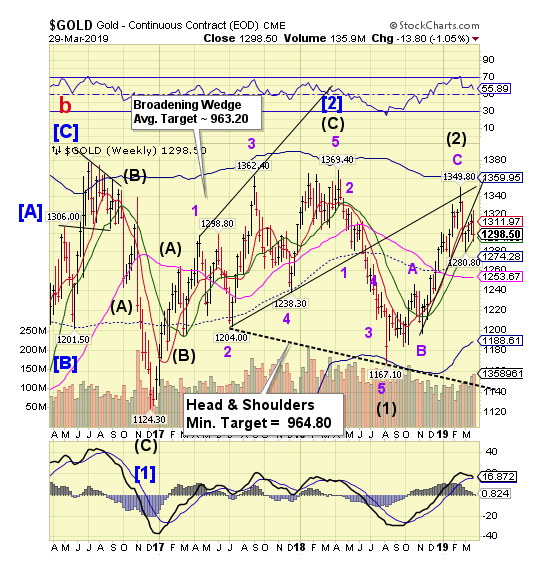
Gold tested the rising trendline but reversed to challenge Intermediate-term support at 1294.05, closing above it. The Cycles Model suggests there may be a probable month of decline ahead. The Head & Shoulders formation matches targets with the already existent Broadening Wedge formation.
(CNBC) Gold gained on Friday en route to its second quarterly rise as the dollar eased on tepid U.S. economic data, while palladium snapped three straight sessions of sharp losses, ending the quarter on a positive note.
Spot gold was up 0.20 percent at $1,292.67 per ounce as of 3:00 p.m. EST. Prices struggled to break past resistance around $1,300 per ounce, a level it had fallen through on Thursday, with momentum capped by rising global equities settled 0.2 percent higher at $1,298.50 per ounce. “The dollar is pulling back a little bit,” said Josh Graves, senior commodities strategist at RJO Futures in Chicago. “Personal spending has declined, so investors are looking to place money in more safe-haven assets, like gold.”
Crude finished the biggest quarterly gain in a decade
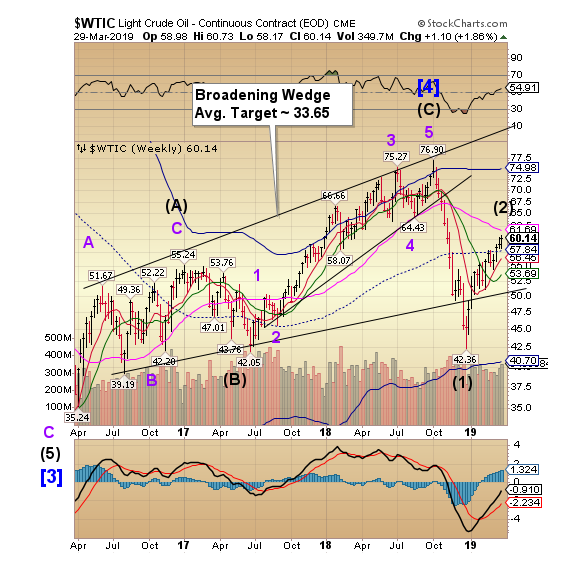
Crude made a new retracement high on Friday as it capped off the best quarterly performance since 2009. However, the Cycles Model suggests this is a bear market rally that may give back all the gains of the last three years. A reversal may be imminent.
(CNBC) Oil prices rose on Friday, on track for their biggest quarterly rise in a decade, as U.S. sanctions against Iran and Venezuela, as well as OPEC-led supply cuts, overshadowed concerns over a slowing global economy.
The rebound comes after a swift and punishing collapse in oil prices during the final quarter of 2018.
crude futures settled 84 cents higher at $60.14 per barrel, up 1.4 percent on the day. WTI earlier touched $60.73, its highest level since Nov. 12.
WTI futures rose for a fourth straight week and surged 32 percent in the first three months of the year.
Shanghai Index wavers at mid-cycle support/resistance
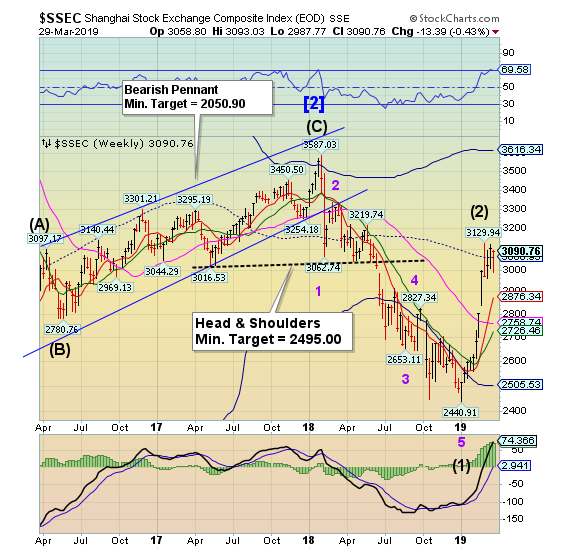
The Shanghai Index continues to waver at mid-Cycle support/resistance at 3060.93, suggesting the rally may be over. Potential strength appears to be ending this weekend. A decline back beneath 3000.00 may give a sell signal that may last two months.
(Reuters) - China stock closed higher on Friday to clock the third straight month of gains, as investors cheered Beijing’s pledge to further liberalize financial markets, and on renewed hopes of progress in U.S.-China trade talks.
** The blue-chip CSI300 index ended up 3.9 percent to 3,872.34 points, while the Shanghai Composite Index closed up 3.2 percent at 3,090.76 points.
** For the week, CSI300 edged up 1 percent, SSEC slipped 0.4 percent.
** For the month, CSI300 was up 5.5 percent, while SSEC gained 5.1 percent, both posting their third month of rises in a row.
** China will sharply expand market access for foreign banks and securities and insurance companies, especially in its financial services sector, Premier Li Keqiang said on Thursday, as senior U.S. officials arrived in Beijing for more trade talks.
The Banking Index bounces but meets resistance
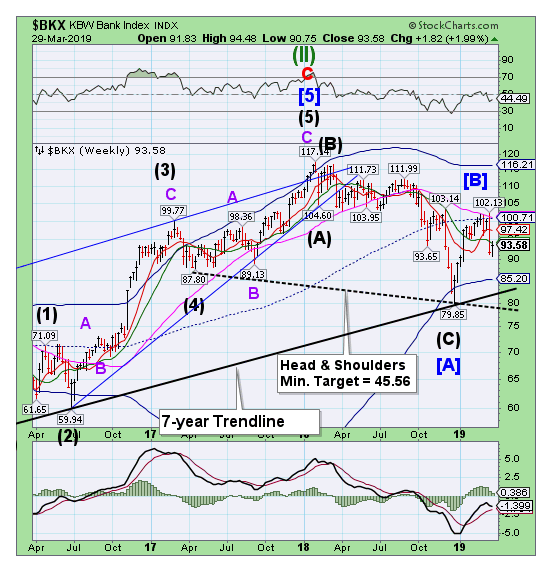
BKX attempted an oversold rally after last week’s 11% decline, challenging Intermediate-term resistance at 94.15, but closing beneath it. The Cycles Model suggests a probable decline may last up to 6 weeks.
(Reuters) Banks are cutting Collateralized Loan Obligation (CLO) issuance forecasts after spreads on the most senior tranches of the funds hit a more than two-year high, challenging the creation of new deals.
Barclays (LON:BARC) last week cut its forecast for US CLO refinancings and resets to US$40bn-US$55bn from US$95bn-US$110bn, while Wells Fargo (NYSE:WFC) this week revised its CLO forecast for refinancings and resets to US$45bn from US$100bn, according to research reports.
US CLO issuance this year has been challenged as spreads on Triple A tranches, the largest and most senior piece of the funds, have continued to widen after a record US$128.1bn of US CLOs was arranged in 2018, overheating the market. A pullback by some investors as the Federal Reserve (Fed) stopped raising rates has also weighed on the asset class.
(Reuters) - China’s two largest state-controlled banks warned bad loans could rise and interest margins would shrink, as they posted their weakest quarterly profit growth in more than two years.
Top lender Industrial and Commercial Bank of China (ICBC) reported flat net profit of 58.05 billion yuan ($8.63 billion) for the fourth quarter, the first time it has seen no growth in a quarter since the July-September 2016 quarter.
And China Construction Bank Corp , the country’s second-largest lender, posted on Wednesday a 1 percent drop in net profit, its first quarterly decline since the October-December 2015 quarter.
(ZeroHedge) Zerohedge readers who follow our monthly consumer credit updates already knew, aggregate household debt balances jumped in 4Q18. As of late December, total household indebtedness was at a staggering $13.54 trillion, $32 billion higher than 3Q18.
More troubling is that 37 million Americans had a 90-day delinquent strike added to their credit report last quarter, an increase of two million from the fourth quarter of 2017. These 37 million delinquent accounts held roughly $68 billion in debt, or roughly the market cap of BlackRock (NYSE:BLK), Inc.
New evidence this week points to a further deterioration in consumer creditworthiness.
Disclaimer:
Nothing in this email should be construed as a personal recommendation to buy, hold or sell short any security. The Practical Investor, LLC (TPI) may provide a status report of certain indexes or their proxies using a proprietary model. At no time shall a reader be justified in inferring that personal investment advice is intended. Investing carries certain risks of losses and leveraged products and futures may be especially volatile. Information provided by TPI is expressed in good faith but is not guaranteed. A perfect market service does not exist. Long-term success in the market demands recognition that error and uncertainty are a part of any effort to assess the probable outcome of any given investment. Please consult your financial advisor to explain all risks before making any investment decision. It is not possible to invest in any index.
The use of web-linked articles is meant to be informational in nature. It is not intended as an endorsement of their content and does not necessarily reflect the opinion of Anthony M. Cherniawski or The Practical Investor, LLC.
