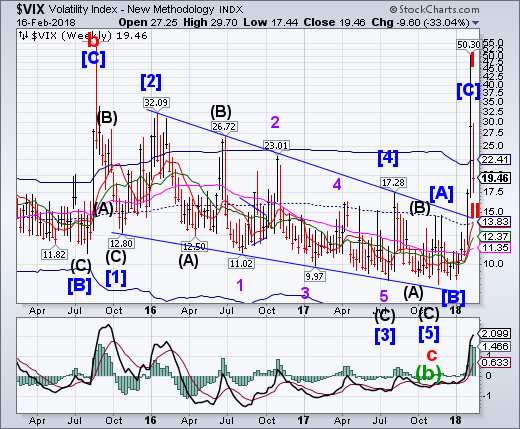
VIX made a near-Fibonacci retracement of 78.7% against the prior week high in only 5 days. It appears that those who fled the inverse VIX products of the week before may have added even more losses. Even so, the downtrend in the VIX is broken. The next Cycle Top may not occur for the next 4-6 weeks.
(Bloomberg) If you think bitcoin’s moves are extreme, look at what’s happened to the Cboe Volatility Index. The VIX’s 10-day volatility increased to a record 520 percent Wednesday as stocks rebounded for a fourth day from their plunge last week. The reading was not only the highest in the VIX’s 28-year history, but also surpassed the cryptocurrency’s peak for the past 7 1/2 years: 501 percent, set in April 2013.
SPX rockets back to the Ending Diagonal trendline.
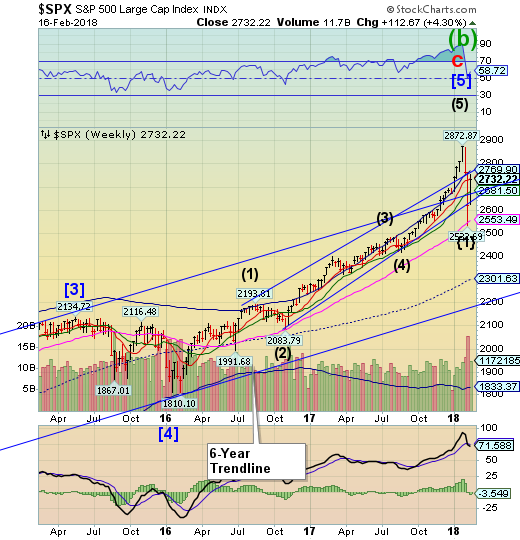
SPX launched from the lower Ending Diagonal trendline to the top trendline this week. To most investors it felt as if nothing had happened over the past 3 weeks. However, crirical supports were broken and the nature of the market is to retest them./The second retest of the lows may not be quite as succeddful..
(CNBC) Stocks closed slightly higher on Friday, extending their winning streak to six days in a row, and posted strong weekly gains.
But the major averages ended off their session highs after news broke that special counsel Robert Mueller indicted 13 Russian nationals and three Russian entities for allegedly interfering with the 2016 U.S. presidential election.
The market soon stabilized after Deputy Attorney General Rod Rosenstein emphasized in a press conference that these indictments had no allegations of willing support to the Russians by Americans. "The nature of the scheme was that the defendants took extraordinary steps to make it appear that they were ordinary American political activists," he said.
NDX rallies back to challenge its Cycle Top.
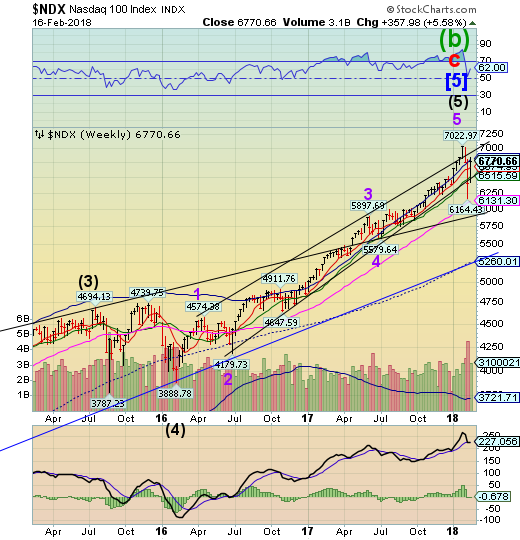
The NDX rallied back to challenge its Cycle Top at 6798.30 after finding support at the Intermediate-term level and lower Ending Diagonal trendline. Closing beneath Cycle Top resistance allow the NDX to do a retests of the lower supports. A failure here allows the NDX to decline to mid-Cycle support and the 7-year trendline at 5260.01. A breakthrough at that point suggests a further decline to the October 2011 low.
(Forbes) There's a problem lurking in the stock market known as the "risk-parity" trade.
The strategy, which involves investors switching between different assets based on changes in market volatility, has now grown so big that it threatens to sink the market.
How big? Some estimates peg the amount of money pursuing this type of strategy at as high as half a trillion dollars. Trades designed to profit from changes in volatility, which are inextricably linked to risk-parity, add as much as a further $2 trillion.
The issue is not the strategy itself, it is when investors decide that it is no longer useful and decide to exit their positions. In other words, when all at once they dump their positions the market will likely tank.
High Yield Bond Index bounces to Intermediate-term resistance.
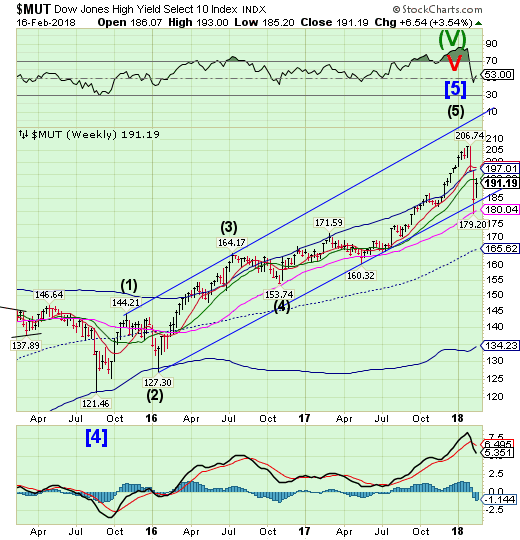
The High Yield Bond Index retraced 50% of its decline, challenging Intermediate-term resistance at 192.90, then closing beneath it.The sell signal remains and the Cycles Model suggests additional weakness going forward.
(ZeroHedge) Earlier this week, GMO's James Montier repeated verbatim one of our recurring puzzling observations about the current market: while "a recent Bank of America (NYSE:BAC) ML survey showed the highest level of those citing “excessive valuation” ever. Yet despite this, the same survey showed fund managers to still be overweight in equities." Back in August, we called this just one of the many bizarre market paradoxes observed in the market.Here is another paradox.As we noted earlier, after last week's volocaust, this week was the best week for global stocks since 2011 as traders and algos furiously BTFD (and sold vol), clearly forgetting what happens when markets become too stretched, as they are becoming again.It wasn't just stocks: junk bond yields dropped the most in three months, and CCC yields saw the biggest drop in more than five weeks yesterday amid what is reportedly buying flurry. As Bloomberg put it, "it was as if high yield investors were making up for the lost week" with HYCDX rising the most in 11 months, and junk bond ETFs, JNK and HYG, saw the biggest increase in three months.
NYSE:UST may be due for a bounce.
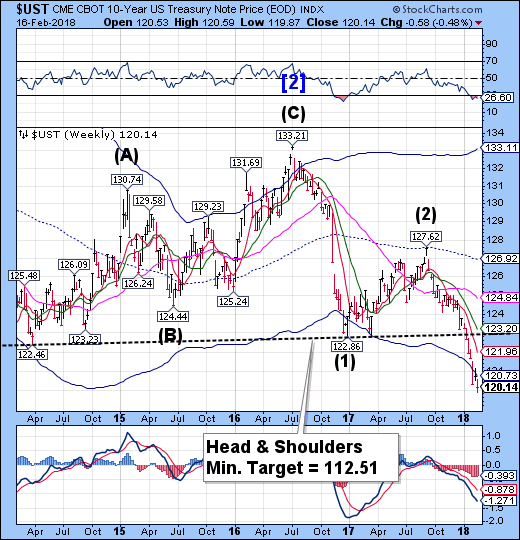
The 10-year Treasury Note Indexmay have reached a Master Cycle low on Wednesday and is due for a bounce.The target for this bounce may be a retest of the Head & Shoulders neckline near 122.50. The bounce may last 2-3 weeks.
(CNBC) U.S. government debt prices fell from recent highs Friday despite hotter-than-expected import prices and housing starts data.
In the previous trading session, U.S. government debt yields achieved new highs, with the yield on the 10-year Treasury touching 2.944 percent, a new four-year high. The 2-year Treasury yield touched its highest level since 2008 Thursday.
As of the latest reading, the yield on the benchmark 10-year Treasury note slipped to 2.871 percent at 4:31 p.m. ET, down from a 4-year high of 2.94 percent reached Thursday. The yield on the 30-year Treasury bond was also down at 3.13 percent. Bond yields move inversely to prices.
The euro rebounds off its Cycle Top.
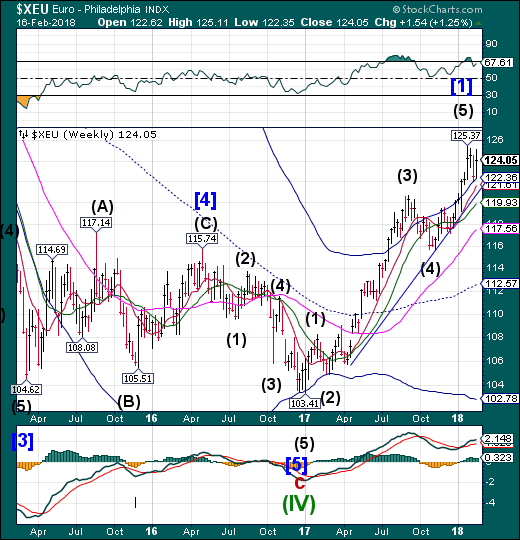
The euro bounced off its Cycle Top support in an attempt to maintain the uptrend. A decline beneath the Cycle Top suggests the rally may be over. A failure to make a new high suggests a reversal may be at hand. If so, XEU may decline to is mid-Cycle support at 112.57..
(CNBC) Mario Draghi is facing yet another headache this year as a strong currency threatens to derail his quest to keep prices stable, with many analysts suggesting there's no easy way out for the president of the European Central Bank (ECB).
Investors have been flocking to the single currency as the euro zone economy keeps growing and political risks dissipate. However, that could become a problem for the European Central Bank as a stronger currency can mean that European-produced products become pricier and less attractive outside the region. The euro has risen nearly 3 percent against the U.S. dollar since the start of the year, at a time when the ECB has been assessing how to reduce its monetary stimulus — which aims to increase lending and stoke consumer prices.
Euro Stoxx may have found support near the mid-Cycle level.
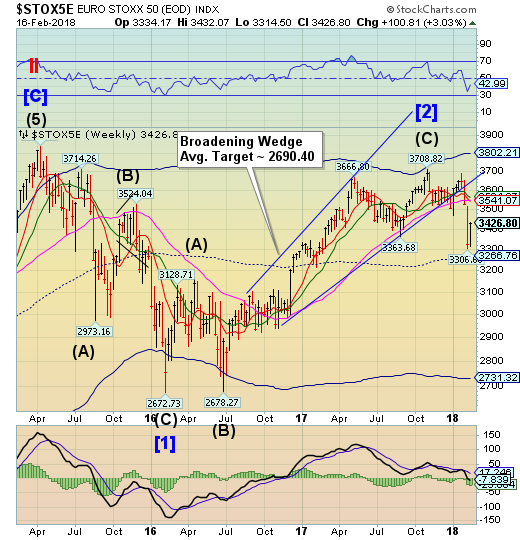
The Euro Stoxx 50 Index may have been oversold enough to bounce before testing the mid-Cycle support this week.It made a 33% retracement of its recent decline. While there may be some residual bounce early next week, the Cycles Model suggests the decline may resume through late March.
(CNBC) European stocks closed provisionally higher Friday, as investor confidence appeared to take hold after a sharp sell-off earlier this month..
The pan-European Stoxx 600 closed provisionally up almost 1.1 percent, with almost all sectors and major bourses in positive territory.
Vopak was the top performer Friday after its latest figures beat market expectations. The Dutch oil and chemical company said full-year results were lifted by a stronger-than-anticipated performance in the final three months of the year. Its shares were 13.7 percent higher.
The yen breaks above its consolidation range.
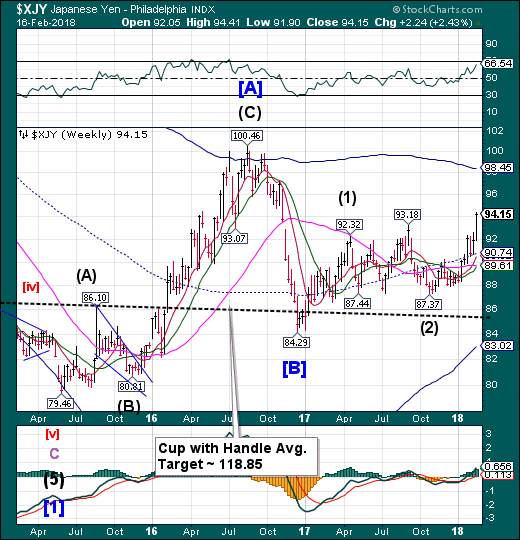
The yen broke above its year-long consolidation range as it probes new highs. The Cycles Model suggests a possible brief consolidation, but the trend is solidly higher through early March.
(NikkeiAsianReview) Exchange rates hold less sway over corporate earnings in Japan nowadays, but the yen's recent strength could still take the shine off Japanese companies' bumper earnings.
Although much of corporate Japan forecasts brisk results for the year ending March, a stronger yen would erase some of their profits. The average assumed exchange rate for the January-March quarter stands at 109.50 yen per dollar for companies that close their books at the end of March. At 106.19 yen as of early Saturday, the Japanese currency is now considerably stronger than that assumed rate.
Nikkei bounces at Long-term support.
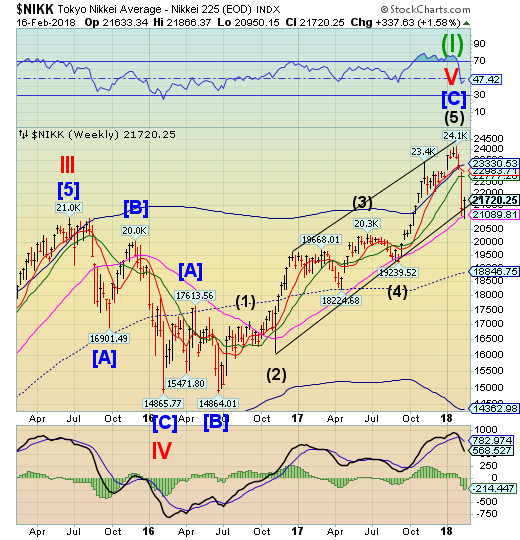
The Nikkei challenged Long-term support at 21089.81, then bounced to retrace 28% if its decline. Cyclical strength appears to have dissipated quickly as a major low may be due in about two weeks. Supports have been violated and are due to be retested.
(Bloomberg) For many years, Japanese stocks moved in tandem with the yen. When the currency weakened, they tended to rise.
Last year, that relationship started to break down. The benchmark Topix index surged 20 percent even as the yen strengthened almost 4 percent against the dollar.
But recently, the negative correlation has started to come back, with the Topix and Nikkei 225 Stock Average failing to join global stocks’ rebound from their selloff, primarily because the yen jumped. All this means that some of the world’s biggest money managers disagree about the connection and how you should invest because of it.
US dollar makes a marginal new low
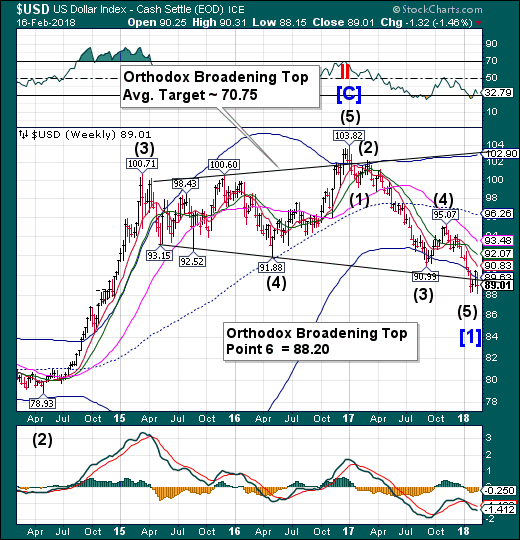
USD made a marginal new low on Friday morning before closing higher for the day. The Cycles Model indicates a probable rally over the next 2-3 weeks. There is a Broadening Top “Point 7” target near the weekly mid-Cycle resistance at 96.26.
((ZeroHedge) Earlier this week, the bizarre, unexplainable, ongoing plunge in the dollar and US bond prices in the aftermath of the stronger than expected CPI print which also sent equities surging, prompted at least one trader at Citi to explode: "Wake Up Folks, It's Not Risk Positive"
Then again, maybe it is not all that unexplainable.
As Deutsche's FX strategist, George Saravelos, writes, he has been getting numerous inquiries as to how can it be that US yields are rising sharply, yet the dollar is so weak at the same time?
He believes the answer is simple: the dollar is not going down despite higher yields but because of them. Higher yields mean lower bond prices and US bonds are lower because investors don't want to buy them, or as he puts it "this is an entirely different regime to previous years."
Below we repost his simple explanation, while highlighting that maybe.
... just maybe, the bottom for the dollar is now in?
Gold nearly makes a full retracement.
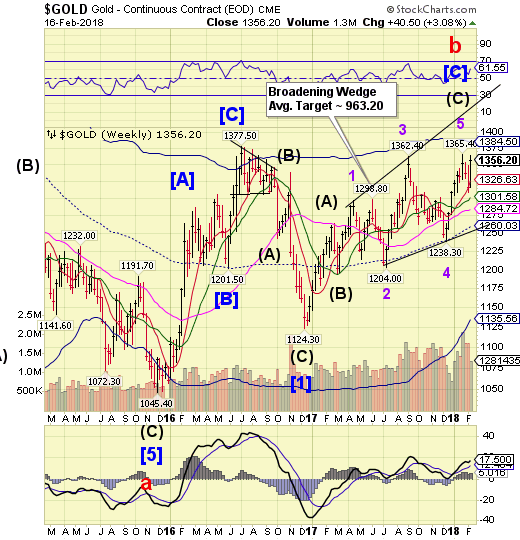
Gold missed making a full retracement of its decline by one point. While the gap may be closed on Monday, the Cycles Model suggests that any residual strength may have ended on Friday. If so, the proposed target appears to be the lower trendline of the Broadening Wedge formation near 1260.00
(CNBC) One of the market's oldest inflation hedges appears to be in the early stages of a comeback: gold.
As a decade of extraordinary policy unwinds at the Federal Reserve, the yellow metal may appear as an attractive option for investors looking to protect themselves from the eroding effects of inflation.
"We think that it is a good time to own the precious metals," said Chris Gaffney, president of EverBank World Markets. "We are seeing a burgeoning middle class and more disposable income in India and China, which should lead to more physical demand."
Crude bounces to Short-term resistance.
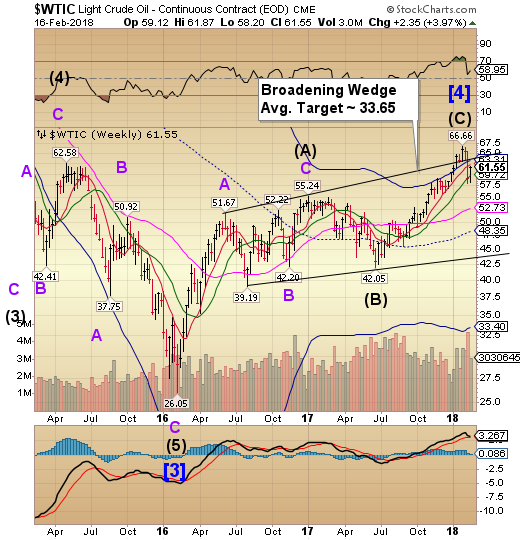
Crude managed a bounce from weekly Intermediate-term support at 59.72 to challenge Short-term resistance at 62.25. It retraced 44% of the decline. However, a deeper decline may trigger the Broadening Wedge formation with a much lower target.
(Bloomberg) Oil posted its first weekly increase since last month as rebounding equity markets eased concern about economic growth and a weakening dollar boosted the allure of commodities priced in the U.S. currency.
Futures in New York rose 0.6 percent on Friday and gained 4.2 percent this week. The greenback touched a three-year low earlier in the day before edging higher, though the increase wasn’t enough to wipe out the previous four days’ losses. Equity markets recovering from recent routs boosted confidence in bullish energy demand forecasts.
“Oil prices were strong because the stock market stabilized,” said Phil Flynn, senior market analyst at Price Futures Group. “As long as we are going to see stock market stability, oil prices are going to look pretty good.”
Shanghai Index bounces to retest the trendline.
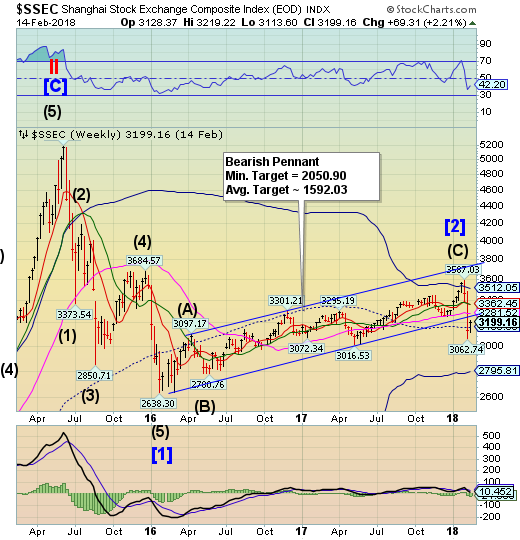
The Shanghai Index bounced above mid-Cycle support at 3153.93 in an attempt at a retest of the Pennant trendline. The sell signalmay be temporarily suspended until the retest is complete. The bounce may be over early next week with significant new lows anticipated in early March. The immediate target may be beneath the Cycle Bottom at 2795.81.
(ZeroHedge) In late 2015, the Chinese government formally changed its 3+ decade "one child" policy to allow married couples in China to have two children. The Chinese government and many pundits anticipated a subsequent "baby boom".
This policy change came after the Chinese child bearing population (those aged 15-40, which peaked in 2005 at 580 million) had already declined by over 80 million (a 16% decline). Regardless the impact of the change in policy, China's child bearing population will fall another 15% over the next 15 years before any possible uptick from the policy change could begin to show up in the child bearing cohort.
The Banking Index challenges the Cyce Top.
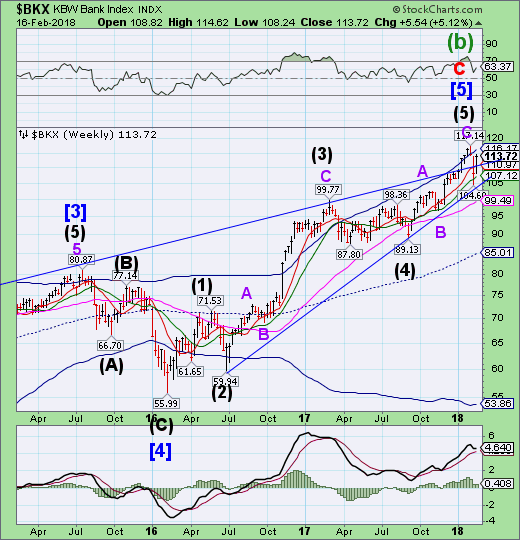
--BKX used Intermediate-term support at 107.12 as support to challenge the Cycle Top at 116.17, but closing beneath it. A retest of that support may give a sell signal while a further decline beneath the lower trendline of the Ending Diagonal confirms it. A break of the trendline implies a target near the February 2016 low.
(CNBC) Investors are gravitating toward a new favorite part of the stock market, which seems to have just about everything going for it right now: banks.
The sector is nipping on the heels of the technology sector, which has been the best performer since the 2016 presidential election, as investors bet that higher rates, lower taxes, deregulation— not to mention a return to market volatility favorable for investment banks — will keep lifting the industry's profits.
We've been increasing our weight in financials and banks for several reasons: The banks have repaired their balance sheets; financials are trading at attractive valuations; we still think banks are underowned since the financial crisis, they'll benefit from deregulation; and interest rates are going up," said Ernie Cecilia, CIO at Bryn Mawr Trust.
(Forbes) There’s no requirement for banks and other financial companies to tell customers their information has been hacked in the draft of a new data breach notification bill in Congress.
Instead, large operations including merchants, telecom companies and some non-profits would be the only operations mandated to notify consumers “immediately without unreasonable delay” when crooks have obtained their name along with a Social Security number or a financial account number in a hack.
“I hate it,” said U.S. PIRG Consumer Program Director Ed Mierzwinski said today.He said one gaping hole is Equifax (NYSE:EFX) and other credit bureaus would be exempted.
