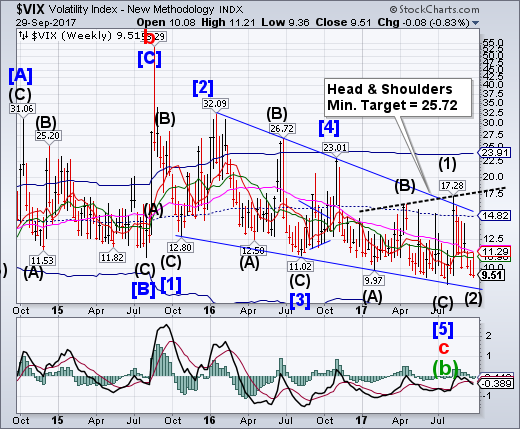
VIX extended its corrective decline with a low at 9.36 this week. It is beneath all technical supports and must rise above its Intermediate-term resistance at 10.90 for a buy signal, with further confirmation above weekly mid-Cycle resistance at 14.82. It has an inverted Head & Shoulders formation thar, when triggered, gives us a potential target for the next rally.
(ZeroHedge) Earlier this week, in the latest observations of broad market complacency, we pointed out that the VIX has remained heavily subdued in September - a month when volatility usually picks up - shrugging off rising geopolitical tension with North Korea, several destructive storms, and the Fed’s plan to normalize its balance sheet, while defying seasonal trends. As of Tuesday, the average VIX close in September month-to-date was just 10.60, which is the lowest average September on record. Since then, the VIX has declined even further.
S&P 500 rally pattern may be complete.
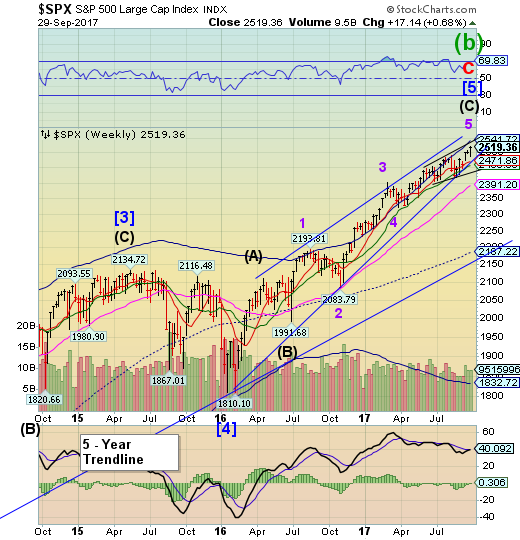
SPX rallied to complete the final probe and meet its target of 2420.00-2425.00. In addition, this weekend is an important long-term Cycle pivot in equities.The DJIA had already reached its Cycle Pivot on September 21 and hasn’t broken above that high. If so, next week may start the decline.
(ZeroHedge) While 'hope'-strewn survey data are staging a self-reinforcing resurgence in the last week or two, 'hard' economic data (that doesn't rely on the emotional responses of humans) has collapsed to its weakest since Feb 2009.
This is the 6th monthly drop in 'hard' economic data in a row, something that has never happened before, pushing the spread between 'hope' and 'reality' to a record high.
NDX rallies, but no new high.
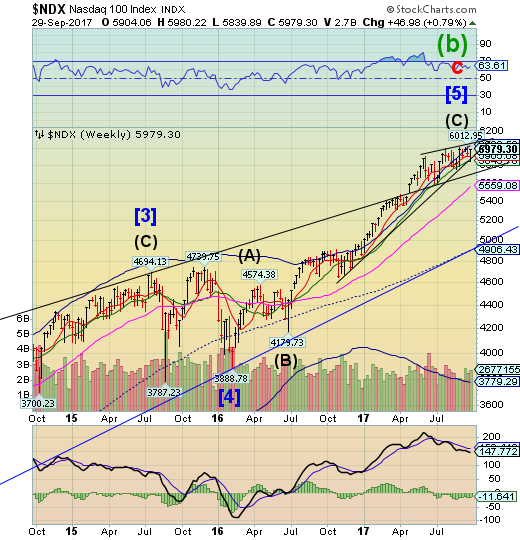
NDX also rallied this week, but did not produce a new high. The September 18 high still stands.A decline beneath Intermediate-term support at 5843.78 and its Trump election trendline may produce a sell signal.
(RealInvestmentAdvice) I expect comparisons between the FANG stocks and Dr. Evil of the Austin Powers film series to be an ongoing investment storyline over the next year given these digital gatekeepers’ increased dominance over the U.S. economy. This idea might receive a lot more play in U.S. political and antitrust circles — and produce more legal challenges — than most investors currently presume.
For those unfamiliar with Austin Powers, Mike Myers’ character Dr. Evil is a parody of the James Bond villains. He hatches schemes to take over the world with his sidekick Mini-Me and his cat Mr. Bigglesworth. He’s also assisted by Number 2 (played by Robert Wagner), who fronts for his evil corporation, Virtucon Industries. A natural businessman, Number 2 is often more concerned about the financial aspects of world domination than in world domination itself. That sounds a lot like the FANG stocks — Facebook (NASDAQ:FB), Amazon (NASDAQ:AMZN) , Netflix (NASDAQ:NFLX) and Alphabet/Alphabet Inc Class A (NASDAQ:GOOGL).
Dow Jones High Yield Select 10 consolidates under its Cycle Top.
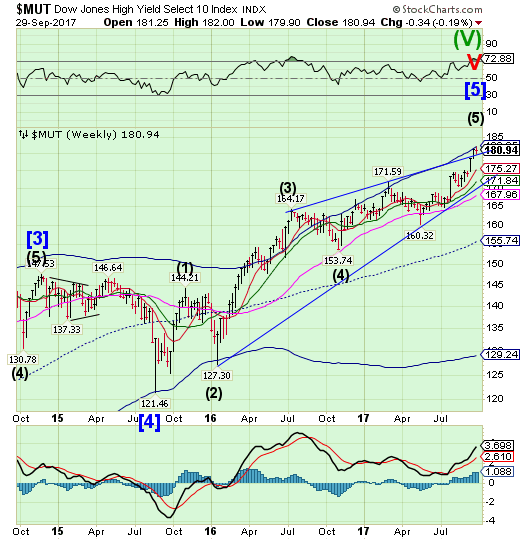
The High Yield Bond Index repelled at its Cycle Top at 182.25 but held at the upper trendline of its Ending Diagonal formation at 179.50.A break of the upper Diagonal trendline may tell us the rally is over. This is no time for complacency.
USB challenges Long-term support.
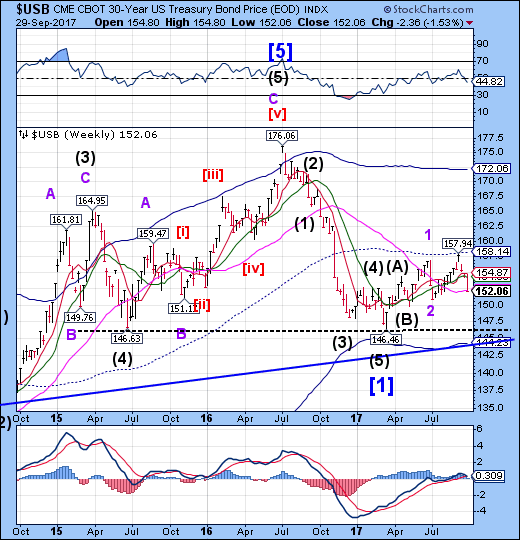
The Long Bond challenged Long-term support at 152.23 in an extended retracement decline.While it closed slightly beneath the mentioned support, the decline appears to have run its course. A resumption of the rally may be imminent.Should the right shoulder of a potential Head & Shoulders reach proportionality, the rally may go to 165.00 or possibly as far as the Cycle Top at 172.06.
(Mises) Janet Yellen this week cast doubt on the Fed's announced plan to continue Fed rate hikes and reverse its years of "unconventional" monetary policy.
“My colleagues and I may have misjudged the strength of the labor market,” Yellen announced on Tuesday, adding that they'd also misjudged "the degree to which longer-run inflation expectations are consistent with our inflation objective, or even the fundamental forces driving inflation."
Yellen also "noted that the labor market, which historically has been closely linked to inflation, may not be as tight as the low unemployment rate suggests."
The Euro on a sell signal.
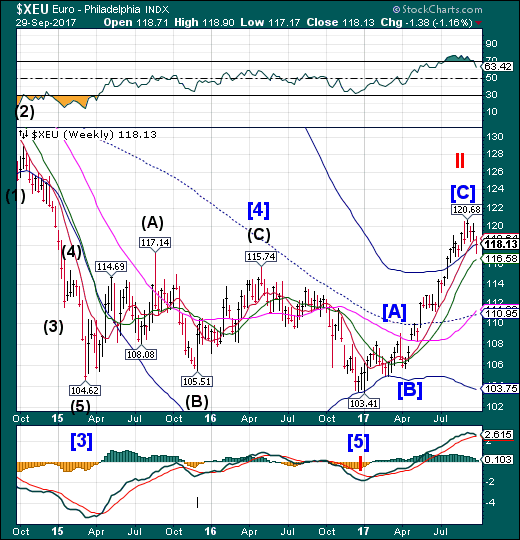
The Euro plunged through Short-term support at 118.64 and its Cycle Top at 118.14, giving a sell signal. Traders are looking for a higher Euro, but it may have reached a technical limit to this rally. However, traders are still hopeful of a further rally.
(Reuters) - Hedge funds are looking past the euro’s drop this week and remaining bullish, encouraged by an improved economy and political stabilization.
The single currency EUR= has been the standout trade in foreign exchange markets this year, climbing more than 12 percent against the dollar in 2017. Long positions in the euro are now at their greatest in five years, positioning data show.
Investors have raised their bets on expectations the European Central Bank will start unwinding its multi-year stimulus plans in the coming months.
Euro Stoxx 50 extends its retracement rally.
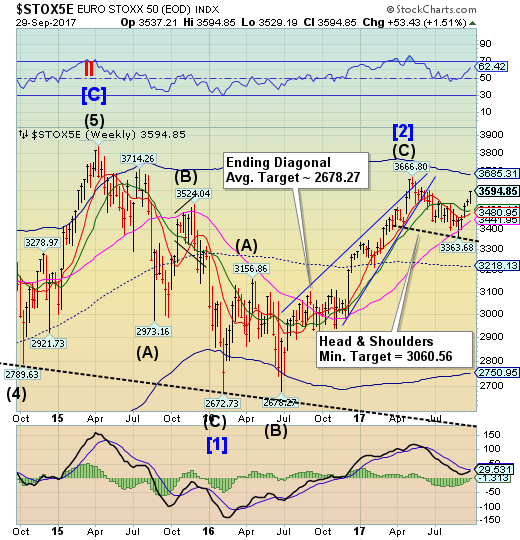
The Euro Stoxx 50 Index probed higher as it forms an oversized right shoulder of a small Head &Shoulders formation.The Cycles Model suggests that the normal period of strength may have been “brought forward” for the quarter end, leaving potential weakness ahead. A reversal has the potential to set a cascading decline into motion over the next several weeks.
(Reuters) - European shares ended with the best monthly gain this year on Friday, helped by a weakening euro, but uncertainty over the Catalan crisis weighed on Spanish stocks.
A weakening euro has taken pressure off Europe's equities and especially the exporter-heavy DAX, helping investors find renewed enthusiasm for the asset class after the slow summer months.
Both the pan-European STOXX 600 and the euro zone stocks .STOXXE ended at three-month highs, up 0.5 and 0.7 percent respectively, scoring a quarterly gain after falling back in the second quarter.
The Yen challenges Long-term support.
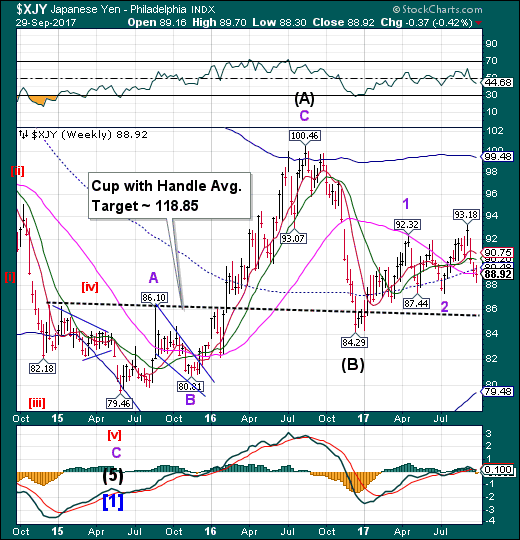
The Yen challenged Long-term support at 89.09, closing beneath it. A Master Cycle low has been extended to Friday, most likely due to quarter end. A lift above mid-cycle resistance at 89.48 puts the Yen back on a buy signal. .
(NikkeiAsianReview) The impact of Japan's upcoming election is spreading into currency markets as overseas investors question what a strong showing by Tokyo Gov. Yuriko Koike's new national party might mean for the loose monetary policy that has kept the yen weak.
The Japanese currency softened beyond 113 to the dollar Wednesday after the release of a framework for a U.S. tax overhaul, but it quickly firmed up to the 112-yen range, where it has hovered since.
A dealer at a Japanese bank reported fielding a number of inquiries from abroad over the past few days about who Koike is. Weak showings by the parties in power in French and German elections this year have foreign investors wondering whether Japan's ruling Liberal Democratic Party might fall in next month's snap election.
Nikkei 225 consolidates beneath last week’s high.
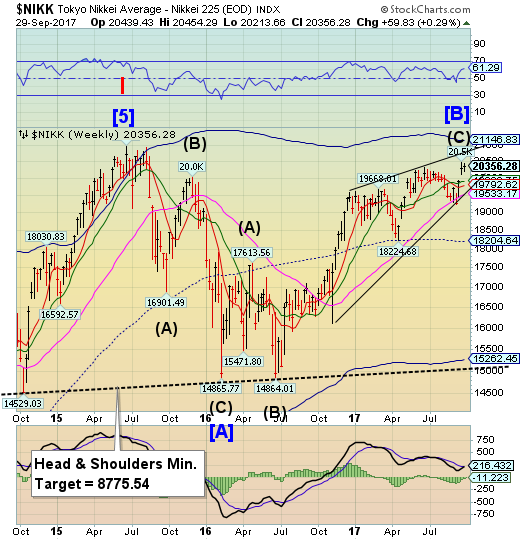
The Nikkei consolidated beneath its 2-year high this week.The Cycles Model suggests a potentially sharp decline over the next two weeks. It’s time for Intermediate Wave [C] to begin..
(EconomicTimes) Japan's Nikkei share average ended almost flat on Friday but posted its biggest monthly gain this year as investors rebuilt positions they had scaled back earlier this month on geopolitical concerns. The Nikkei was down 0.03 per cent at 20,356.28 but posted a solid 3.6 per cent rise in September, its first monthly gain in three months. The broader Topix was down 0.08 per cent on the day at 1,674.5 but ended September up 3.5 per cent.
U.S Dollar rallies Off Its Cycle Bottom
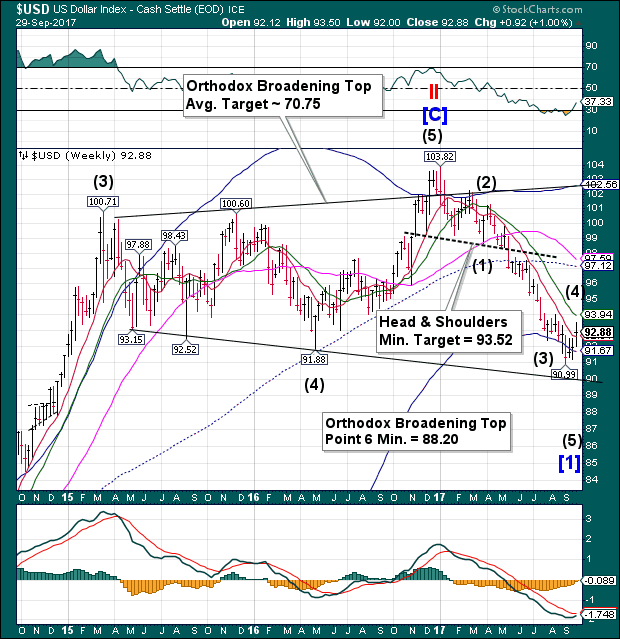
USD rallied off its Weekly Cycle Bottom support at 91.67 while completing a potential triangle formation. If correct, the Triangle increases the probability of USD continuing to its Orthodox Broadening Top short-term target at 88.20.The lower trendline of the Orthodox Broadening Top at 90.00 may be the next attractor, but the formation calls for a breakout beneath the trendline, as indicated by “point 6.” .
(BusinessInsider) The US dollar had a relatively strong September after months of declines.
"Supported by a sharp rise in interest rates and ideas of tax reform, the US dollar is closing one of its best months of the year," said Marc Chandler, global head of currency strategy at Brown Brothers Harriman, in commentary Friday.
.Gold declines to Intermediate-term support.
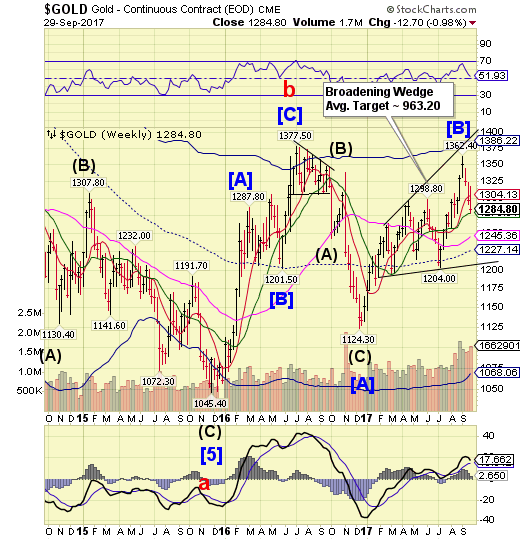
Gold declined to Intermediate-term support at 1278.31 where there normally may be a short-term bounce.However, the Cycles Model suggests the decline should remain underway through mid-October. Any conflict may be resolved in just a few days. Gold remains on a sell signal.
(Kitco) Wall Street is retaining a bullish tilt on gold prices for the short term, while Main Street is bearish, according to the weekly Kitco News gold survey.
The views of traders and analysts who take part in the Wall Street survey tended to reflect their opinions on what will happen to the U.S. dollar. Those who see the dollar losing some of its recent upward momentum were bullish on gold, and vice-versa. The greenback has been bolstered lately largely on the back of hawkish commentary from Federal Reserve officials, who once again have financial markets factoring in another rate hike in December.
Fifteen market professionals took part in the Wall Street survey. Eight participants, or 53%, look for gold to be higher next week. Six, or 40%, called for lower, while one, or 7%, sees sideways prices ahead.
Crude extends its rally.
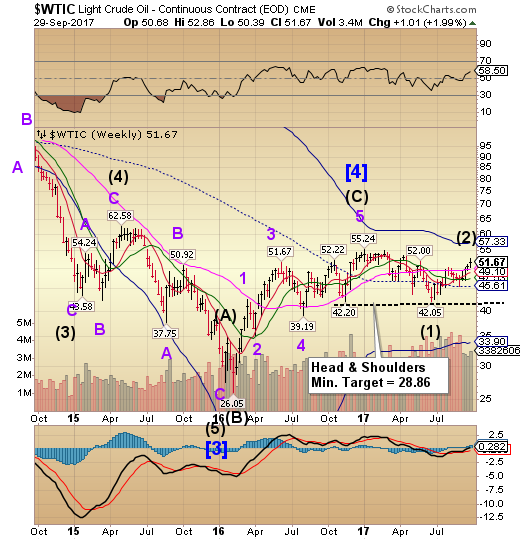
Crude extended its retracement through Thursday, ostensibly tor meet quarter-end window dressing. The final bit of Cyclical strength extended beyond last week, but now appears to be over.The sell signal may potentially be in play with confirmation beneath Short-term support at 49.10.
(OilPrice) Last Friday we argued that the rally in WTI and Brent looked overstretched from technical and positioning viewpoints. This week obviously didn’t serve our viewpoint as geopolitical tensions in Iraq alongside bullish long-term calls from Citi and the trading group community- particularly Trafigura- at APPEC pushed the market slightly higher. There are undeniably glut-clearing trends at work in the U.S. and abroad but we continue to feel that crude oil has risen too far, too fast and positioned for length-liquidation on any fundamental speed bumps as WTI’s 14-day RSI touched 70 this week while RBOB + Heating Oil net length held by hedge funds reached 2.5 standard deviations above its 2yr average.
Shanghai Composite eases lower.
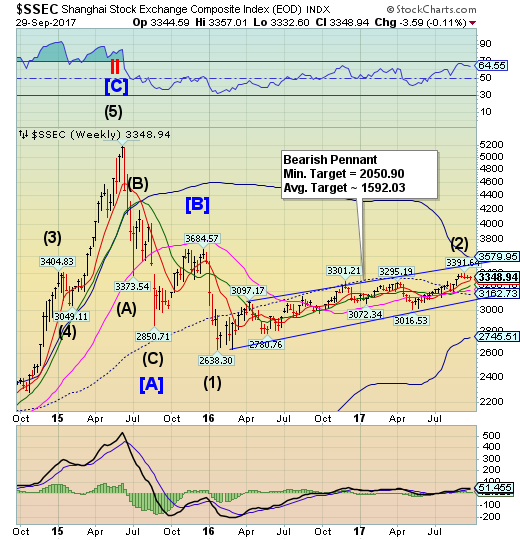
The Shanghai Index continued to ease down in a consolidation that may produce a final probe higher.The chances of an inversion into the first week of October are quite high.Although this may be the negative season for Chinese stocks, there are political reasons for a short-term boost in prices. However, the potential for a sharp sell-off is rising.
(ZeroHedge) In the latest sign that China is moving to dramatically limit its exposure to its restive neighbor and long-time economic dependent, Chinese authorities on Thursday ordered all North Korean firms to stop doing business in the world's second-largest economy, fulfilling Beijing's obligations according to the latest round of UN Security Council sanctions, which were passed two weeks ago.
The order comes just days after President Donald Trump revealed that the People’s Bank of China had asked the country’s banks to sever their business ties with North Korea.
The Banking Index extends its retracement.
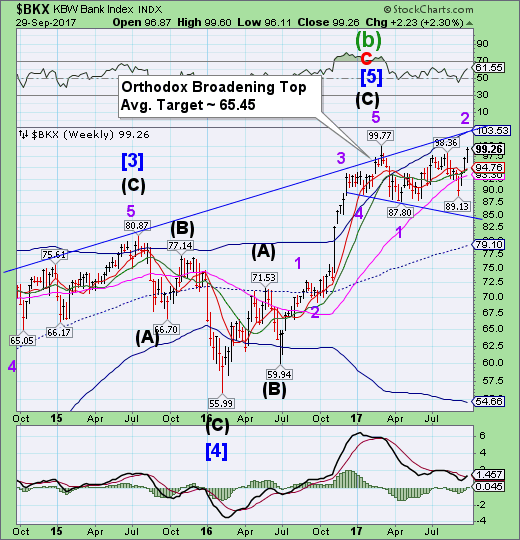
--BKX extended its retracement another week, but did not make a new high. It remains on aprovisional sell signal beneath Intermediate-term support at 94.76. If the Orthodox Broadening Top formation is correctly identified, the next level of support may be the mid-cycle line at 79.10.
(Bloomberg) China’s central bank said it will reduce the amount of cash lenders must hold as reserves from next year, with the size of the cut linked to the flow of funding to parts of the economy where credit is scarce.
The targeted measures apply to all major banks, 90 percent of city commercial banks, and 95 percent of rural commercial lenders, the People’s Bank of China said in a statement late Saturday. Cuts will range from 0.5 percentage point to 1.5 percentage point depending on how much business banks do with small enterprises, agricultural borrowers and startups. Foreign banks will also be eligible for the cut should they meet the requirements.
(Bloomberg) As market-moving updates go, the Fitch Ratings downgrade of Deutsche Bank AG (DE:DBKGn) debt had little new to tell long-suffering investors in Germany's No. 1 lender. Shares and bonds fell only slightly, a reflection of how cheap central bank funding and better finances have masked investor fears about euro zone banks.
Nevertheless, it's a stark reminder to politicians and regulators trying to fix Germany's over-banked economy that all is not well.
Deutsche is struggling with a business model overwhelmingly exposed to balance sheet-heavy fixed income trading and investment banking, which isn't the money-spinner it was after a decade of cheap money and tight regulation. CEO John Cryan has bolstered finances and promised a leaner, more diversified bank. It will be a slog getting there with no revenue rebound in sight, as record low interest rates squeeze lending margins.
(ZeroHedge) The lack of prosecution of US bankers responsible for the great financial crisis has been a much debated topic over the years, leading to the coinage of such terms as "Too Big To Prosecute", the termination of at least one corrupt DOJ official, the revelation that Eric Holder is the most useless Attorney General in history, and of course billions in cash kickbacks between Wall Street and D.C. And, naturally, the lack of incentives that punish cheating and fraud, is one of the main reasons why such fraud will not only continue but get bigger until once again, the entire system crashes under the weight of accumulated theft, corruption and Fed-driven malinvestment. But what can be done? In this case, Vietnam may have just shown the way - sentence embezzling bankers to death. Because if one wants to promptly stop an end to all financial crime, few things motivate as efficiently as a firing squad.
(Bloomberg) The six largest U.S. banks could see net income rise $6.4 billion, or 7 percent, if President Donald Trump and Republicans in Congress can push through their proposed corporate tax rate cut.
Banks stand to benefit more than other industries because they typically have fewer deductions. The top six firms -- JPMorgan Chase & Co (NYSE:JPM)., Bank of America Corp (NYSE:BAC)., Wells Fargo (NYSE:WFC) & Co., Citigroup Inc (NYSE:C)., Goldman Sachs Group Inc (NYSE:GS). and Morgan Stanley (NYSE:MS) -- paid an average of 26 percent in federal taxes last year, almost twice the average for nonfinancial companies, according to data compiled by Bloomberg. The Republican framework released Wednesday calls for lowering the corporate rate to 20 percent from 35 percent.
