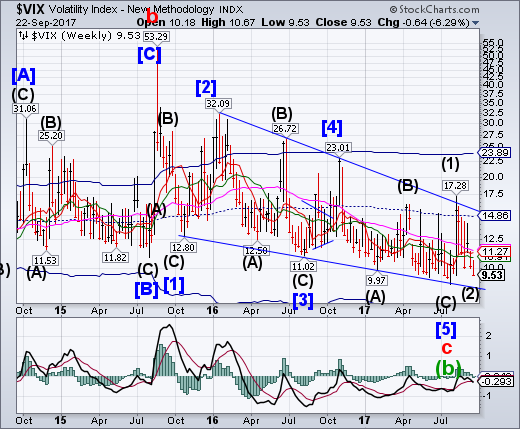
VIX took another week to complete its corrective decline with a low at 9.53 this week. It is beneath all technical supports and must rise above its Intermediate-term resistance at 10.91 for a buy signal, with further confirmation above weekly mid-Cycle resistance at 14.86and the Ending Diagonal trendline near 15.00.
Making bets on volatility has never been more popular.
Nor has it been riskier.
For signs that investors are hungry to wager on future price swings, look no further than the cottage industry that's popped up around the CBOE Volatility Index, or VIX. Their preferred vehicles are a series of exchange-traded products linked to the so-called "fear gauge" that have shares outstanding at or near record highs.
SPX makes a nominal new high.
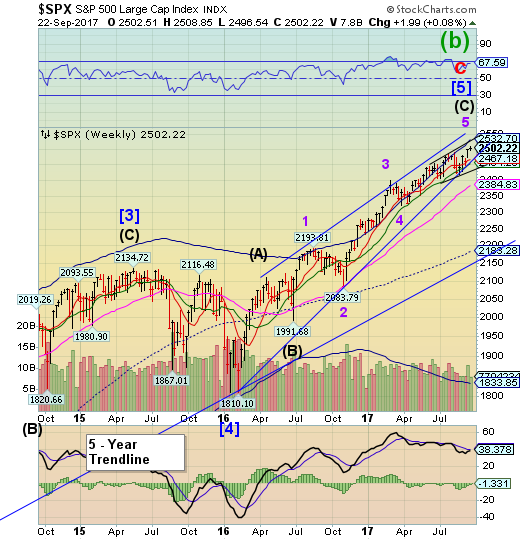
SPX consolidated for the duration of the week, making its gain in the final hour. Another all-time high was made. A reason for the sideways consolidation may be a micro-degree Triangle formation. If so, a final high may be made early next week.
The U.S. stock market today is characterized by a seemingly unusual combination of very high valuations, following a period of strong earnings growth, and very low volatility.
What do these ostensibly conflicting messages imply about the likelihood that the United States is headed toward a bear market in stocks SPX, +0.06% ?
To answer that question, we must look to past bear markets. And that requires us to define precisely what a bear market entails. The media nowadays delineate a “classic” or “traditional” bear market as a 20% decline in stock prices.
NDX posts a weekly loss.
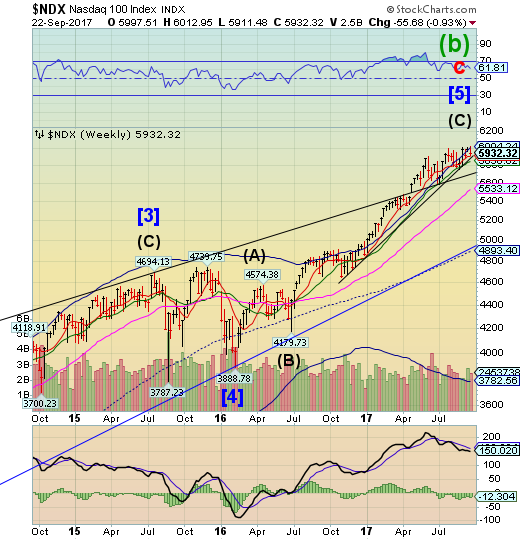
NDX made a new high on Monday, then declined the balance of the week, posting a modest loss. It did not break either Short-term support at 9897.26 or the trendline. A decline beneath Intermediate-term support at 5838.02 and its Trump election trendline may produce a sell signal.
The tech scare, which hit earlier this summer, is long forgotten and clearly over because according to the latest EPFR data compiled by Bank of America (NYSE:BAC), the past week saw the second largest week of inflows to tech on record ($1.0bn) and the largest week of inflows was late Jan'17.
So why did the NDX decline?
High Yield Bond Index throws over its Diagonal Trendline.
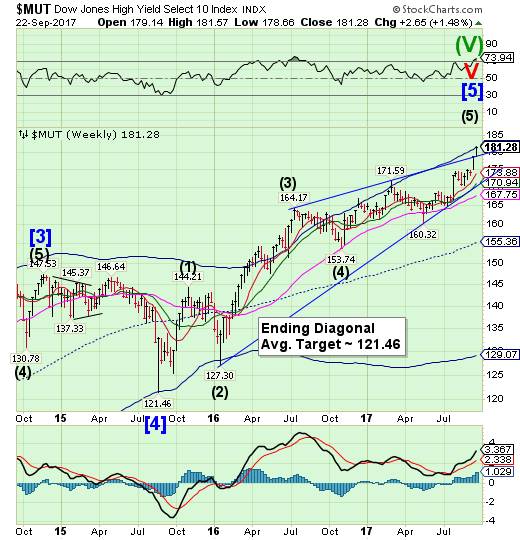
The High Yield Bond Index threw over the upper trendline of its Ending Diagonal formation, reaching for its Cycle Top at 181.64. Both stocks and high yield bonds continueda Cycle inversion this week, usually indicating that the end of a trend is drawing near. This is no time for complacency.
After a rough stretch that lasted from mid-2014 through early 2016, junk bonds have been on a tear. The median fund in the high-yield bond Morningstar Category gained more than 20% from March 2016 through August 2017. That’s left the spreads on junk bonds near their postcrisis lows. Spreads represent the additional yield offered by junk bonds over comparable U.S. Treasuries for the risk that the borrowers won’t repay their debt, so tighter spreads mean less compensation for lending to the market’s highly leveraged companies.
USB consolidates at support.
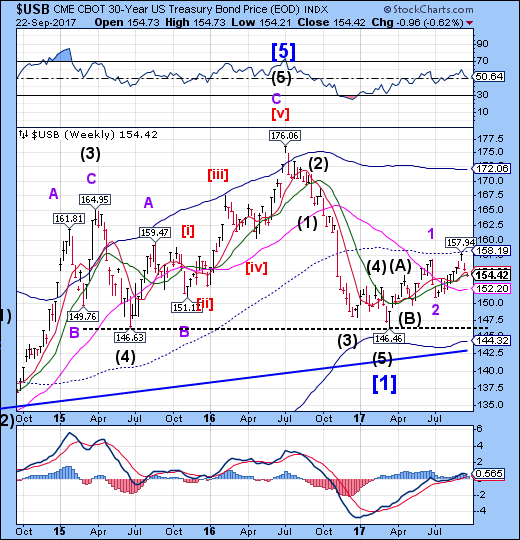
The Long Bond may be held by Intermediate-term support at 154.50. While it closed slightly beneath the mentioned support, the decline appears to have run its course. A resumption of the rally may take USB above mid-cycle resistance at 158.19. Should the right shoulder of a potential Head & Shoulders reach proportionality, the rally may go to 165.00 or possibly as far as the Cycle Top at 172.06.
Since The Fed unveiled its cunning plan to unwind the balance sheet ever so gradually and in an ever so well-telegraphed manner, the US Treasury yield curve has collapsed!
Banks do not care as the yield curve has crashed to its flattest since 2007.
In fact, the collapse to just 91bps places the yield curve right at the start of both of the last two recessions.
The euro bounces at Short-term support.
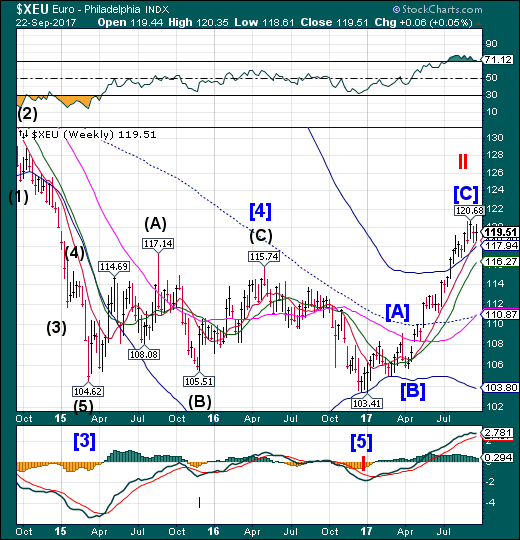
The euro appears to have bounced off Short-term support at 118.49 this week. A decline beneath the Cycle Top at 117.94 may be a sell signal. Traders are looking for a higher euro, but it may have reached a technical limit to this rally.
The euro jumped to 1.99 against the US dollar after output in services and manufacturing jumped to 56.7 in September from 55.7, according to the respected IHS Markit’s Flash Composite Purchasing Managers’ Index for September.
The survey is seen as a good guide to economy performance, with a reading above 50 signalling growth.
The manufacturing index went from 58.2 from 57.4, while services hit 55.6 from 54.7.
It's thought the eurozone could now see its economy grow by 0.7 per cent in the thrid quarter
Euro Stoxx extends its retracement rally.
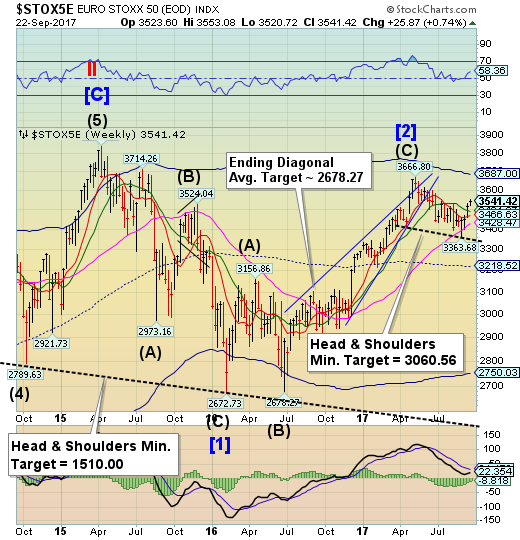
The Euro Stoxx 50 Indexprobed higher as it forms the right shoulder of its Head &Shoulders formation. The Cycles Model suggests that the loss of positive momentum may be sudden. A reversal has the potential to set a cascading decline into motion over the next several weeks.
European stocks closed mixed on Friday as investors digested a key speech from the U.K.'s prime minister on Brexit.
The pan-European Stoxx 600 closed flat, up just 0.05 percent provisionally, with sectors moving in different directions. For the week it was up 0.64 percent.
The U.K.'s FTSE 100 jumped 0.6 percent following a speech from Prime Minister May which gave little detail on how she wants a Brexit transition period to work. Sterling fell against the dollar on the speech, potentially boosting revenues at large U.K firms that deal in dollars.
The yen declines to Long-term support.
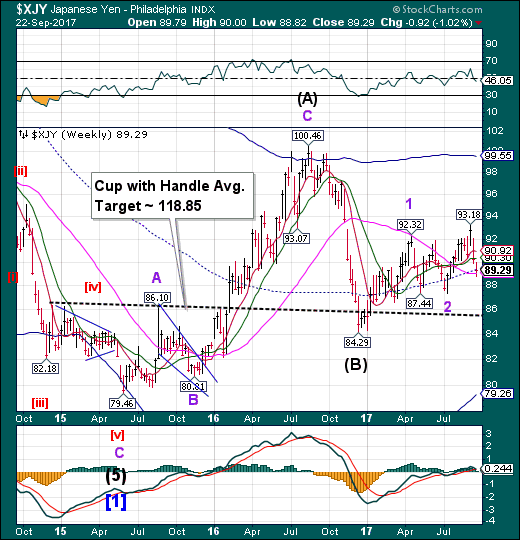
The yen challenged Long-term support at 89.07 before moving higher. A Master Cycle low was made on Thursday which accounts for the decline. A lift above mid-cycle resistance at 89.40 puts the yen back on a buy signal.
The dollar weakened against the yen on Friday, with tensions simmering on the Korean peninsula and as the boost from heightened expectations of a U.S. interest rate hike in December faded.
The dollar was down 0.42 percent at 111.99 yen, on pace to snap a five-day winning streak against the Japanese currency.
North Korea said on Friday it might test a hydrogen bomb over the Pacific Ocean after U.S. President Donald Trump threatened to destroy the reclusive country, with leader Kim Jong Un promising to make a “mentally deranged” Trump pay dearly for his comments.
Nikkei makes a 2-year high, flags on H-bomb threat.
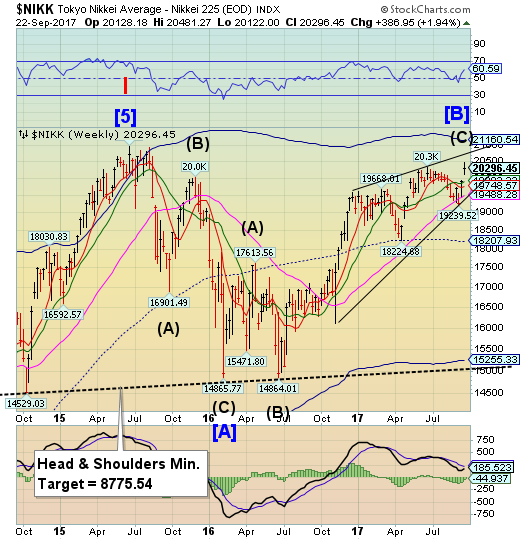
The Nikkei made a new 2-year high on Thursday, but pulled back on the North Korean threat of an H-bomb test. The higher probe negated the potential Head & Shoulders formation. Nevertheless, the Cycles Model suggests a potentially sharp decline over the next two weeks..
Japan's Nikkei share average slipped from a two-year high on Friday after North Korea threatened to test a hydrogen bomb in the Pacific Ocean, ratcheting up tensions with the United States and its allies. Still, the market logged its second straight week of gains, led by financial shares, which gained on a rise in US bond yields after the US Federal Reserve's policy statement on Wednesday.
The Nikkei slipped 0.3 per cent to 20,296.45 while the Topix fell 0.3 per cent to 1,664.61 with decliners outnumbering gainers by 2-1.
U.S dollar recon Solidates atits Cycle Bottom
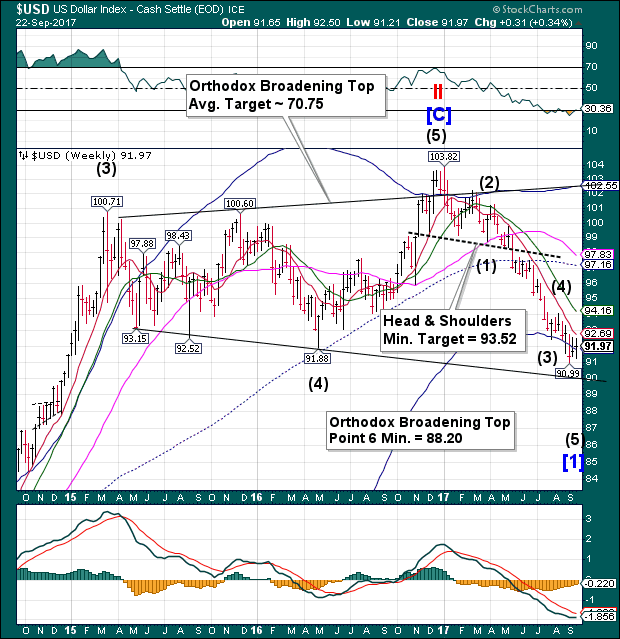
USD continues to consolidate at its Weekly Cycle Bottom support at 91.77 in a potential triangle formation. If correct, the Triangle increases the probability of USD continuing to its Orthodox Broadening Top short-term target.The lower trendline of the Orthodox Broadening Top at 90.00 may be the next attractor, but the formation calls for a breakout beneath the trendline, as indicated by “point 6.” .
The US dollar weakened during noon trading Friday as the Fed-induced boost from earlier in the week continued to fade and a mixed set of September PMI surveys did little to incentivise a renewed bid from traders.
September manufacturing activity gathered pace at a faster than expected rate than had been forecast by economists, with the IHS Markit manufacturing PMI rising from 52.8 to 53.0, although the services sector disappointed once again.
Gold declines to Short-term support.
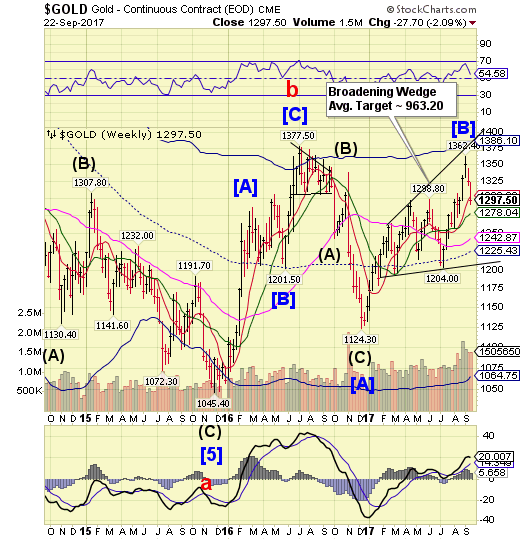
Gold declined to i8ts weekly Short-term support where there is a likelihood of a bounce.However, the Cycles Model suggests thedecline may resume through mid-October.
Gold prices had a mixed day yesterday as the prices broke through the 1300 region on the back of dollar strength following the hawkish Fed announcement and this move carried the prices through towards the support region at 1285. At that point of time, the prices looked very weak and the market feared that the gold prices might move even lower but none of that happened as the prices have since bounced higher through the 1290 region.
The heightened tension in the Korean region has once again helped to support the gold prices as the US and North Korea continue to trade charges and threaten each other for now.
Crude probes above Long-term resistance.
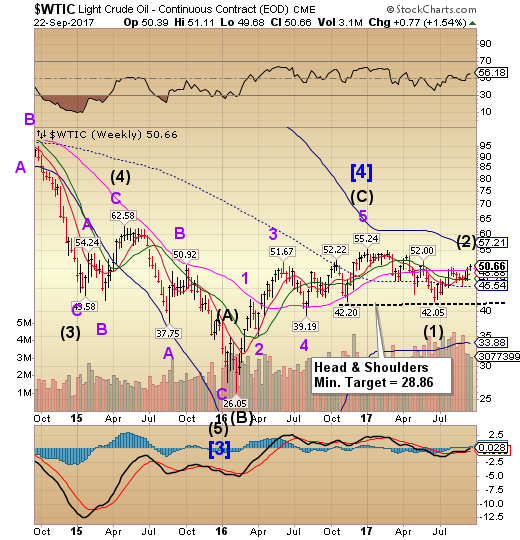
Crude probed above Long-term resistance at 49.85, making its high on Wednesday. The final bit of Cyclical strength extended beyond last week, but now appears to be over.The sell signalmay potentially be in play with confirmation beneath Intermediate-term support at 47.29.
Crude oil prices settled higher on Friday as investors shrugged off the outcome of an Opec-led meeting in which oil producers failed to reach a decision to extend the production-cut agreement.
On the New York Mercantile Exchange crude futures for November delivery rose 11 cents to settle at $50.66 a barrel, while on London's Intercontinental Exchange, Brent gained 27 cents to trade at $56.70 a barrel.
As was widely expected, members of the Organization of the Petroleum Exporting Countries (Opec) and other major producers failed to reach a decision to extend output cuts beyond March 2018.
Shanghai Index eases lower.
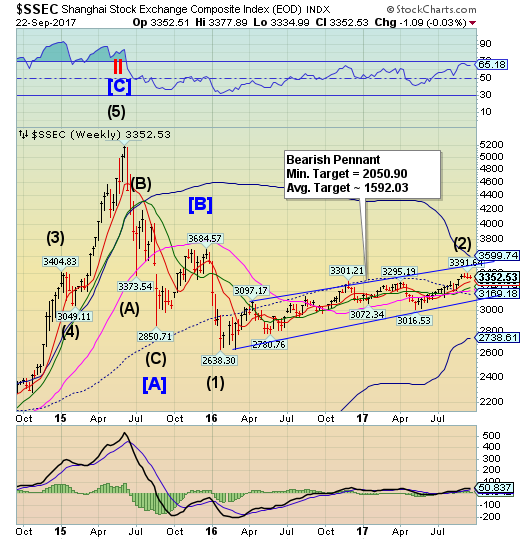
The Shanghai Index eased down in a consolidation that may produce a final probe higher. The chances of an inversion into the first week of October are quite high. Although this may be the negative season for Chinese stocks, there are political reasons for a short-term boost in prices. However, the potential for a sharp sell-off is rising.
Four months after Moody's downgraded China to A1 from Aa3, unwittingly launching a startling surge in the Yuan as Beijing set forth to "prove" just how "stable" China truly is through its nationalized capital markets, moments ago S&P followed suit when the rating agency also downgraded China from AA- to A+ for the first time since 1999 citing risks from soaring debt growth, less than a month before the most important congress for Chiina's communist leadership in the past five years is set to take place.
In addition to cutting the sovereign rating by one notch, S&P analysts also lowered their rating on three foreign banks that primarily operate in China, saying HSBC China, Hang Seng China and DBS Bank China Ltd. are unlikely to avoid default should the nation default on its sovereign debt. Following the downgrade, S&P revised its outlook to stable from negative.
The Banking Index extends its retracement.
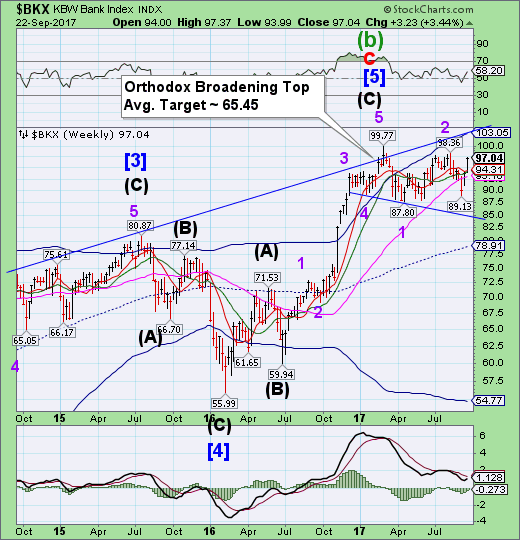
BKX extended its retracement above technical resistance, but did not make a new high. It remains on aprovisional sell signal beneath Intermediate-term support at 94.15. If the Orthodox Broadening Top formation is correctly identified, the next level of support may be the mid-cycle line at 78.91.
Russia's central bank has been forced to rescue two major lenders in less than a month, intensifying concerns among global investors that a systemic banking crisis could be in the offing.
The Russian government's latest rescue of a major bank was confirmed on Thursday, when the Central Bank of Russia (CBR) said it had nationalized the country's 12th largest lender in terms of assets, B&N Bank.
Last month, the CBR stepped in to launch one of the largest bank rescues in Russia's history when Otkritie Bank required a bailout to help plug a $7 billion hole in its balance sheet.
There was supposed to be volatility, but none has come. Instead, losing trades have sprung to life in September, among them bank shares, enjoying their strongest stretch since the first days of the Trump era.
The KBW Bank Index gained 3.4 percent this week, helping revive leadership in a group that before this month was heading for its worst year since 2013 relative to the rest of market. Among other violent reversals were small caps gaining traction and value shares like energy companies gaining ground on growth.
China’s central bank has told banks to strictly implement United Nations sanctions against North Korea, four sources told Reuters, amid U.S. concerns that Beijing has not been tough enough over Pyongyang’s repeated nuclear tests.
Tensions between the United States and North Korea have ratcheted up after the sixth and most powerful nuclear test conducted by Pyongyang on Sept. 3 prompted the United Nations Security Council to impose further sanctions last week.
Chinese banks have come under scrutiny for their role as a conduit for funds flowing to and from China’s increasingly isolated neighbor.
Bankers advising the Federal Reserve Board said a lack of follow through in the Trump administration’s economic agenda has resulted in slowing credit demand despite high levels of sentiment.
“The post-election expectation was that the gain in confidence and financial market deregulation would spur credit creation,” according to minutes released by the Federal Reserve Board of its Sept. 8 meeting with Federal Advisory Council. “While consumers and businesses remain optimistic, that has not translated into significant growth in loan demand.”
