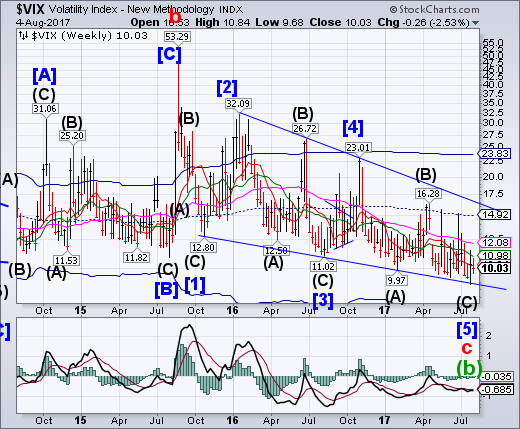
VIX had an inside week, closing beneath weekly short-term support/resistance at 10.24.It has not made a weekly buy signal. The Cycles Model suggests a reversal may have arrived, however. Once confirmed, the upside move may be very fast.
(EFT.com) ETF.com: We’ve heard a lot about how low the CBOE Volatility Index (VIX) and volatility are, but could you put that in perspective? How rare is the period we’re going through right now?
Russell Rhoads: We're as low as we’ve been for the whole history we’ve had VIX, but the other rarity is how low the actual market volatility has been. This is the least volatile the market has been since the ’60s.
SPX remains elevated above the Ending Diagonal trendline.
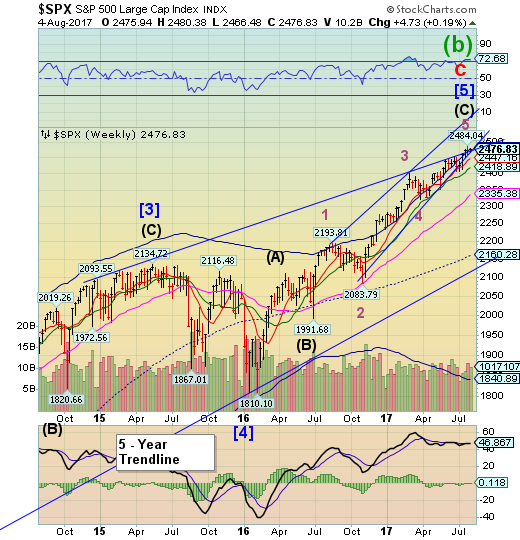
S&P 500 remains above its Ending Diagonal trendline, but closed beneath its Cycle Top resistance at 2479.67. A decline beneath Short-term support at 2447.16 may produce an aggressive sell signal, while a decline beneath Intermediate-term support at 2418.89 may confirm it.
(Tumblr) This week has seen yet more examples of poor internals despite new highs in the major averages.
Last week, we highlighted 2 recent potential examples of a weakening in the “internals” of the stock market rally. Again, by internals, we are referring to the amount of participation in the rally as measured by statistics such as advancing vs. declining stocks, advancing vs. declining volume and new 52-week highs vs. 52-week lows. The broader the participation, the stronger the foundation in the rally. Last week’s posts demonstrated some possible cracks in what has been a pretty solid foundation.
NDX eases back.
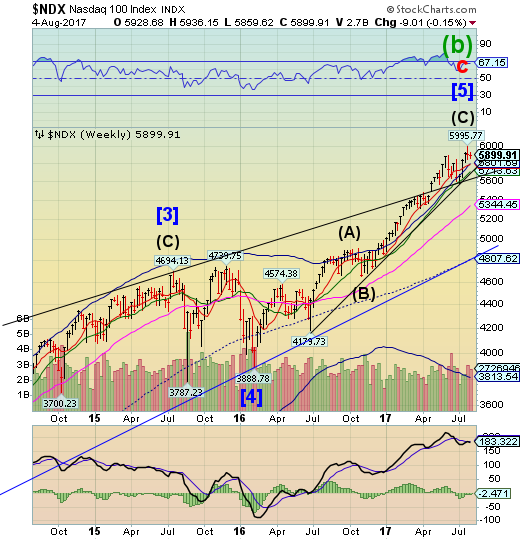
NDX eased back from its rally near 6000.00 after making an outside reversal.This may signal an end to the summer rally and a top of this Cycle.
(ZeroHedge) One doesn't need to see the recent fund flows to know that the tech euphoria of the past seven months appears to be ending - one look at the recent underperformance of the Nasdaq is sufficient - but it helps. Several weeks ago we showed a chart demonstrating the furious inflows into tech stocks, which as BofA calculated, annualized at an 18% AUM growth rate in 2017, resulting in a 22% increase in the S&P tech index.
Dow Jones High Yield Select 10 slows its ascent.
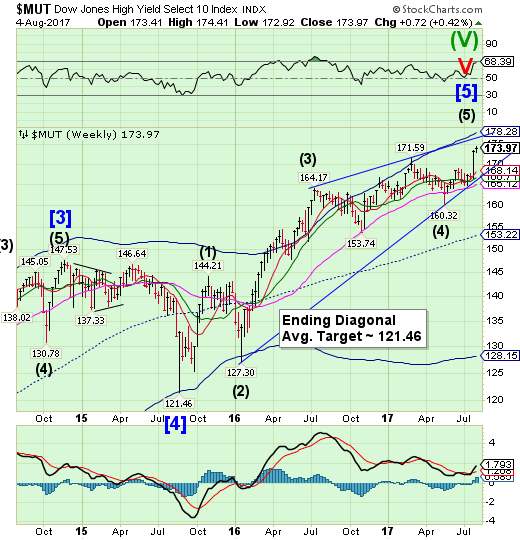
The High Yield Bond Index appears to be winding down its rally.The Cycles Model suggests a top may have been made this week.The spike high may be difficult to hold at this late date in the Cycle. A sell signal may be generated should MUT fall beneath its Ending diagonal trendline at 166.00.
(SeekingAlpha) On balance, the economy slowed in July relative to the previous month with only 41% of the data improving from June. The most notable and troubling declines are in the wages and income categories. Wage growth is negative which is putting pressure on the consumer in the face of soaring home prices.
The biggest market theme that is ultimately causing the slow down in the economy, and soon the stock market, is the inability of wage growth to outpace shelter inflation. For the past several years wage growth has been muted and the consumer was able to eek out 1.5%-2% growth in wages after adjusting for rent or shelter inflation. This is why the economy has grown in that same range of 1.5%-2% for the past several years as well.
USB gets a foothold above Long- and Intermediate-term support.
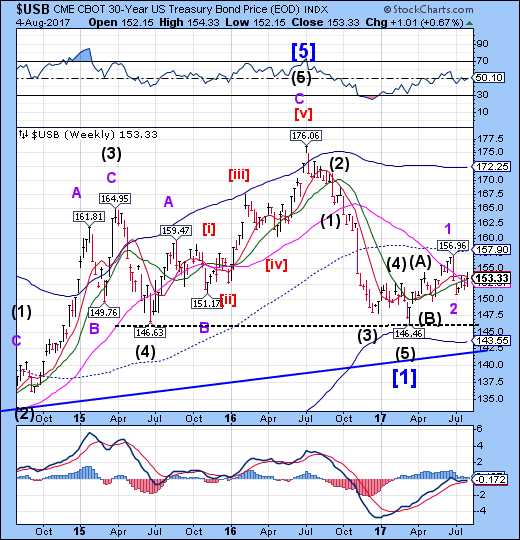
The Long Bond closed above Intermediate-term resistance at 153.23 and Long-term support at 152.67.Treasuries have begun their period of strength.The rally has quite a distance to go, since it must complete the right shoulder of a potential Head & Shoulders formation near 165.00 before a major reversal.
(CNBC) Treasury yields jumped on Friday as investors sold bonds on the stronger-than-expected jobs report.The yield on the benchmark 10-Year Treasury notes climbed to 2.266 while the yield on the 30-Year Treasury bond was higher at 2.844 percent. Bond yields move inversely to prices.The U.S. economy added 209,000 jobs last month versus Reuters expectations of 183,000.
"It was a certainly a very strong number all around led by the headline number and solid if not spectacular payroll growth," said Eric Stein, co-director of global income at Eaton Vance, in an email. "This number very much keeps the Fed on track for a Sept announcement of balance sheet reduction and I still think a December rate increase."
The EURO (TO:XEU) has a late week reversal above Cycle Top resistance.
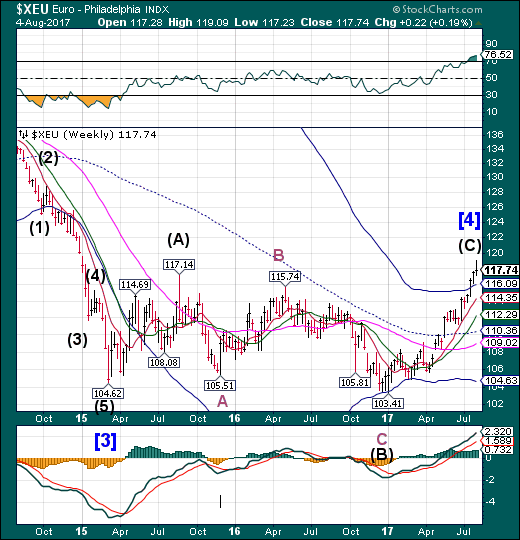
The Euro continued its rally through Wednesday above the Cycle Top at 116.09 this week. The Cycles Model suggests that the period of strength may have ended and calls for a major reversal. A decline beneath the Cycle Top may be a sell signal. Traders are looking for a higher Euro, but it is near a “natural” limit to this rally.
(CNBC) The euro seems poised to rally to much higher levels against the U.S. dollar over the coming years, especially if history is any guide and forward macro-politics provide any impetus.
For the last two and a half years the dollar has traded in a tight range between 1.05 and 1.15 to the euro. I believe the recent breakout above 1.15 portends major upside for the euro.
Looking back over the longer term, the exchange rate exhibits significant multiyear cyclicality with strengthening and weakening legs that last six or more years.
Euro Stoxx 50 bounces again from the Head &Shoulders pattern.
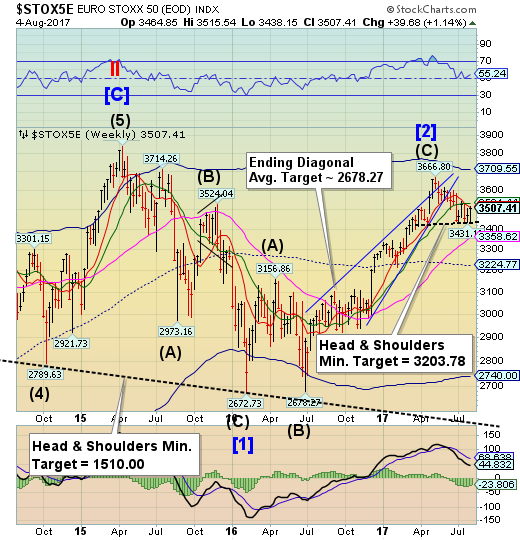
The EuroStoxx 50 Index bounced again from the Head &Shoulders neckline at 3235.00 for the fourth time in a month. Again it was stopped at Short-term resistance at 3512.40. A break through the neckline may set a cascading decline unto motion. The Cycles Model suggests the decline may be overdue.
(CNBC) Investors are often guilty of thinking things can only get better yet there appears to be little room left for European stocks to improve, according to a strategist at Deutsche Bank (DE:DBKGn).
"If everything is as good as it gets then you have to position yourself for a softening," Sebastian Raedler, European equities analyst at Deutsche Bank, told CNBC on Friday.
Raedler argued that investors should position themselves for what will likely happen in the future rather than the strong economic data the market has seen over the summer.
The Yen rallies through resistance.
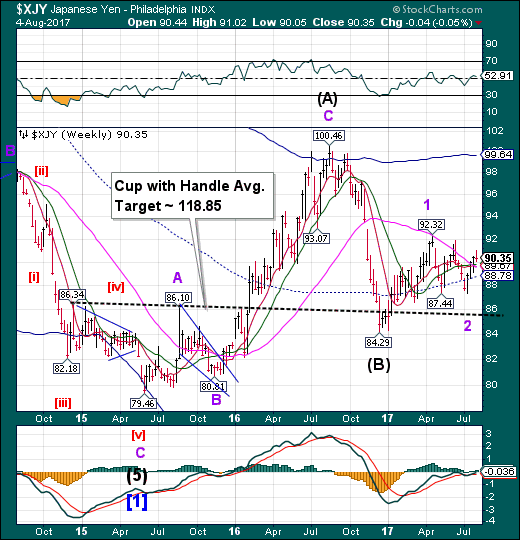
The Yen consolidated above Long-term resistance at 89.67 this week as it regroups above its supports. It may take up to a week to test those supports before moving higher.The longer-term trend may be recognized by speculators as it breaks out above its prior highs.The Yen is on a full-blown buy signal.
(NikkeiAsianReview) Though Japan's cabinet reshuffle elicited little immediate reaction from the foreign exchange and stock markets here, some observers expect a stronger yen and weaker share prices should the government's approval rating fall further in the coming months.
The forex market stayed quiet as new ministers were announced one by one Thursday. The yen hovered in the 110.50 to 111 range against the dollar all day.
The reshuffle kept several key officials under Prime Minister Shinzo Abe in their posts, such as the chief cabinet secretary and the finance minister, so many expect policy directions to remain the same. A falling approval rating already loomed as a risk that could bolster Japan's currency, as recent polls showed support for the cabinet dropping below 40%.
Nikkei 225 declines below 20000.
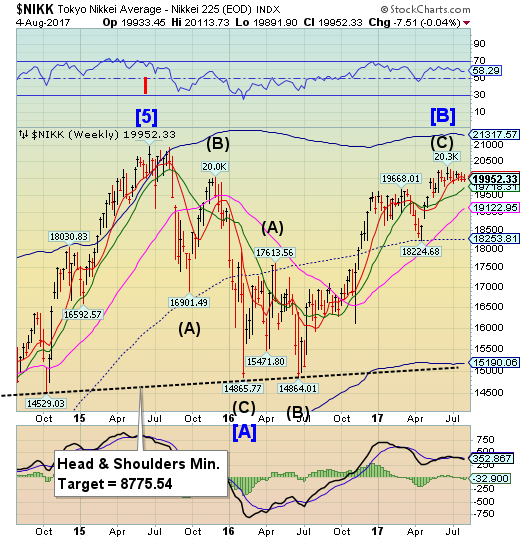
The Nikkei has been struggling at Short-term support at 20020.28 and round number support at 20000.00, closing beneath both. The Nikkei may be on a sell signal.Further confirmation of the decline lies at Intermediate-term support at 19718.31.
(JapanTimes) Stocks ended lower on the Tokyo Stock Exchange Friday under the pressure of the yen’s rise against the dollar, pushing down the benchmark Nikkei average below 20,000 for the first time in three days.
The Nikkei 225 fell 76.93 points, or 0.38 percent, to end at 19,952.33. On Thursday, the key market gauge lost 50.78 points.
The Topix index of all first-section issues finished down 2.37 points, or 0.15 percent, at 1,631.45, after falling 0.56 point the previous day.
U.S DollarGoes beyond time and price targets
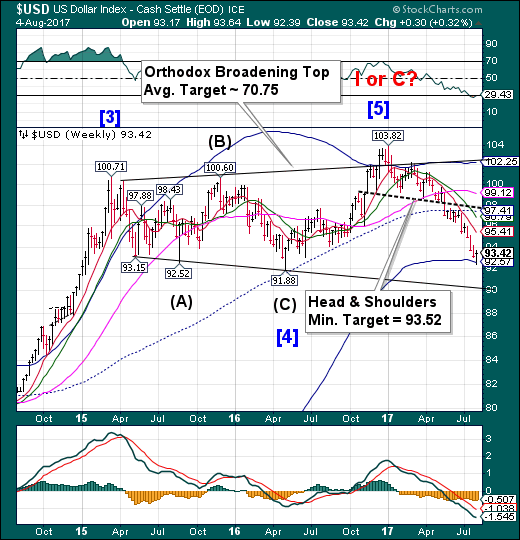
USD went beyond both time and price targets to make a Master Cycle low at its Weekly Cycle Bottom support at 92.52.This possibility was mentioned last week as a likely outcome. It is now likely to have a two-week (or longer) bounce to test the mid-Cycle resistance at 97.41.
(CNBC) The U.S. dollar was set for its biggest one-day gain against a basket of major currencies so far this year after a strong U.S. July payrolls report and comments from National Economic Council director Gary Cohn about lowering the U.S. corporate tax rate.
The dollar index, which measures the greenback against six major rivals, jumped about 1 percent to a one-week high of 93.774 after the Labor Department said nonfarm payrolls increased by 209,000 jobs last month and Cohn's comments. It was last up 0.65 percent at 93.44.
.Gold reverses from a lower high.
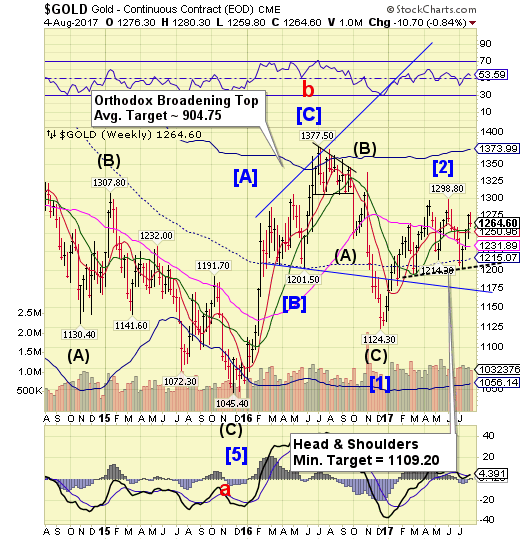
Gold reversed from the right shoulder of its double headed Head & Shoulders formation.The Cycles Model suggests a probable decline has begun. Gold may go into freefall beneath Short-term support at 1250.96.
(CNBC) Gold fell on Friday after hitting a seven-week high earlier this week, as the dollar rose from multi-month lows, after monthly U.S. non-farm payrolls data was better-than-expected.
Spot gold was down 0.77 percent to $1,258.36 per ounce, near its lowest level since July 28th when gold traded as low as $1,256.90 per ounce. It traded flat at $1,268.61 per ounce before the report.
- gold futures for December delivery settled at $1,264.60 per ounce.
Crude challenges Long-term resistance.
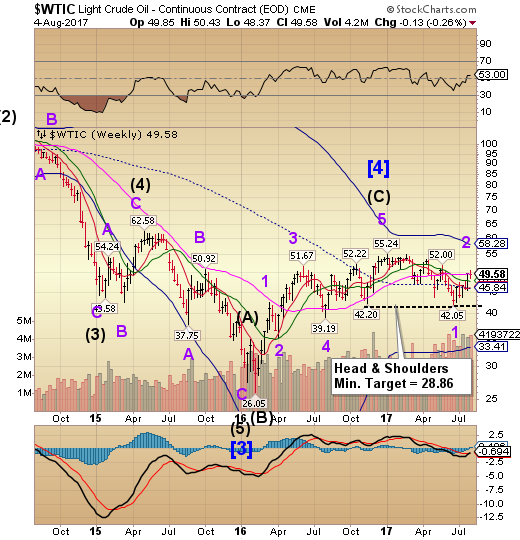
The Crude rally closed under Long-term resistance at 49.68 after a week-long challenge.The reversal suggested last week appears to be developing.A decline beneath Intermediate-term support at 47.65 reinforces the sell signal.
(Reuters) - Oil prices fell on Thursday, as cautious buying dried up after U.S. crude rose to near $50 a barrel, with concern about high crude supplies from producer club OPEC offsetting the previous day's data showing record U.S. gasoline demand.
Benchmark Brent crude LCOc1 settled down 35 cents a barrel at $52.01 a barrel. U.S. light crude CLc1 was 56 cents lower at $49.03. U.S. crude traded at a session high of $49.96 a barrel.
OPEC crude oil exports rose to a record high in July, driven largely by soaring exports from the group's African members, according to a report by Thomson Reuters Oil Research.
Shanghai Composite makes a new retracement high.
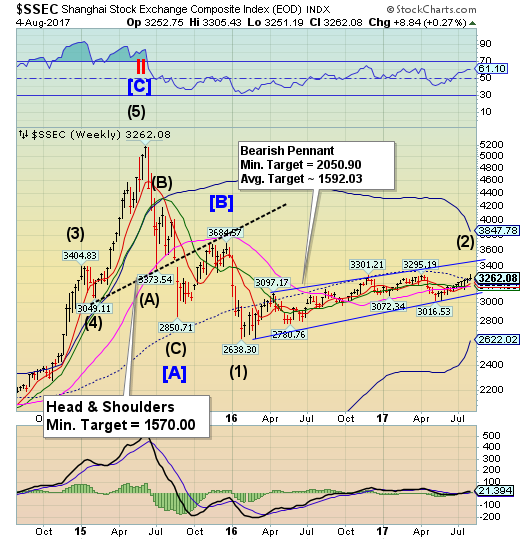
It took the Shanghai Indexnine months to make a new high above the November 29 high. However, it retraced a mere 26% of its 2015 decline in the last 18 months.The Shanghai Index now enters the negative season through October. The Cyclical strength appears to have ended earlier this week. The potential for a sharp sell-off is rising.
(ZeroHedge) With just one day to go until the Trump administration launches the first salvo in what could develop into a full-scale trade war between the US and China, there is the issue of a diplomatic (hopefully) resolution of escalating situation in North Korea, one which Citi today said is "increasingly likely" to involve military action. On this issue, China is becoming increasingly displeased with Trump's relentless twitter badgering, and as AFP reports, "Trump-style outbursts are no way to get China to bend to the US's will."
The animosity between D.C. and Beijing has been building up for months, as the two capitals have long traded blame over the failure to rein in the North, but last week's breakthrough in North Korean missile technology has raised the specter of a strike by Pyongyang on American cities, escalating the rhetoric.
The Banking Index bounces but no new high.
--BKXbounced this week, but could nt overcome its July 6 high at 97.85, much less its March 1 high at 99.77.Weakness may develop next week as BKX declines beneath its Intermediate-term support at 93.99again.
(ZeroHedge) Wells Fargo (NYSE:WFC) just released a lengthy 10Q revealing a number of concerns for shareholders with regard higher-than-expected legal costs, new auto loan sales 'issues', and the potential for "significantly" more fake accounts based on a wider review. Ironically, WFC's CEO Tim Sloan began his press release thus... "rebuilding trust became our top priority when I became CEO last October."
(ZeroHedge) When Janet Yellen testified before the House Financial Services Committee last month, she faced grilling on a topic that hasn’t received enough mainstream attention: the interest being paid on excess reserves at the Fed. While the topic has come up occasionally since the program began in 2008, it is worth noting that Yellen was pushed by both JebHensarling, the committee chairman, and Andy Barr, the chairman of the Monetary Policy Subcommittee.
While ending this taxpayer subsidy to Wall Street is important, it’s also important to understand the dangers posed by allowing these excess reserves to be lent out of major financial institutions.
To understand what is at stake, recall back to 2008 when many Fed observers were concerned about the inflation dangers posed by the policies of the Bernanke Fed.
In a six year period, the base money supply increased over four-fold.
(CNBC) (Reuters) - A U.S. judge on Friday said investors may pursue part of their nationwide antitrust lawsuit accusing 12 of the world's biggest banks of conspiring to rig the $275 trillion market for interest rate swaps.
- Bank of America Corp (NYSE:BAC) and JPMorgan Chase & Co (NYSE:JPM), must defend against claims that from 2013 to 2016 they boycotted three upstart electronic platforms for swaps trading, hoping to destroy them.
Investors seeking damages in the proposed class action said banks did this to preserve their 70 percent market share, and boost profit by making trading more costly. Engelmayer dismissed all claims against the 12th bank, HSBC Holdings Plc (LON:HSBA).
Have a great weekend!
