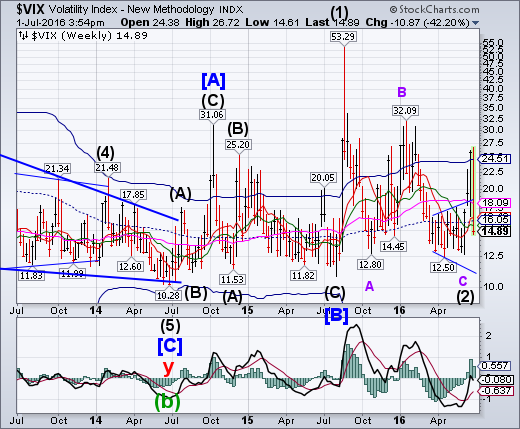
VIX topped on Monday and declined almost 42% through Friday, erasing the prior week’s gains. What may have been strength turned into weakness as central banks unleashed massive amounts of liquidity into the markets. Apparently it was imperative to keep equities positive for the quarter end.
(Bloomberg) The market convulsions of the last week have been a lesson in the complexity of volatility markets for investors who bought exchange-traded notes tied to turbulence in equities.
Owners of the wildly popular exchange-traded securities have been whipsawed day after day as the benchmark measure for stock volatility bobbed and weaved in the aftermath of the U.K. referendum. Some of the moves were straightforward reactions to the up-and-down motion of the VIX, others a byproduct of less-visible currents in futures markets.
SPX grabs back nearly all of its Brexit losses.
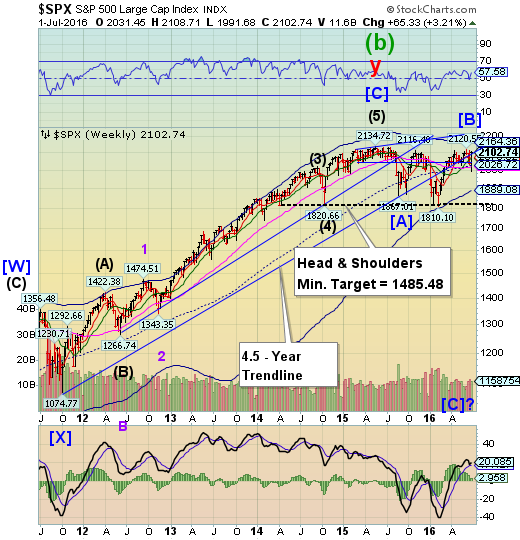
SPX rallied to grab back nearly all the Brexit losses in the biggest short squeeze in seven years. SPX closed beneath the prior week’s high, leaving it in no-man’s land over the weekend. A decline beneath 2100.00 may set a new sell-off in motion. So, who’s buying this rally?
(ZeroHedge) The new normal sure is strange: with the S&P flirting with all time highs, not to mention staging another dramatic V-shaped comeback from the post-Brexit crash which saw S&P futures trade limit down a week ago, investors keep on selling. According to Lipper data, U.S.-based stock mutual funds, which are held by retail mom-and-pop investors, posted cash withdrawals of $2.8 billion over the weekly period ended Wednesday; this was the 16th consecutive week of outflows.
All stock funds, including ETFs, posted an even wider $6.8 billion outflow last week to mark their biggest withdrawals since early May, while taxable bond funds posted $2.6 billion in outflows after raking in $2.5 billion the prior week. The perpetual question of who is buying remains especially after BofA reported earlier this week that its "smart money" clients sold US stocks for the third consecutive week and in 21 of the past 22 weeks, led by institutional clients' sales.
NDX breaks mid-Cycle support, regains some losses.
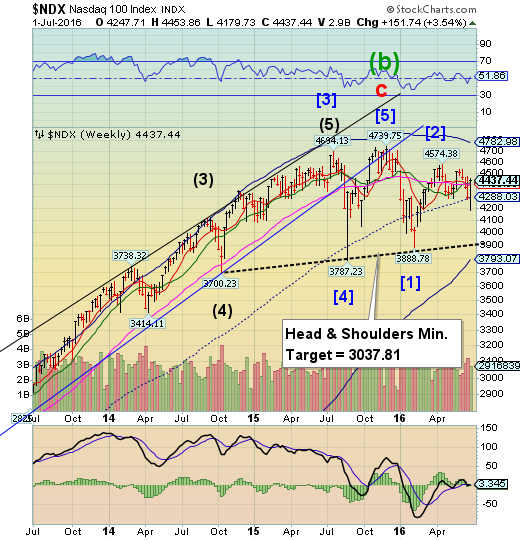
NDX broke down further on Monday, but retraced most of last week’s losses to close the end of the quarter at a loss. The Head and Shoulders neckline at 3900.00 appears to be the next significant formation to be challenged. This appears to be the end of the summer rally and the beginning of seasonal weakness that may last several months.
(Tumblr) The bruised and bloodied Biotech sector is testing a trendline that may determine whether it has one more bull bounce – or if its bubble has burst.
Today’s Trendline Week feature takes us back to the U.S. to look at one of the, er, trendiest indices in the stock market. After covering Europe on Monday, Japan on Tuesday and back to Europe (specifically, Germany) on Wednesday, today we look at the oft-debated and controversial Biotechnology sector.
Bear in mind that we are not picking these markets because of their prominence or popularity, but because they currently offer the most compelling trendline events in the market, in our view. That includes the Biotechs where we see the sector’s premier index testing a crucial level of support.
High Yield Bond Index ignores the reversal, makes a new high.
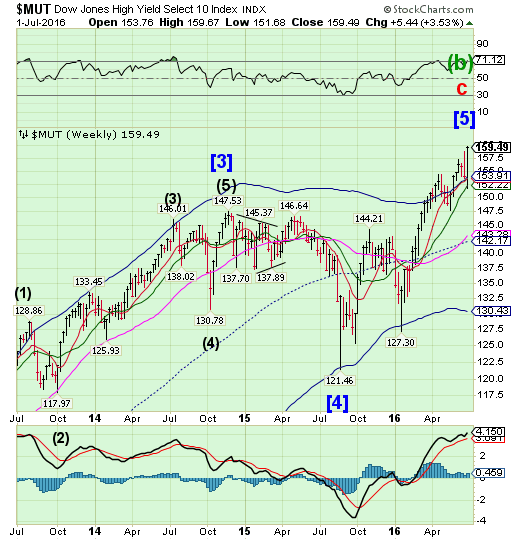
After what appeared to be a Key Reversal on Friday the High Yield Bond Index tested Intermediate-term support at 152.22 before making an even higher high. Note that it reacts to the same pivots as equities, making its high on the same day as the SPX. Investors should now be on the alert for a decline beneath its Intermediate-term support at 152.22 for a probable sell signal.
USB exceeds its target in a throw-over.
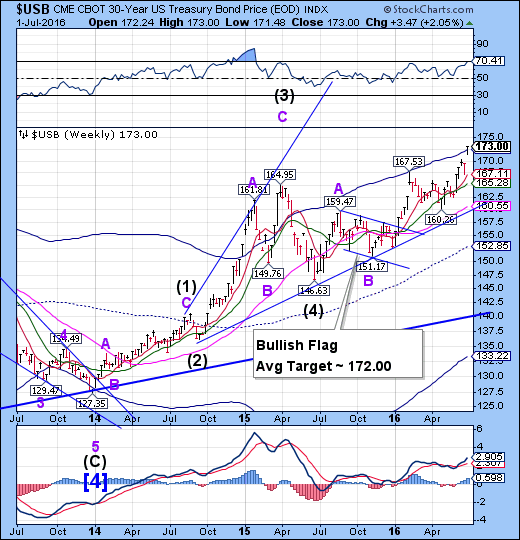
The Long Bond (U.S. 30-Year) gapped up to its Bullish Flag target and new all-time highs as it threw-over its Cycle Top at 172.49. The throw-over may extend the high further, but be ready to exit as soon as a reversal beneath Cycle Top support is made.
(WSJ) Yields on U.S. government bonds touched new lows Friday, the latest records set during this year’s rally in sovereign debt, as investors continue to grapple with slow global growth, ultra-loose central bank policies and the aftershocks of the U.K.’s vote to leave the European Union.
The bid yield on the benchmark 10-year Treasury note fell to 1.385% during European morning trading, according to Tradeweb, breaking its previous intraday low of 1.389% set on July 24, 2012, when it also set a record closing low of 1.404%.
The euro probes the Broadening Wedge trendline.
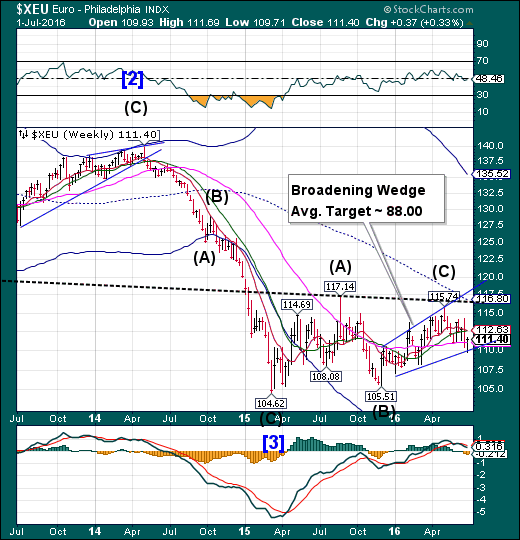
The euro probed the lower trendline of its Broadening Wedge formation, but closed above Long-term support/resistance at 111.06.A break of the trendline may put the euro back into a bear market with the loss of that key support. The next area for a bounce may be the 104.00 to 106.00 as it retests it former lows.
(ZeroHedge) Money, generally accepted medium of exchange, acts as a veil that confuse and blurs economic relations. This is especially true when it comes to intertemporal considerations.
Whilst probably the most important institution in a free market, money can be highly destructive when politicized. Why? Because politics is about power and distribution of real wealth. And since money affect almost every single transaction, politics can span throughout society with ease when in control of money.
Amchel Rothschild was spot on when he allegedly said “[g]ive me control of a nation’s money supply, and I care not who makes its laws.” Power over money is power over people and power over people is, well, pure power. Money is thus the most sacred tool in a statist’s toolbox and has become instrumental in their quest to control society and allocate resources as they see fit.
It is within this context the monstrosity called the euro need to be analyzed. By pooling Western European countries within the realm of one central bank, power over people increases immensely. There is a catch though; as power increases, greed and corruption increases with it and the temptation to go too far is obvious for all to see.
Euro Stoxx bounces off its neckline.
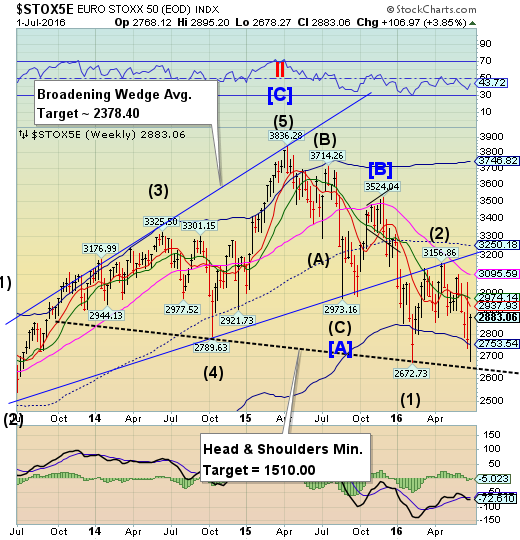
The Euro Stoxx 50 Index declined through its Cycle Bottom only to bounce near its Head and Shoulders neckline.The trend lis clearly down and the bounce only temporarily relieves its oversold condition. A resumption of the decline beneath the neckline at 2620.00, triggering an even stronger sell-off.
(CNBC) European stocks finished the session with solid gains on Friday as the recovery in global markets continued, despite uncertainties over the Brexit vote.
The pan-European STOXX 600 closed up 0.7 percent in what had been a choppy session. Sectors were mostly higher, while tech and health care stocks showed signs of weakness.
London's FTSE index closed higher by 1.1 percent provisionally. On the week, it gained over 7 percent, marking the best weekly percentage gain since December 2011.
The yen consolidates beneath its Cycle Top.
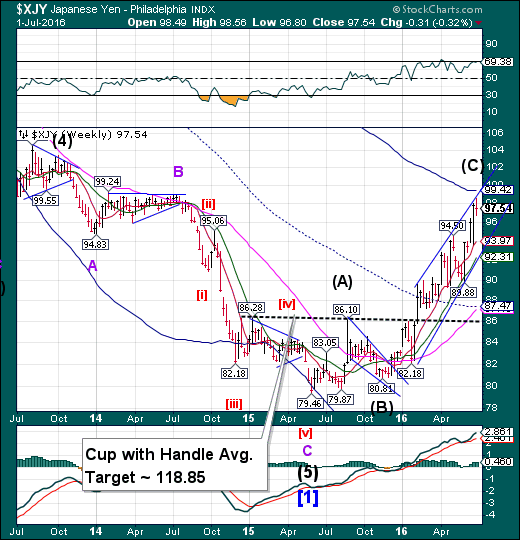
The yen consolidated beneath its Cycle Top after hitting the upper trendline of its trading channel. Round numbers are attractors, so it is probable that the rally may continue to 100.00, or at least make another attempt at it. There appears to be a probable period of strength that may last another week or more. A breakout above the Cycle Top may lengthen the rally.
(Reuters) Japanese business confidence was subdued in the second quarter and consumer prices fell in May at the fastest pace in three years, heightening pressure on the central bank to roll out yet more stimulus to ease the pain from a strong yen.
The government is also seen increasing fiscal spending as weak overseas demand hurts exports, though critics warn that throwing more money into the economy won't fix chronic woes plaguing Japan like low productivity and a rapidly shrinking labor force.
.The Nikkei bounces from the neckline.
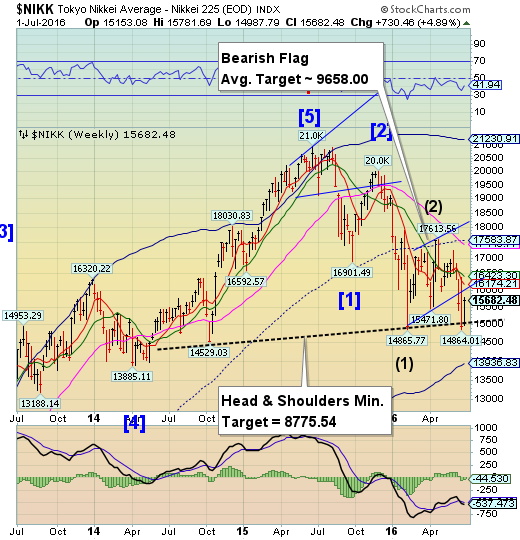
The Nikkei challenged its Head and Shoulders neckline, making a deeper low than in January. However, it bounced to retrace 60% of its prior week’s decline, also making a 32.6% retracement of its decline from mid-April.A failure to continue this rally may lead to a decline beneath the neckline and its consequences..
(JapanTimes) The benchmark Nikkei average advanced for the fifth straight session on the Tokyo Stock Exchange Friday, helped by buying on the back of Wall Street’s overnight rise, but its upside was capped by selling on a rally.
The 225-issue Nikkei average climbed 106.56 points, or 0.68 percent, to end at 15,682.48. On Thursday, the key market gauge climbed 9.09 points.
U.S. dollar reversed down from Long-term resistance.
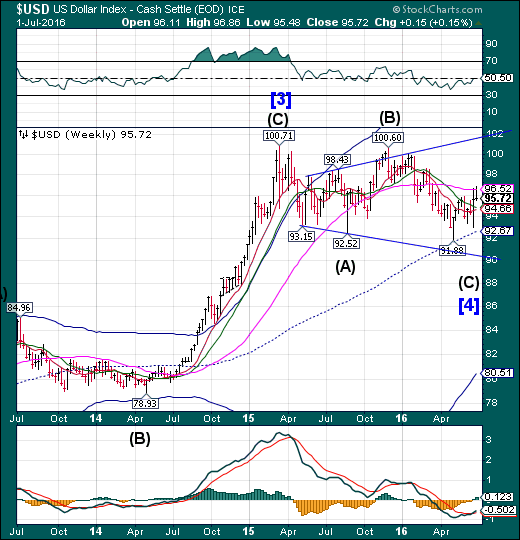
USD reversed down from its Long-term resistance at 96.52. This is in line with the long-term target consisting of the lower trendline near 90.50. The Cycles Model suggests the next low to occur in mid-July.
(Reuters) Currency speculators reduced their net short position against the British pound in the week after the United Kingdom voted to exit the European Union, according to Reuters estimates and data from the Commodity Futures Trading Commission released on Friday.
Speculators also trimmed net U.S. dollar longs to $3.01 billion.
The number of net short contracts on the pound fell to 42,711 contracts in the week ended June 28, from 51,947 shorts the previous week.
Gold reverses from the high point of the Broadening Top.
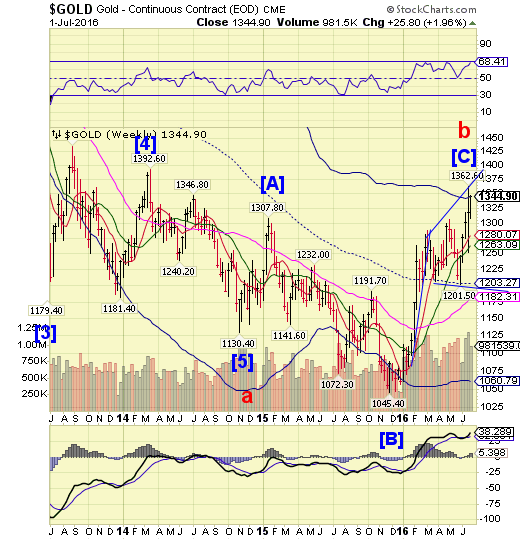
Gold appears to have made a reversal pattern inside the Orthodox Broadening Top formation, closing just beneath its Cycle Top at 1345.75.Next week may be instructive whether this is a bona-fide reversal. It’s time to be alert for a change in trend
(Bloomberg) Gold posted the longest run of weekly gains in almost two years and silver surged to the highest since 2014 as Britain’s vote to quit the European Union fueled speculation that central banks will boost economic stimulus.
Havens such as gold and silver are in demand on prospects for weaker economies. Treasury yields fell to record lows along with sovereign rates from Spain to Japan as policy makers signaled their readiness to shore up economies. Governor Mark Carney said Thursday that the Bank of England could cut interest rates within months.
Crude tests the Pennant trendline.
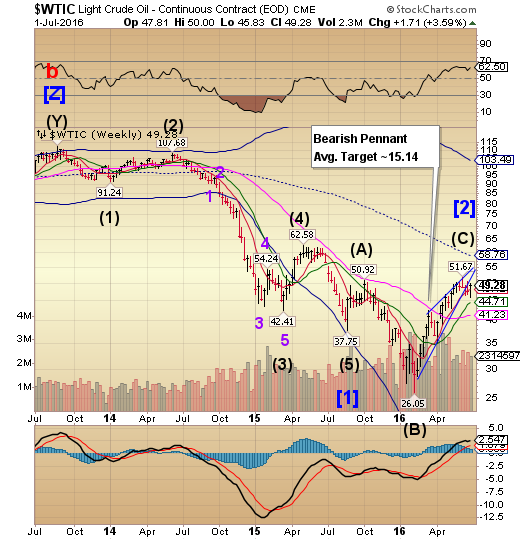
Crude made a new low on Monday before rising to test the Bearish Pennant trendline. This may be viewed as a sell signal for crude, or one may use a new low beneath 45.83 to sell. It suggests an initial drop to challenge the prior low at 26.05 with a more substantial decline to follow.
(WSJ) Oil prices posted their largest quarterly rally since 2009 due to supply disruptions and expectations of falling production.
U.S. oil prices rose $9.99, or 26%, to $48.33 a barrel in the second quarter on the New York Mercantile Exchange. On Thursday, prices settled down $1.55, or 3.1%.
Brent, the global benchmark, rose 25% in the second quarter to $49.68 a barrel on ICE Futures Europe.
(ZeroHedge) Throughout oil's torrid rally from the February lows, one major driver of demand - namely China - had been broadly ignored by the punditry which instead focused on supply, whether excess OPEC oversupply or lack thereof, due to production disruptions in Canada or Nigeria. And yet, China and specifically its demand, may have been the elephant in the room all along.
Shanghai Index declines beneath its Cyclical supports.
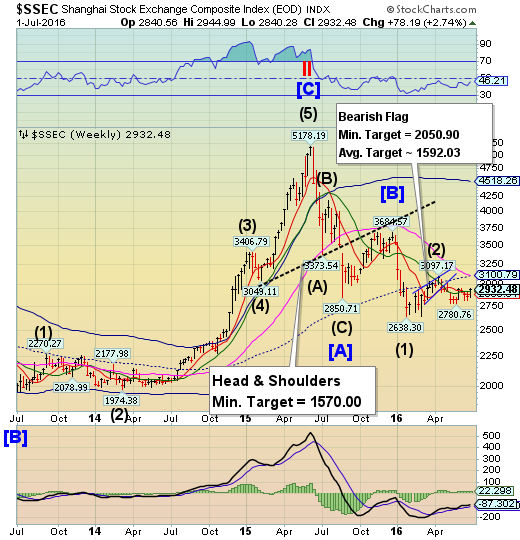
The Shanghai Index rallied above Intermediate-term support/resistance at 2918.89, but is still caught in its sideways consolidation. There is no technical reason to account for this surprisingly level pattern. The Cycles Model suggests that weakness may dominate through the end of the month. The Model suggests a possible new low may be made as early as next week.
(ZeroHedge) If you ever wanted to get a look inside the mind of Kyle Bass, founder and CIO of Hayman Capital Management, here is your chance. In a wide-ranging discussion with Grant Williams, author of Things that Make You Go Hmm and co-founder of Real Vision TV, he shared his thoughts on position-sizing, China, the appeal of holding gold, central banking, interest rates – and much, much more.
Predictably, the one topic that got the most attention was China, where as widely known Bass has made his next "career" wager, expecting a substantial devaluation of the currency, a process which had stalled out in recent months but has once again picked up speed.
The Banking Index breaks below the Cycle Bottom, closes above it.
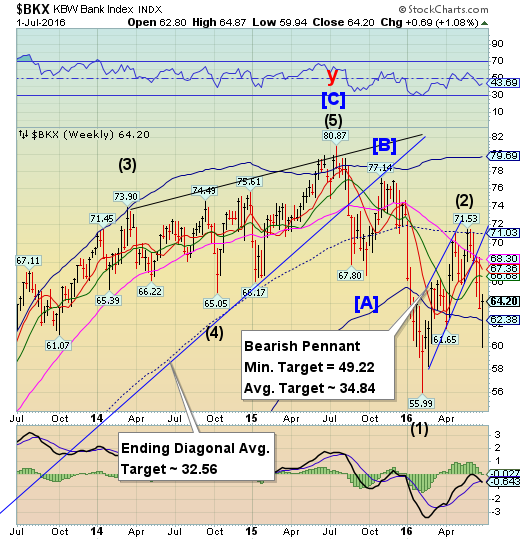
--In a wildly swinging week, BKX declined beneath its Cycle Bottom, than rallied above it.As mentioned earlier, the Cycle Bottom was not be capable of stopping the decline, but central bank intervention may have saved it, at least for the week. Now that the second quarter is on the books, the plight of European banks and quarterly earnings may come to the fore.
(Bloomberg) U.K. banks made it through the initial Brexit turmoil without undue stress on their liquidity or borrowing costs. Now the Bank of England is moving to reassure investors that even a recession, and the potential impact on earnings and asset prices, won’t put them at risk of breaching minimum capital levels.
With the economic outlook darkening after the nation’s decision to leave the European Union, the central bank will announce as soon as next week that lenders won’t be required to set aside extra capital next year under a measure known as the countercyclical capital buffer, people with knowledge of the discussions said.
The buffer is designed to guard against the cycle of banks excessively boosting lending in good times, then slashing credit in a downturn.
(ZeroHedge) Over the past few months we have witnessed massive cost cutting efforts (ie: firing of bankers) by many firms, Goldman Sachs Group Inc (NYSE:GS), BAML, Nomuraand RBS (LON:RBS) to name a few. Now it's time to add Commerzbank (DE:CBKG) to the list of firms that need to fire people in order to try and cut enough costs to maintain earnings.
Germany's Commerzbank announced that it is cutting more than 100 investment banking related jobs in its New York office as part of its efforts to streamline its operations and boos profitability the WSJ reports, as a sluggish trading environment continues to weigh on profits. The bank announced last year that it was going to bundle investment banking activities in certain locations.
(ZeroHedge) Despite - or perhaps due to - Italy's failed attempt to slide a state-funded €40 billion recapitalization attempt past Angela Merkel while blaming it on Brexit, and coupled with a bailout proposal to provide €150 billion in liquidity to insolvent banks, overnight we got yet another confirmation that the biggest risk factor for Europe is not Brexit but Italy, where yet another failed bank was bailed out.
As the FT reports overnight, Atlante, Italy's privately backed €5bn bank bailout fund which was created in April to stem the threat of contagion from struggling lenders and whose assets turned out to be woefully inadequate, took control of Veneto Banca after a €1bn capital increase demanded by EU bank regulators attracted zero interest.
(ZeroHedge) Despite all the exuberance over the Brexit bounce in US (and UK) equities, never minds bonds, FX, and credit being far less enthusiastic, Deutsche Bank (DE:DBKGn) is plunging once again this morning.
Having failed The Fed's stress test for the second year running and been diagnosed by The IMF as the world's most systemically dangerous financial entity, the giant Germanbank is getting slammed down almost 4% today, back near record lows as its 'Lehman-esque' path to devastation continues.
