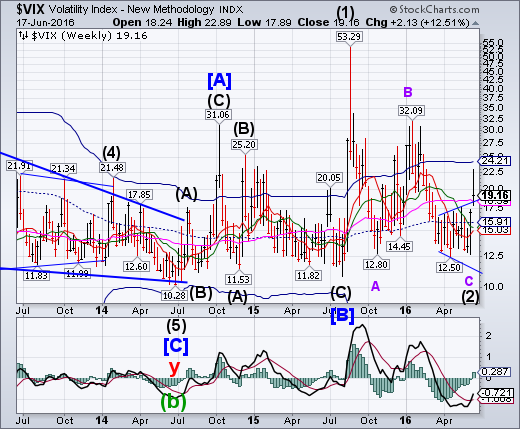
VIX rallied above weekly Long-term support at 18.40 this week, closing above it. This confirms the VIX buy/Equities sell signal. Broadening formations (tops and bottoms) are often known as reversal patterns.
(ZeroHedge) Amid turmoil in Chinese FX markets (which has not ended well in the past), the need to hedge against the looming Brexit vote, and rapidly fading confidence in the ability of The Fed, BoJ, ECB to save the world; it appears what was an ignorantly complacent market has suddenly shrugged off the denial (perhaps face-slapped by Yellen) and is buying protection (in the form of VIX ETNs) with both hands and feet. As Bloomberg's Richard Breslow so eloquently notes, "markets are struggling to believe in anything."
SPX declines beneath its long-term trendline.
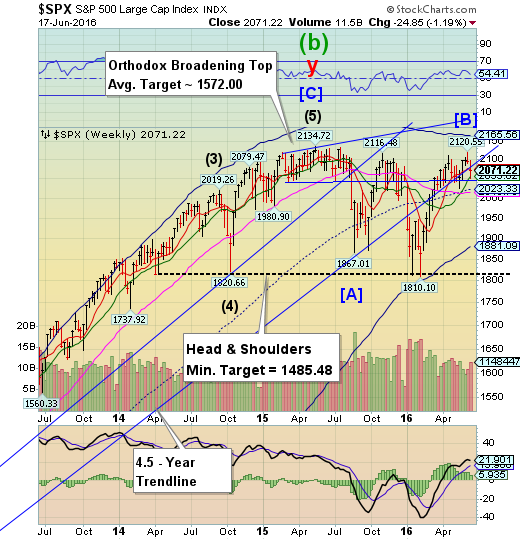
SPX made a second lower weekly close beneath its 4.5-year trendline and beneath weekly Short-term support at 2075.38. The “shelf” of support at 2044.00 was tested this week. Further weakness may break it and Intermediate-term support at 2055.02. The loss of those supports may erase all 2016 gains and set off a probable decline similar to the one in January.
(WSJ) U.S. stocks fell, capping a rocky week when traders focused on the consequences of the coming U.K. vote on whether to stay in the European Union.
Traders described an uneasy calm in the stock market Friday following a string of losses. As of June 8, the S&P 500 had been up 3.7% for 2016. The index had pared those gains as of Friday’s close to be up 1.3% this year.
Also since June 8, oil prices have fallen back below $50 a barrel, and yields on the 10-year Treasury note on Thursday sank to their lowest close since August 2012.
NDX closes beneath Cycle supports.
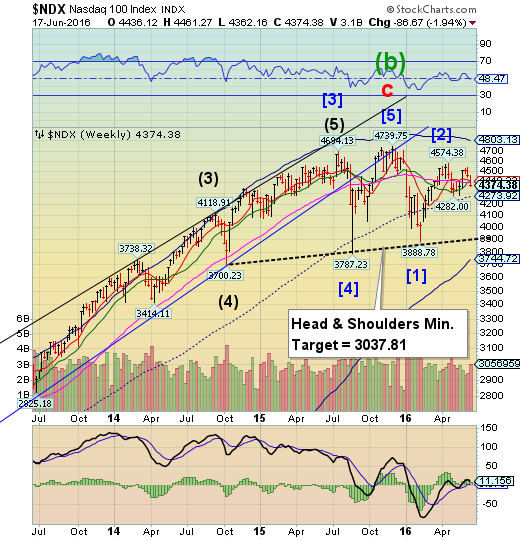
NDX declined beneath all Cycle supports this week, leaving only the mid-Cycle support at 4773.92 between it and the Head & Shoulders neckline. This appears to be the end of the summer rally and the beginning of seasonal weakness that may last several months.
(ZeroHedge) FANG stocks, led by Google (NASDAQ:GOOGL), have tumbled by the most in two months today and given up any gains in 2016. This is weighing on the broad hope-strewn stock market as it erases all the post-Jo-Cox-death gains from yesterday...
FANGs losing it...
High Yield Bond Index stumbles at its peak.
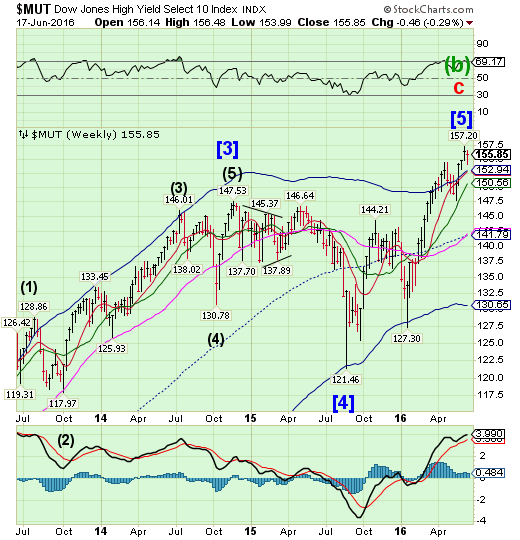
The High Yield Index peaked on June 7 at 157.20. Note that it reacts to the same pivots as equities, making its high on the same day as the SPX. Investors should be on the alert for a decline beneath its Cycle Top support at 152.94 for a probable sell signal.
(ZeroHedge) It's been a tough year for traders and bankers alike, as layoffs have gripped firms due to difficult trading environments and an overall sluggish economy.
However, there is one area that is starting to actually pick up. As the number of bankruptcies begin to increase, firms are expanding their turnaround teams in order to handle all of the work headed their way - bankers with experience in turnarounds and restructuring are now in high demand.
"Firms are hungry for experienced restructuring professionals, who are increasingly in short supply. You need to reach deep into your Rolodex to find people you know who are capable, and you need to move fast." said Richard Shinder, hired by Piper Jaffray in March to help build out its restructuring team.
USB making new all-time highs.
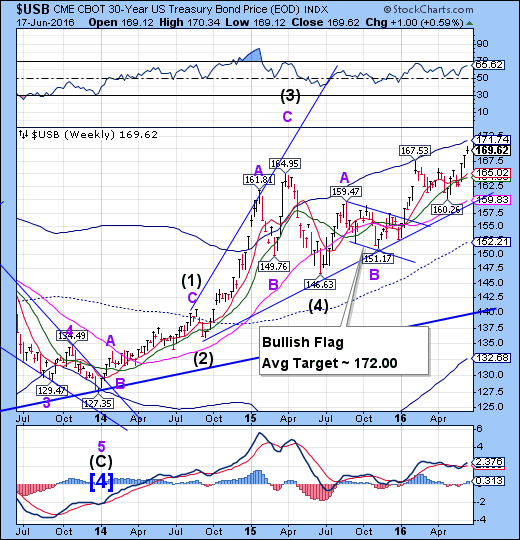
The Long Bond continues its advance to new all-time highs. Its minimum target appears to be its Cycle Top resistance currently at 171.74, but the Bullish Flag target is still anticipated, as the Cycle Top may reach the Bullish Flag target in the next week.
(ChicagoTribune) Global bond fund manager Michael Hasenstab has some of the same worries that shook the stock market last week when legendary investor George Soros said he is preparing for a major decline by buying gold.
Yet, while Soros emphasized that stocks have reached extreme valuations and that the markets could become unhinged by a hard landing of China's economy, Hasenstab said Monday in a keynote speech at Morningstar's annual conference in Chicago that he sees the greatest dangers to investors in U.S. Treasury bonds.
The euro bounces off Long-term support.
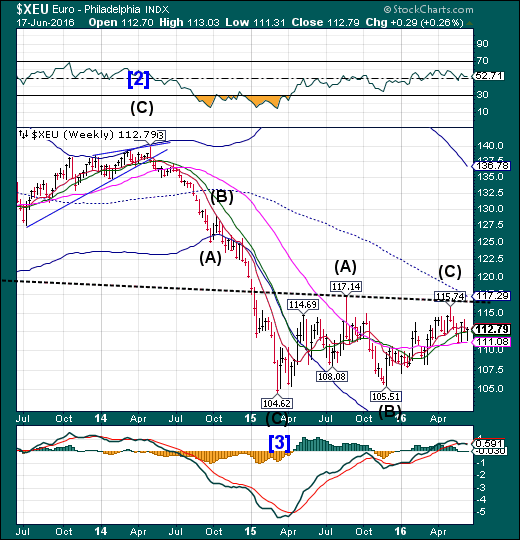
The euro declined from its perch above Intermediate-term support to challenge Long-term support at 111.08. However, it bounced back to its prior level by the end of the week. A continued decline beneath support puts the euro back into a bear market.
(CNBC) A British exit from the European Union could have dire consequences for the euro, Jurrien Timmer, director of global macro strategy at Fidelity Investments, said Friday.
"I always ask the question: Is this systemic? And I've asked this questions many times with Greece and other developments," he told CNBC's "Squawk on the Street." "The two ways that this could potentially become systemic is that if the U.K. goes, [and] I read that, if the U.K., Scotland will have a new referendum, maybe France or Finland or some other country in the euro will have a referendum."
"It could possibly lead to the end of the euro," he said.
EuroStoxx plunges beneath support.
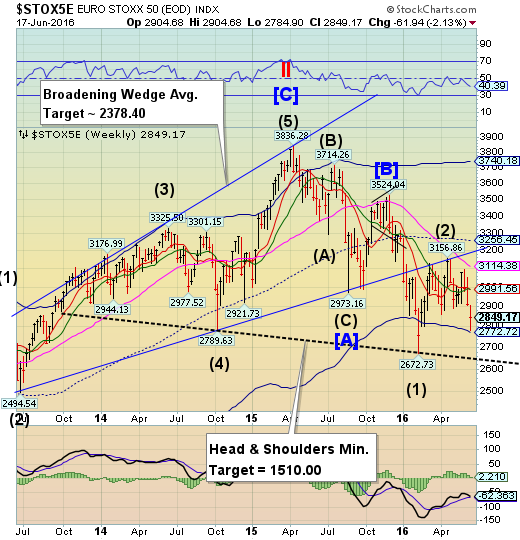
The EuroStoxx 50 Index plunged to its Cycle Bottom at 2772.72. This may not be the “significant low” we have been looking for, but a Trading cycle low of a smaller dimension. A resumption of the decline beneath the neckline at 2620.00 may trigger a stronger sell-off.
(TheStreet) European stocks recovered on Friday as oil and financial stocks rebounded and bond yields slipped.
The FTSE 100 in London was recently up 1.03% at 6,011.81. In Frankfurt the Dax was up 1.07% at 9,652.43 and in Paris the CAC 40 was up 1.15% at 4,200.77.
S&P 500 mini futures were recently down 0.17%.
"Brexit" campaigning by both the "remain" and "leave" camps remained suspended following the shocking murder on Thursday of lawmaker Jo Cox, a pro-remain U.K. lawmaker. Talk of a possible political motivation behind the murder was seen as making a U.K. retreat from the European Union after the referendum on June 23 less likely.
The yen breaks out of its consolidation.
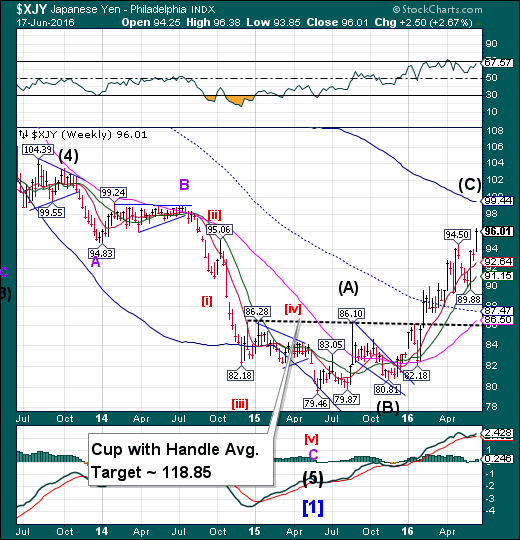
The yen broke out of its two-month consolidation, making new retracement highs. Normally we would see an index retrace as high as its cycle Top, but the cup with Handle formation cannot be ignored. While the Cup-with-Handle target may seem farfetched, the Cycle Top at 99.44 may be attainable as a minimum target.
(Bloomberg) A potential U.K. exit from the European Union next week may have far-reaching implications for the $5.3 trillion-a-day currency market. Add to that list Japan’s currency strengthening to levels that spark speculation about central bank intervention to counter the move.
The yen surged to the strongest in almost two years against the dollar this week as investors sought refuge before the June 23 British referendum. The rally prompted Finance Minister Taro Aso to express concern and call for coordination with foreign counterparts to address what he described as disorderly exchange-rate moves.
The Nikkei plunges through support.
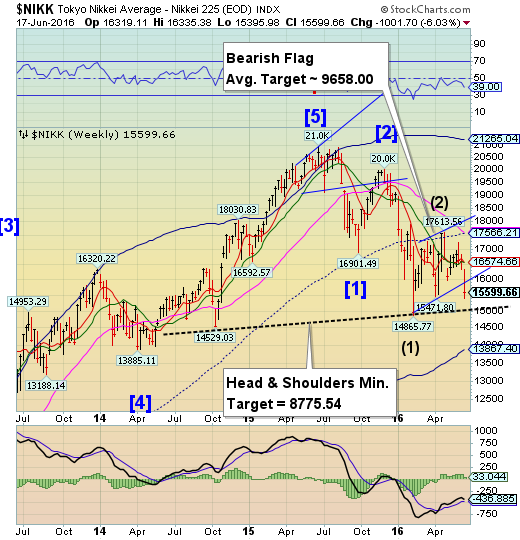
The Nikkei gapped below its Intermediate-term support at 16574.66, triggering the Flag formation as well. The panic may have begun as the next support appears to be the Head & Shoulders neckline near 15000.00, followed by the Cycle Bottom at 13867.40.
(WSJ) Stocks in Japan rose from a four-month low and led most Asian markets higher on Friday, although worries about the upcoming U.K. vote on European Union membership left the region’s markets badly bruised for the week.
The Nikkei Stock Average closed up 1.1%, while both the Hang Seng Index was up 0.7% and Shanghai Composite Index rose 0.4%. Australia’s S&P ASX 200 finished up 0.3%.
The Nikkei finished the week off 6%, marking its worst weekly performance since the week ended Feb. 12. Hong Kong was headed to lose over 4%, while the Shanghai finished down 1.1% for the week.
U.S. dollar challenges Intermediate-term resistance, fails.
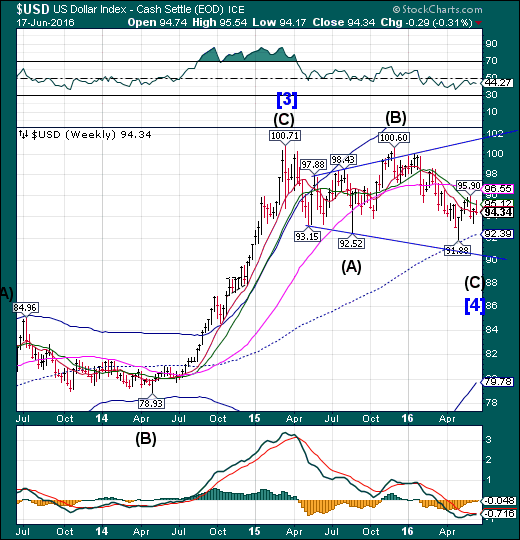
USD challenged Intermediate-term resistance at 95.12 before falling away, closing beneath it and short-term support/resistance at 94.51. What may follow is a decline to retest the mid-Cycle low and possibly the lower trendline near 90.50. The Cycles Model suggests the final low to occur in early July.
(Reuters) Speculators favored the U.S. dollar for a fourth straight week, but reduced their net long positions by more than $8 billion, according to data from the Commodity Futures Trading Commission released on Friday.
The value of the dollar's net long position fell to $2.72 billion in the week ended June 14 from $11.3 billion the previous week.
Gold completes a Broadening Top.
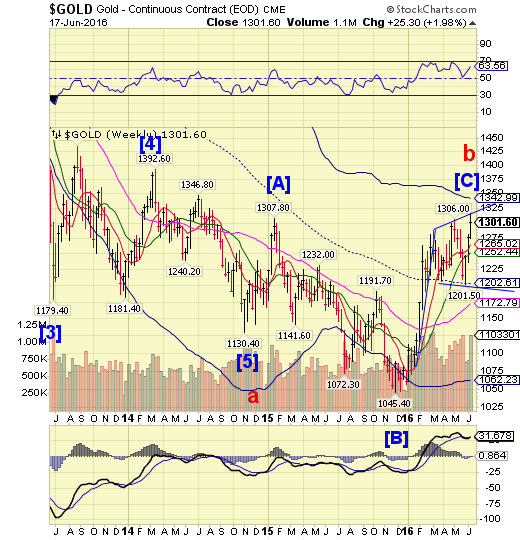
Gold appears to have completed point 5 in an Orthodox Broadening Top formation. While it may go briefly higher, the main property of a Broadening formation is an abrupt decline well below the lower trendline, at least to the Long-term support at 1172.79.
(Reuters) Gold rose more than 1 percent on Friday, supported by a softer dollar and cautious
interest rate comments by a voting U.S. Federal Reserve policy member, and was headed for a third week of gains. The U.S. dollar made its biggest drop against a basket of major currencies in two weeks, making dollar-denominated assets such as gold cheaper for holders of other currencies.
Spot gold was up 1.2 percent at $1,293.80 an ounce at 3:02 p.m. EDT (1902 GMT). Bullion has risen 1.5 percent so far this week.
U.S. gold for August delivery settled down 0.3 percent at $1,294.80 an ounce, well below Thursday's peak of $1,315.55, the highest since August 2014.
Crude declines beneath the Pennant trendline.
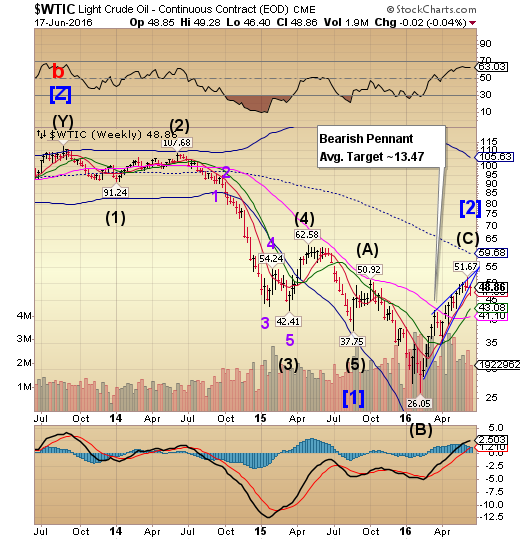
Crude declined beneath the Bearish Pennant trendline, then bounced back for a retest. This is viewed as a sell signal for crude. It suggests an initial drop to challenge the prior low at 26.05 with a more substantial decline to follow.
(ZeroHedge) With oil prices are already sliding quite markedly, it seems traders are questioning demand assumptions (as growth hopes fade), and with the oil rig count now up for 3 weeks in a row (up 9 to 337 this week) it appears supply expectations may not be helping either. The last 3 weeks have seen 21 oil rigs added (the most since Aug 2015) and the biggest percentage rise in oil rigs since Aug 2010.
Shanghai Index loses its Cyclical supports.
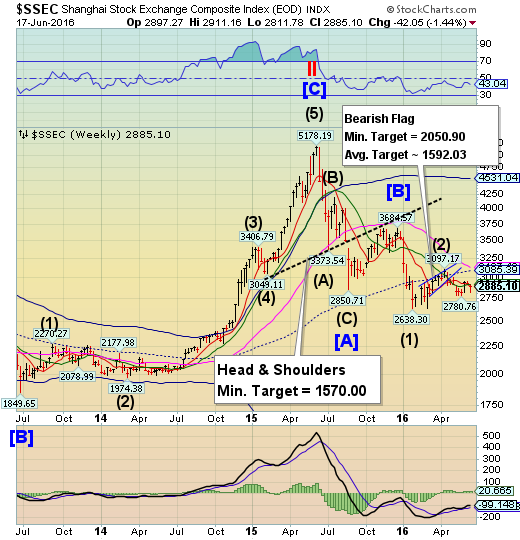
The Shanghai Index fell below Short-term support/resistance at 2892.02 and was not able to regain it by the end of the week. The Cycles Model suggests that weakness may dominate through the end of the month. The Model suggests a possible two week decline to new lows.
(ZeroHedge) China's tremendous credit expansion from the first quarter of 2016 is now ancient history.After the creation of $1 trillion in aggregate credit, or Total Social Financing, in just the first three months of the year, last month China slammed the brakes on new credit creation, when every aspect of credit growth came solidly below expectations. Then overnight we got the latest, May, data. It confirmed that after the record Q1 credit deluge, the PBOC is now scrambling to slow down the tremendous debt tidal wave.
The Banking Index declines beneath the Pennant trendline.
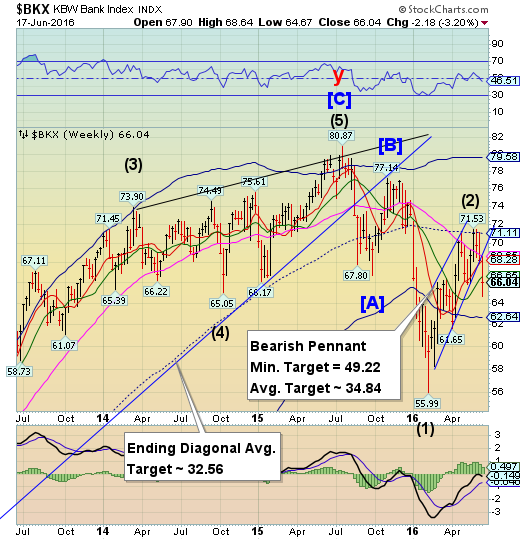
BKX declined beneath its bearish Pennant trendline, closing also beneath Intermediate-term support at 66.65. This confirms the BKX sell signal. The bounce late in the week did not recover the majority of the losses. The Cycle Bottom support at 62.64 may not be capable of providing the next bounce.
(Tumblr) Already plumbing multi-year lows, European banks are threatening to fall off another chart “cliff”.
We have written several posts regarding the significant challenges that face U.S. bank stocks from a technical perspective (see our May 21 post, “Rate Hike? This Chart Says Don’t ‘Bank’ On It”). However, their struggles pale in comparison to their counterparts across the pond. There has been quite a bit of focus on the European banks’ positioning at the epicenter of global economic financial risk, whether it’s loan exposure or derivative exposure. We’ll let others debate that issue and stick to the technicals. Unfortunately, the charts would appear to fully match the cautionary exposure rhetoric.
(ZeroHedge) From 2010-2015, Bank of America (NYSE:BAC) has racked up an absolutely stunning $51.6 billion in litigation expense, placing the bank head and shoulders above its peers.
Which is why when the law firm of Cravath, Swaine & Moore LLP announced that it was boosting starting pay for its junior-most lawyers to $180k, causing many other law firms to do the same, BAC's global general counsel David Leitch took action.
Upon learning of the news, Leitch sent an email to law firms which according to the WSJ, handle the bank's litigation. In short, Leitch said that if any firm expects to be passing on costs due to wage increases, they can forget about it because the bank isn't paying.
(ZeroHedge) A few months ago we pointed out that mass layoffs were coming for bankers due to declining revenues and more difficult market conditions, and now we're seeing the first major wave of that come to fruition.
Bank of America (NYSE:BAC) has announced that it will fire as many as 8,000 employees within its consumer division the FT reports. The core reason given for the headcount reduction in this instance is that digital banking is picking up the pace, and has reduced the need for "back office staff" and bank tellers.
This is a trend that BofA highlighted in its In its Q1 earnings press release, as the bank showed that mobile banking users had shot up 15% y/y.
(CNBC) Leading investment banks in the U.S. face certain fallout in the event that the U.K. leaves the European Union, with thousands of staffers set to see their jobs impacted.
That's the sentiment from a Keefe, Bruyette & Woods report, which says banks may have to increase expenses, shed staff and take a temporary earnings hit if U.K. voters approve the Brexit on June 23. Should the leave vote prevail, big banks would have to transition London staffers to cities in the EU to meet regulatory requirements, a large burden for the firms to shoulder.
(WSJ) The dangers of ‘Brexit’ are infecting banks across Europe, especially in the south, but investors may be overdoing the stampede.
Share prices for some of the continent’s largest institutions, such as Credit Suisse (SIX:CSGN), Deutsche Bank (DE:DBKGn) and Unicredit (DE:CRIH), have in the past week hit lower levels even than during the financial crisis. But the steepest falls in June have been among mainly Italian, Greek and Portuguese lenders.
