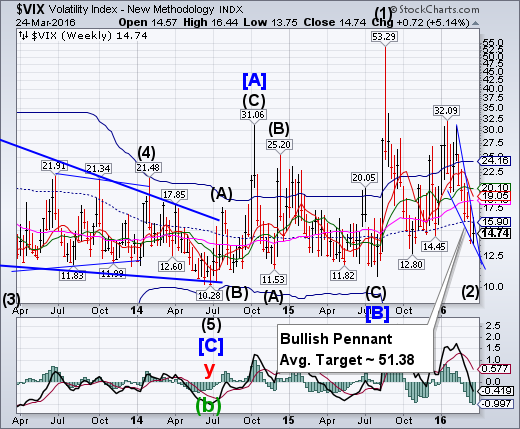
VIX began a rally from its Master Cycle low on March 18. An aggressive buy signal (NYSE sell signal) may be made with a rally back above mid-Cycle resistance at 15.90.
(Barrons) Lots of market-watchers are talking about the recent plunge in the CBOE Volatility Index (VIX). The VIX, an options-based measure of market expectations for future price swings in the S&P 500, just had its sharpest 25-day decline on record, says MKM Partners’ derivatives strategist,Jim Strugger. The VIX fell from 28 on Feb. 11 to 14 last week. The decline means that demand for short-term options protection fell fast while U.S. stocks roared higher.
Is a plunging VIX an all-clear signal for stocks? Not quite. Just as analysts struggle to find meaning in the S&P 500′s swift, double-digit rebound since early last month, so too are VIX watchers wrestling with the meaning of the drop in the market’s “fear gauge.” As noted earlier, Katie Stockton at BTIG sees the slump in the VIX as a worrisome sign that the rebound rally could be nearing an end.
SPX closes at the 4.3-year trendline.
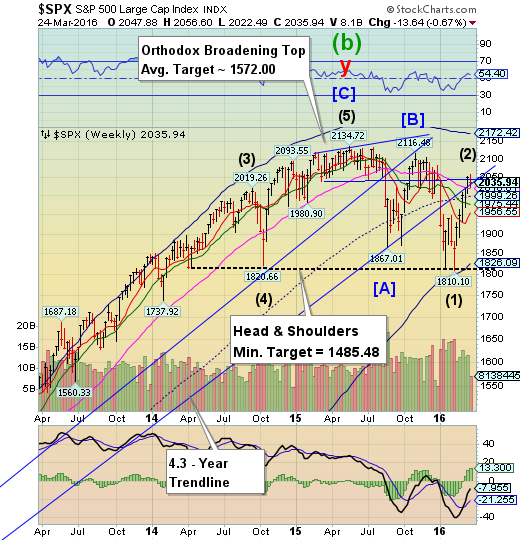
The SPX challenged the trendline of the Orthodox Broadening Top formation, but closed at the 4.3-year trendline at 2035.00. This trendline was originally broken on January 6, in the decline to the January 20 low. Trendlines are important support areas that often attract, then repel the markets. This quarter’s stock buybacks are coming to a close as earnings season approaches.
(SeekingAlpha) The Federal Reserve often wonders why corporations don't invest more in their businesses.
It's certainly made an effort to spur such spending, keeping interest rates ultra-low for many years now.
And the low rates have had a dramatic effect on corporations. But not in the way the Fed anticipated. And not in a way that bodes well for the future...
Corporations have indeed gone on a borrowing binge. But they haven't been investing that borrowed money in the future. Instead, it's largely been spent on the financial engineering practice commonly known as stock buybacks.
NDX ends week beneath Long-term resistance.
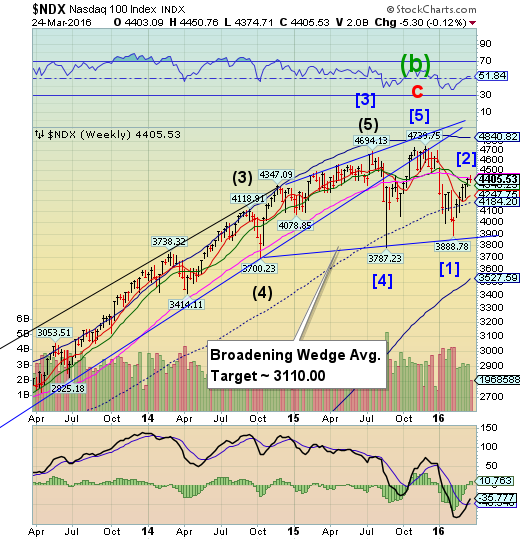
NDX completed a 66% retracement at 4450.76 on Tuesday before settling beneath weekly Long-term resistance at 4419.42. Should it decline beneath weekly Intermediate-term support at 4346.23, NDX maybe on a sell signal.
(WSJ) The stock-market rally has left the Nasdaq behind.
While the Dow Jones Industrial Average and the S&P 500 have recovered from drops earlier this year, the Nasdaq Composite Index still is in the red. The index chipped away at its deficit with a 0.3% gain Tuesday, as the Dow industrials and S&P edged lower, but the Nasdaq remains down 3.7% in 2016.
High Yield Bond Index makes a new high.
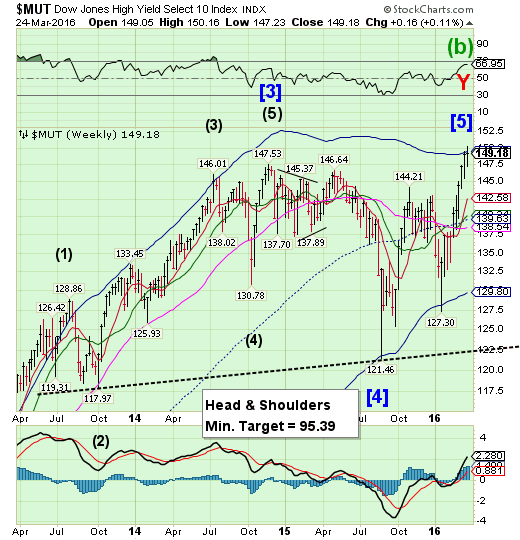
The High Yield Index also made its high on Tuesday before falling back beneath its Cycle Top resistance at 149.47. This may mark the end of an era for high yield bonds. But we won’t get any cautionary notes from the media and their analysts. See below.
(MarketRealist) On the back of the improving US economy and market sentiments and the Fed not being in a hurry to tighten the monetary policy, high-yield bond funds stand to gain. They offer an attractive investment opportunity to investors. Even positive performance in the equity markets boosted the high-yield bond market.
The fear of a recession faded because consumer spending increased at the fastest pace in eight months this January. New orders for manufactured goods increased in January following two consecutive monthly declines. Meanwhile, jobs data in February painted a solid picture of the labor market. The housing industry remained firm.
The euro consolidates.
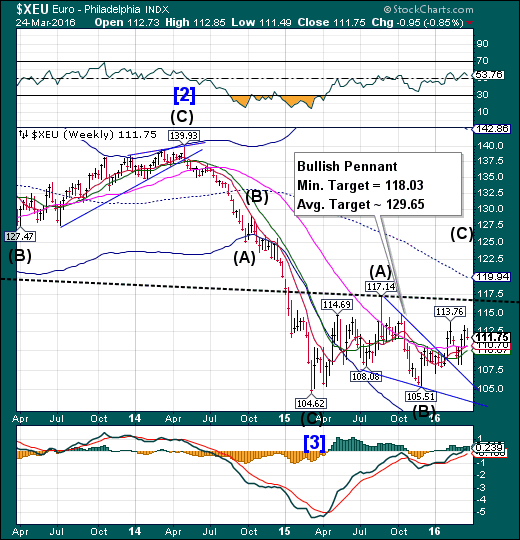
The euro appears to be consolidating before its next move. The Cycles Model suggests another week of consolidation or decline before the rally continues. An untoward event may push the decline toward the trendline of the Pennant formation..
(ProfitConfidential) Whereas the European Central Bank’s (ECB) continued monetary easing was not enough to make a major dent in the EUR/USD exchange rate, Tuesday’s bombings in Brussels might. The euro to dollar exchange rate is now US$1.12, edging ever closer to parity. The latest geopolitical and economic indicators suggest EUR/USD at US$1.00 is coming. Growing rumors of the Fed preparing two more rate hikes in 2016 have all but made parity a certainty.
On Tuesday, the euro was dropping because of terrorism. On Wednesday, the euro continued dropping because of the more hawkish members of the Fed. In fact, while Europe keeps being distracted by migration problems and increasing terrorism fears, economic sentiment in the United States is bullish, as shown by the latest data from the Fed published last week. The reaction to the attacks in Brussels shows that the euro has lost its appeal as a safe haven.
EuroStoxx sells off .
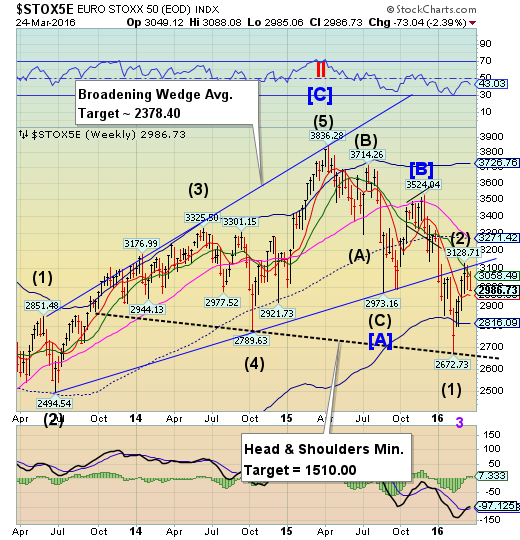
EuroStoxx choked at the trendline of the Broadening wedge formation and Intermediate-term resistance at 3088.92 before closing lower in an inside week. Failure at these resistance levels may signal a change in trend, while crossing beneath Short-term support at 2963.89 confirms a probable sell signal. The Head & Shoulders neckline defines the potential magnitude of the decline.
(BusinessInsider) European stocks went into the Easter weekend in negative territory after a day which saw the biggest share indexes fall substantially.
Markets in Europe had been subdued on Wednesday as investors continued to react to the terrorist atrocities in Belgium, but something of a normal service resumed on Thursday, and stocks fell sharply.
Losses were generally between 1%-1.5%, but some indexes saw falls of even more. France's CAC 40 was the biggest loser on the day, off by 2.11% to close at 4,330 points, dragged down by a variety of stocks. Banking group Societe Generale (PA:SOGN) propped up the index, down 4%.
The yen testing its support.
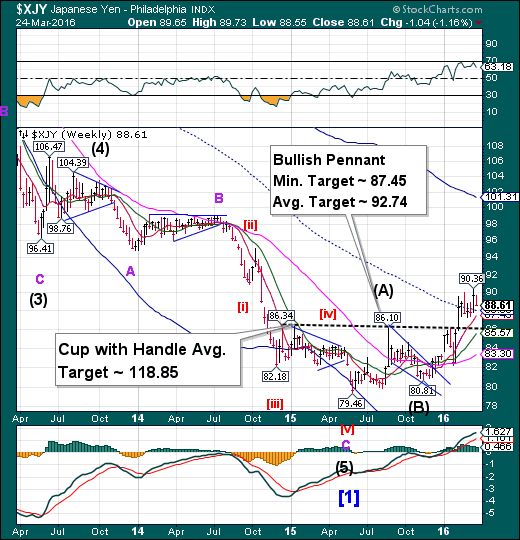
After making a new high last week, the yen pulled back, possibly for a retest of mid-Week support at 88.06. Despite the pullback, the period of strength may last for another week or longer. The next target appears to be the average for the Bullish Pennant, but it may not stop there.
(BusinessInsider) Japanese manufacturers' confidence probably deteriorated to the lowest in nearly three years and it is expected to worsen in the coming quarter due to exporters concern over a strong yen and worries over the global economy, a Reuters poll showed.
Big firms are likely slash their capital spending plan for the new fiscal year beginning in April, according to the survey.
Firms tend to be cautious in their spending plans at this time of year, but concern over the outlook for profits makes it unlikely that they will become more ambitious in their capital expenditure budgets later in the year, analysts said.
The Nikkei declines away from mid-Cycle resistance.
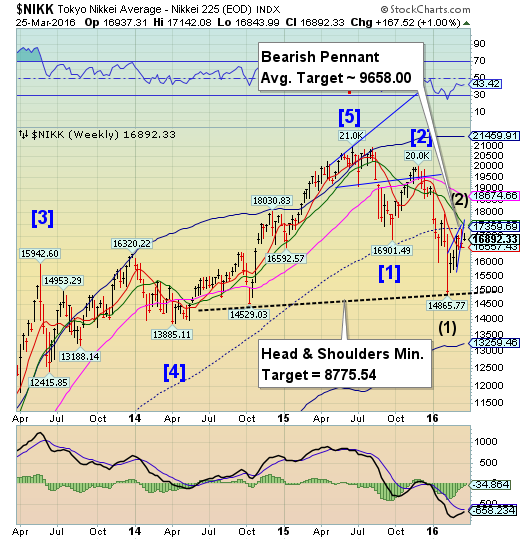
The Nikkei stalled again beneath mid-Cycle resistance and reversed lower after reaching 17291.35 on March 14. Should Short-term support at 16557.43 be broken, we may see the decline continue through the second week of April. Crossing the neckline may be instructive regarding its ultimate target.
(JapanTimes) Stocks lost further ground Thursday, weighed down by an overnight fall in U.S. equities, sending the key Nikkei average below 17,000.
The 225-issue Nikkei lost 108.65 points, or 0.64 percent, to close at 16,892.33 on the Tokyo Stock Exchange, its first finish below 17,000 in three days. On Wednesday, the key market gauge shed 47.57 points.
The Topix index of all first-section issues ended down 9.59 points, or 0.70 percent, at 1,354.61, after falling 5.73 points the previous day.
U.S. dollar bounces.
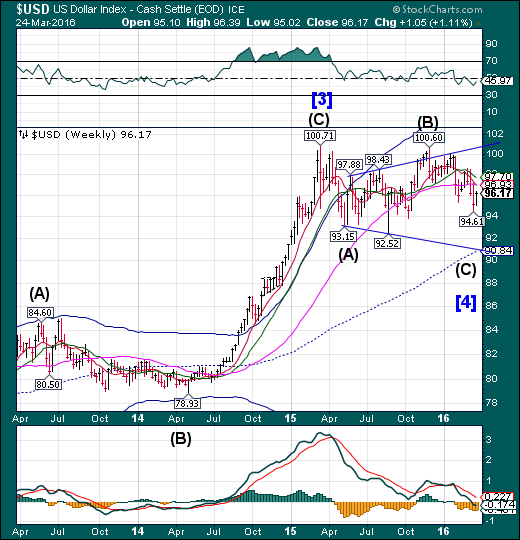
USD bounced after making a new low. The Cycles Model suggests the decline may not be over, perhaps lasting through mid-May. It may finally turn traders bearish the dollar. The ultimate target for USD may be the weekly mid-Cycle support at 90.84.
(Bloomberg) The dollar has work to do to convince traders that its first weekly gain in a month wasn’t a fluke.
A gauge of the U.S. currency rose the most since November this week after Federal Reserve officials signaled interest-rate increases may not be far off. Next week’s March jobs report, which is forecast to show a 207,000 gain in nonfarm employment, will help determine whether the greenback can sustain its rebound from a nine-month low reached on March 17.
USB may turn higher.
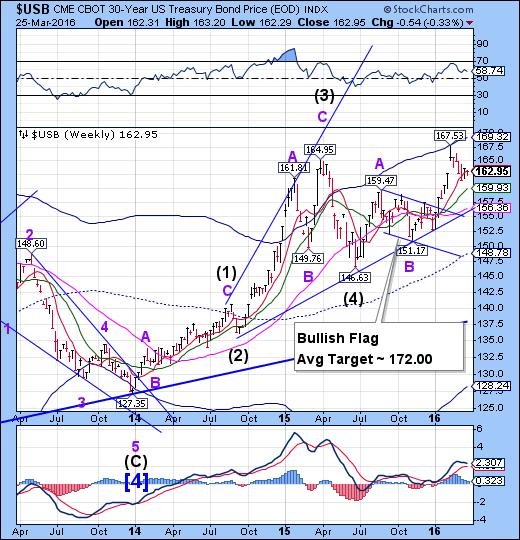
The Long Bond continues to challenge Short-term support at 163.29, but closed beneath it in another inside week. USB appears to be due for yet another high. Over the next week or two we’ll be looking for the all-time high in Treasuries.
(ZeroHedge) Safe haven buying is ignoring precious metals and piling into bonds today with the long-end notably outperforming (-6bps) today. This has compressed the yield curve even more, putting more and more pressure on the "rate-hike environment" hopers who bought banks like they were told...
Gold tests mid-Cycle support.
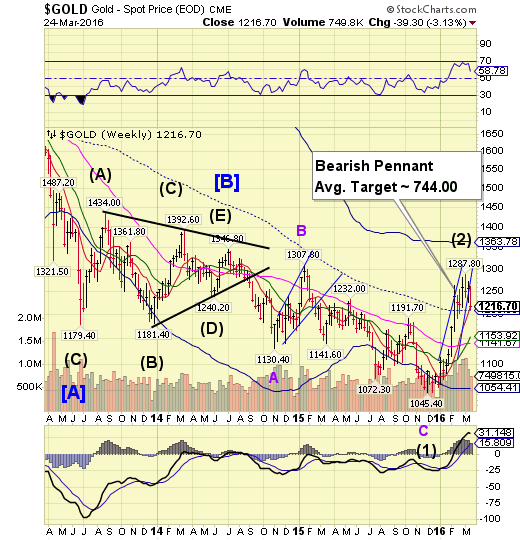
Gold weakened, challenging weekly mid-cycle support at 1209.09. The period of strength has run out, suggesting new lows may be on their way. Once complete, formations are completely retraced, leaving this move as a potential false breakout within the downtrend. The media is still bullish.
(CNBC) Investors shouldn't get too worried about the recent pullback in gold, according to Todd Gordon of TradingAnalysis.com.
As gold closed out its worst week of 2016 last week, Gordon said prices should be bolstered by key technical support, creating an opportunity for investors to buy. Additionally, he believes that inaction from the Federal Reserve will drive gold prices higher as investors expect lower interest rates.
"I don't think the Fed is going anywhere, which makes the gold market a buy on this pullback," he said Thursday on CNBC's "Trading Nation."
Crude challenged at the Bearish Flag.
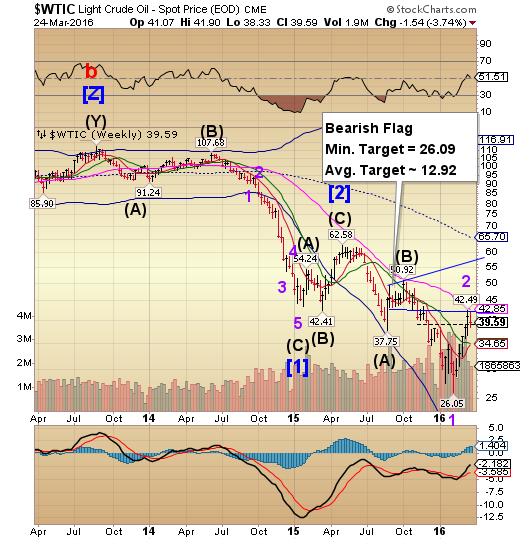
Crude reversed without challenging Long-term resistance at 42.85. A break of secondary support at 38.50 suggests the decline is underway. Weakness may extend through mid-April, with Cycle Bottom Support continuing to fall away at 14.50, lending support to the average target analysis of the Bearish Flag. Analysts won’t be calling for a bottom when it finally arrives.
(24/7WallStreet) The U.S. Energy Information Administration (EIA) released its weekly petroleum status report Wednesday morning. U.S. commercial crude inventories increased by 9.4 million barrels last week, maintaining a total U.S. commercial crude inventory of 532.5 million barrels. The commercial crude inventory stands at historically high levels for this time of year, according to the EIA.
Tuesday evening, the American Petroleum Institute (API) reported that crude inventories rose by 8.8 million barrels in the week ending March 18. For the same period, analysts had estimated an increase of 2.7 million barrels in crude inventories. API also reported gasoline supplies fell by 4.3 million barrels and distillate stockpiles fell by 391,000 barrels.
Shanghai Index continues to challenge mid-Cycle resistance.
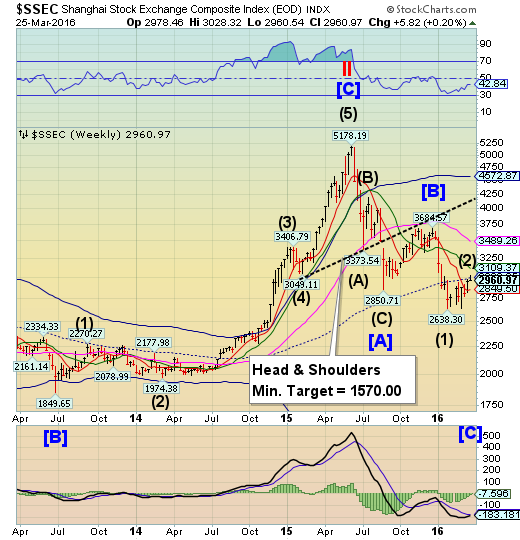
The Shanghai Index continues to challenge mid-Cycle resistance at 2993.25, but has not closed above it. The Cycles Model calls for a final probe higher early next week. A reversal to new lows may follow.
(ZeroHedge) Last June, China’s stock market miracle ended in tears. The SHCOMP’s inexorable, parabolic ascent was to a large degree facilitated by an explosion of margin debt, the likes of which could not be found in any other major market across the globe. For instance, by the end of June, the outstanding balance of margin transactions as a percentage of the SHCOMP’s free float market cap was nearly 14% compared to just 5.5% for the S&P and less than 1% for the TOPIX.
A dramatic unwind in the half dozen backdoor margin lending channels that had funneled an additional CNY1.5 trillion into equities brought the party to a thunderous end and by late July, the market was off by more than 30% from its peak.
Chinese officials had already begun to panic by mid-month and then, on the 27th, the bottom fell out.
The Banking Index makes a nominal new high.
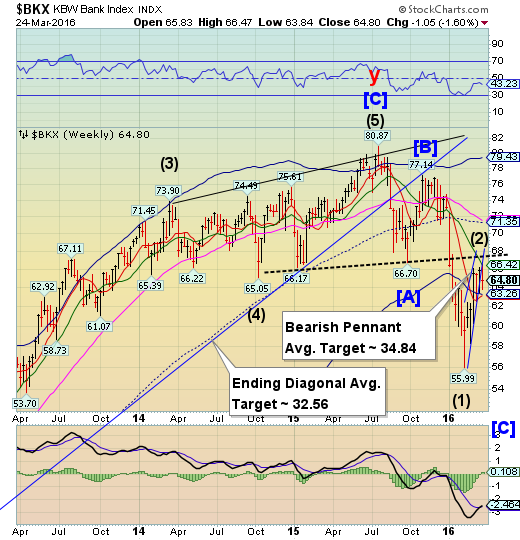
BKX made a nominal new high on Monday, challenging Intermediate-term resistance at 66.42 but was not capable of meeting the old Head & Shoulders neckline. There may be a final attempt at a new high early next week before a reversal that may challenge Cycle Bottom support at 63.20.
(CNBC) Top Wall Street executives have a big challenge in this year's regulatory exams, which banks are expected to complete in coming days.
For the first time, they have to factor in the possibility that the Fed reverses course and embraces negative interest rates — which will pile new stress onto banks in the regulators' list of Systemically Important Financial Institutions, or SIFIs. But the hypothetical scenarios, if they ever merge with reality, won't just create headaches on Wall Street. Banks may have no choice but to pass some of the effects of negative interest rates on to their customers, from large corporate accounts to consumers on Main Street.
(ZeroHedge) By now it is common knowledge that when it comes to massive, taxpayer-backed hedge funds, few are quite as big as the Swiss National Bank, whose roughly $100 billion in equity holdings have been extensively profiled on these pages, including its woefully investments in Valeant (NYSE:VRX) and the spike in its buying of Apple Inc (NASDAQ:AAPL) stock at its all time high.
But while the SNB's stock holdings are updated every quarter courtesy of its informative SEC-filed 13F (we wish the Fed would also disclose the equities it holds courtesy of its Citadel proxy), getting a glimpse of the flow is more problematic, and involves waiting for the hedge fund's, pardon central bank's annual report.
Earlier today patience was rewarded when the SNB filed its 108th annual report, in which it disclosed that it spent CHF 86.1 billion or $88 billion, on current interventions last year, a measure of its efforts to shield the economy from deflation.
(ZeroHedge) Earlier today, Canada's new Liberal government unveiled a stimulus budget meant to revive slumping growth with a surge in infrastructure spending and said it would run a deficit nearly three times larger than promised during last year's election.
The government projected a C$29.4 billion ($22.5 billion) deficit for fiscal 2016-17 and gave no target date for returning to a balanced budget. This budget broke virtually all pledges the Liberals made before the election, including running just three years of deficits of up to C$10 billion before balancing the books by fiscal 2019-20.
"We are seizing the opportunity to invest in people and the economy, and to prepare Canada for a brighter future," Finance Minister Bill Morneau said.
Disclaimer: Nothing in this email should be construed as a personal recommendation to buy, hold or sell short any security. The Practical Investor, LLC (TPI) may provide a status report of certain indexes or their proxies using a proprietary model. At no time shall a reader be justified in inferring that personal investment advice is intended. Investing carries certain risks of losses and leveraged products and futures may be especially volatile. Information provided by TPI is expressed in good faith, but is not guaranteed. A perfect market service does not exist. Long-term success in the market demands recognition that error and uncertainty are a part of any effort to assess the probable outcome of any given investment. Please consult your financial advisor to explain all risks before making any investment decision. It is not possible to invest in any index.
The use of web-linked articles is meant to be informational in nature. It is not intended as an endorsement of their content and does not necessarily reflect the opinion of Anthony M. Cherniawski or The Practical Investor, LLC.
