- Global equity index falls below uptrend line, completes bearish pattern
- Asian stock benchmark also establishes downtrend with falling peaks and troughs
- European measure falls below uptrend line but is not yet in downtrend
- US indices, including Dow Jones, still in uptrend since February low
- US inflation reaches Fed target, but consumer spending disappoints
- Flattening yield curve signals potential recession
- Oil jumps to highest level on smaller production increase than expected but market still unbalanced
- Bitcoin struggles after posting fresh lows
- Dollar enjoys positive interest rate differentials and safe haven status.
US major indices gained on Friday, but just barely. The Dow Jones finished the day higher by 0.23%, the NASDAQ Composite was up a miniscule 0.09% and the S&P 500 eked out an even tinier increase of just 0.08%. Still, on a weekly basis both global and US stocks extended their declines.
The ongoing dispute between the US and its major trading partners dominated global market sentiment, but slowing economies in Europe and Asia also contributed to the headwinds. Though the US's Federal Reserve has accelerated its path to higher interest rates in acknowledgement of the US's still expanding economy, central banks in Europe and Asia have stayed behind.
From an investor perspective however, as long as the US economy continues to percolate and stocks maintain their upward trajectory, we remain bullish on US markets. Of course, that doesn't mean events already in play, such as the accelerating trade fight, won't add uncertainty going forward.
US Equities Outperform Global Markets
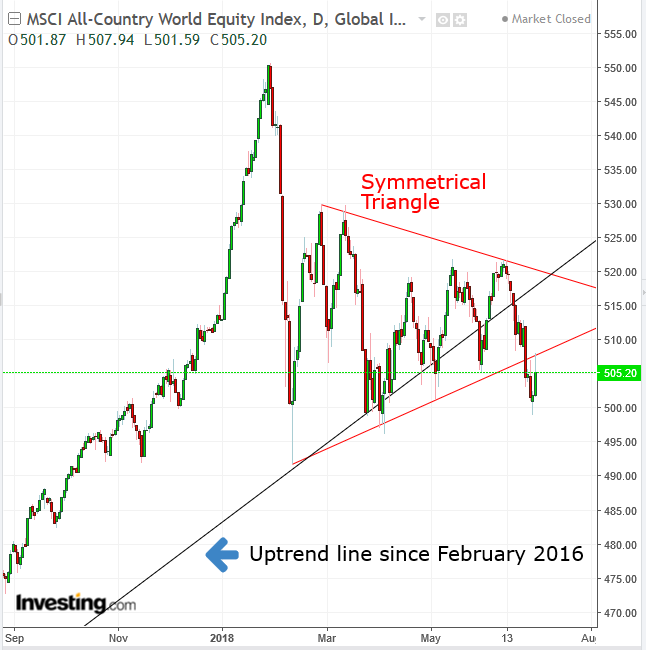
US equity indices have a strong advantage over non-US benchmarks at the moment. While European, Asian and even global indices have all fallen below their uptrend lines since the February bottom, US benchmarks have not.
In the chart above, of the MSCI All-Country World Equity Index, it's clear a struggle between bulls and bears ensued on the uptrend line since the February 2016 bottom. The two opposing forces demonstrated equal determination, forming a symmetrical triangle (red). However, the downside breakout—whose resistance was successfully tested on Friday—indicates that supply is currently outpacing demand.
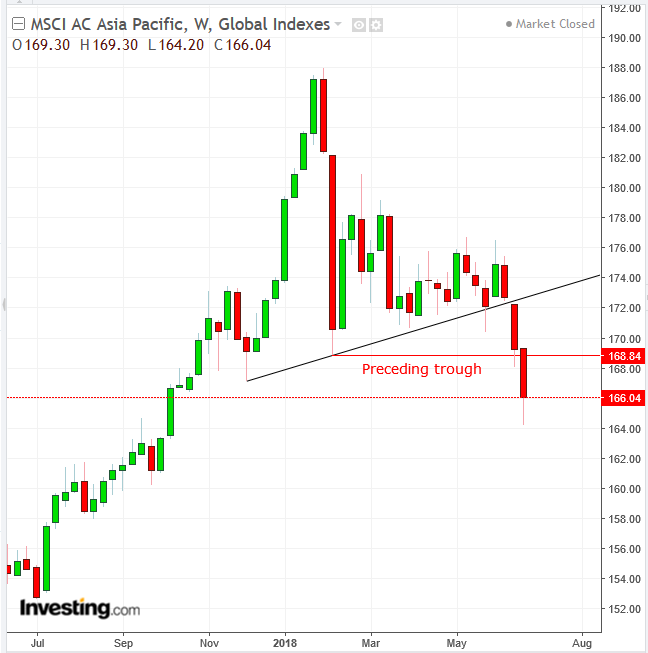
But Europe has the upper hand over Asia. While Asian benchmarks reversed into downtrends, posting a descending series of peaks and troughs, Europe continues holding on to its prior uptrend.
The MSCI AC Asia Pacific Index completed a top on June 18, after which, on June 19, it proceeded to cross below its uptrend line since February 2016 and successfully test it on June 20. Finally, on June 25 it fell below June 25 its low of February 8, completing a downtrend with two descending peaks and troughs.
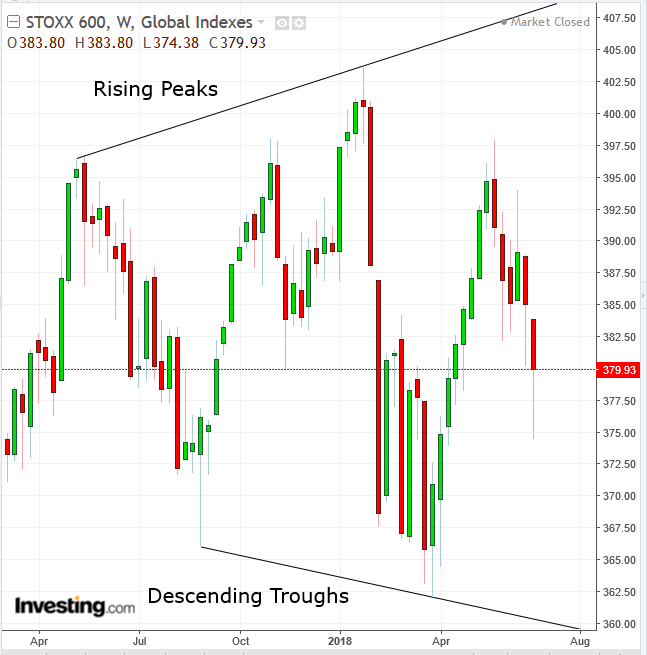
To be clear, while the pan-European STOXX 600 fell below its uptrend line, raising a red flag to the trend’s integrity, it has yet to post at least two falling peaks and two falling troughs, which would mean it had reversed into a downtrend. A pattern which includes rising peaks and falling troughs is considered a bearish pattern, called a Broadening Pattern; it's generally found at market tops. However, it requires a decisive downside breakout to be confirmed.
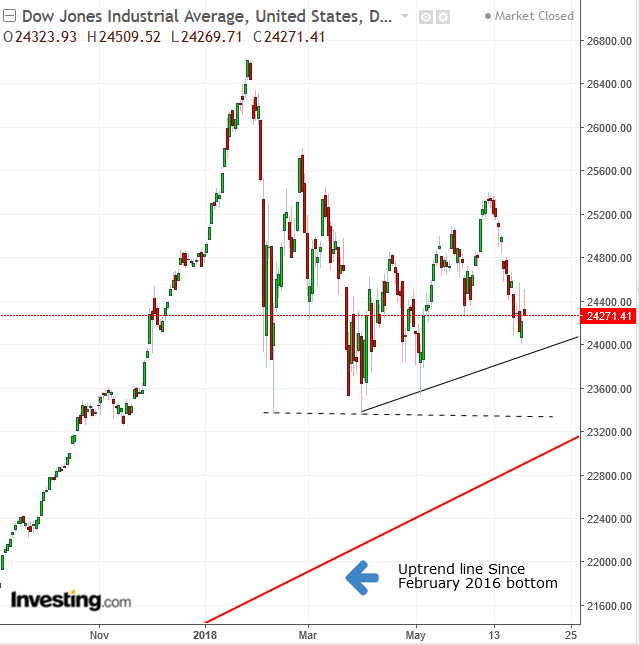
The US majors are the global equity outperformers among major world benchmarks. US equity indices remain above their uptrend line of the same period, including the Dow Jones Industrial Average, which has been the hardest hit due to the multi-national mega cap firms listed on the index being reliant on exports for growth.
Given that many analysts believe the possible adverse effects of a trade war on the US economy would only be temporary, it’s conceivable that US investors are holding on until the storm passes. While that doesn’t sound very promising for US stocks, now in the ninth year of a bull market that's the second longest since WWII, they are still easily outperforming other regions.
Economy Looking Up?
As for the US economy, things are looking rosy, at least based on some of the most high profile releases. The Fed's 2 percent inflation target has been met, the first time since April 2012. Unemployment is at an 18-year low; personal income rose 0.4 percent in May, up from 0.2 percent in the prior month while wages increased 0.3 percent.This appears to confirm what Fed Chair Jerome Powell said during the June 13 FOMC meeting: “The economy is doing very well.”
However, consumer spending, which accounts for more than two-thirds of U.S. economic activity, rose only 0.2 percent last month, the Commerce Department reported. Data for April was also revised down to show spending rising 0.5 percent instead of the previously reported 0.6 percent jump. So, where has all that money gone?
Savings climbed $482 billion last month from $448 billion in the prior month, rising to a rate of 3.2 percent from 3 percent. This could suggest that consumers are losing their nerve, beginning perhaps to fear the pessimistic headlines about the end of global growth because of the roiling trade war.
Supply-Demand Balance Of Stocks As Leading Indicator
Nonetheless, all we really have to go on is the supply-demand balance of stocks, which many see as leading indicator ahead of economic reversals. While the S&P 500 slipped for a second straight week, it gained for a third straight month. The Dow Jones Industrial Average slumped for a third consecutive week, as well as on a monthly basis, ending a two-month advance. And much like the S&P, the NASDAQ Composite posted a second consecutive weekly decline within a third straight monthly advance. The Russell 2000 fell, its first weekly loss within a four-straight-month advance.
Non US indices have been decisively more bearish. The STOXX 600 fell for a second straight week,the fifth out of a total six weeks, its second monthly decline. The MSCI AC Asia Pacific Index fell for a third straight week, a second straight month of losses. Finally, the MSCI All-Country World Equity Index suffered a third consecutive weekly decline as well as a second straight monthly setback.
Having said all that, the argument in support of an ongoing US bull market because of the robust economy could also be used to bolster the claim that US markets are now signaling they've reached a top. After all, as the old adage goes, a candle burns brightest just before it goes out. This could also be supported by the red flag we have been waving about the yield curve, even as we continue to maintain our bullish posture.
The yield differential between the US 10-year and 2-year notes is now 32.8 basis points, the narrowest gap since 2007. Geopolitical concerns have been driving investors out of risk. They've been rotating into the security of Treasuries, which has been weighing on long-term yields.
As well, short-term interest rates have been propping up shorter term notes. Investors are concerned that the Fed’s increased outlook for rate hikes, against falling long-term yields, will cause the yield curve to invert. This would be a perversion of the economic balance: short-term commitments generally don't provide higher yields than longer term commitments. This is usually considered a solid signal of an upcoming recession.
However, even if that turns out to be the case, statistically it generally takes five quarters from the time of the signal for a recession to emerge. Moreover, since we can't foretell the future, we must stick with the evidence we're seeing. The US economy is (still) booming, and despite all the potential worries being thrown at US investors, they have staunchly held the equity line.
We therefore remain bullish and consider the recent dip nothing more than a buying opportunity. This may just be the point at which the market shakes off weak investors while the smart money beefs up their holdings—along with attracting foreign investors looking for greener pastures. If that's the case, we should be seeing a stronger, more sustainable rally ahead, one in which the S&P 500 and Dow Jones would take on their January records, joining the NASDAQ and Russell 2000 which have already done so.
Oil, USD Move Higher, Bitcoin Struggles
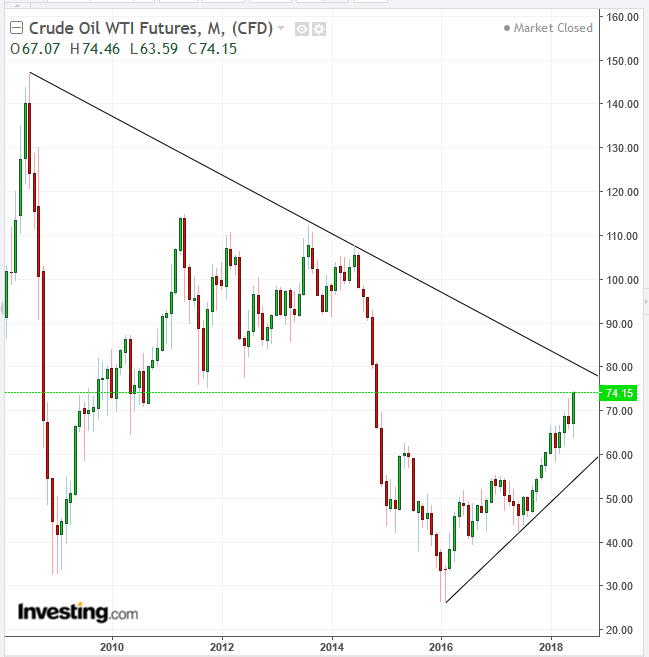
Oil prices pushed higher last week, to $74.15, the highest level for the commodity since 2014. The driver was OPEC raising production caps which one would intuitively think should instead lower prices. However, because some members are already pumping at maximum capacity, the purported output increase of only 1 million barrels a day isn’t realistically expected to exceed 700,000 barrels a day, an output increase that won’t be enough to balance supply and demand within the oil market.
Technically, while oil trades in an obvious uptrend since the 2016 bottom, it is nearing a macro downtrend at the $80 level, in place since the mid-2008 peak of just under $150. Will the shorter, two-year uptrend overcome the longer 10-year downtrend?
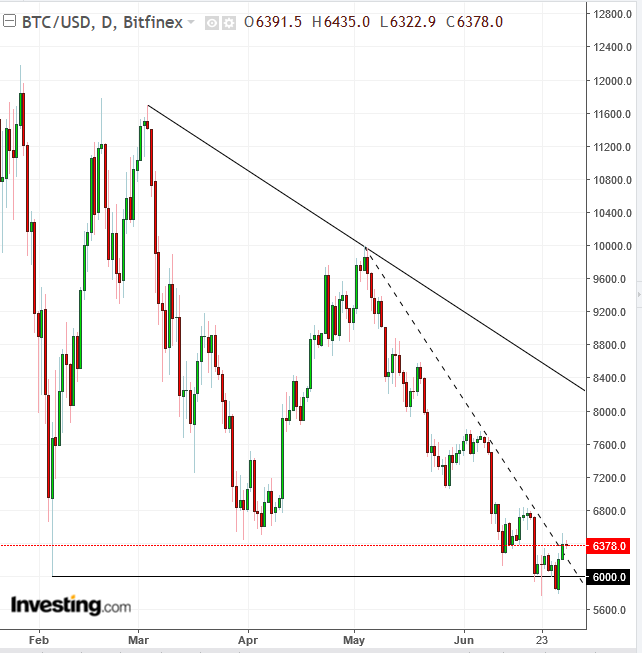
Bitcoin can't seem to catch a break. Even with the recent good news for the asset class that Austria has made crypto currencies available at over 400 post office branches and 1,300 post partners, the currency still couldn't gain much traction. It wasn't helped either by rumors that a flood in Sichuan China destroyed local Bitcoin mining centers.
Technically, the most popular cryptocurrency by market cap posted a fresh intraday low of $5,762.9 on Saturday before last, officially reversing into a downtrend. Bitcoin bounced back, only to close for the first time below the February, $6,000 low, while completing a massive descending triangle since March.
This pattern demonstrates that supply is outpacing demand. However, the digital currency bounced again, this time above the (dotted) downtrend line since May 5, increasing the probability of retesting the pattern top, at $8,000 at the current angle.
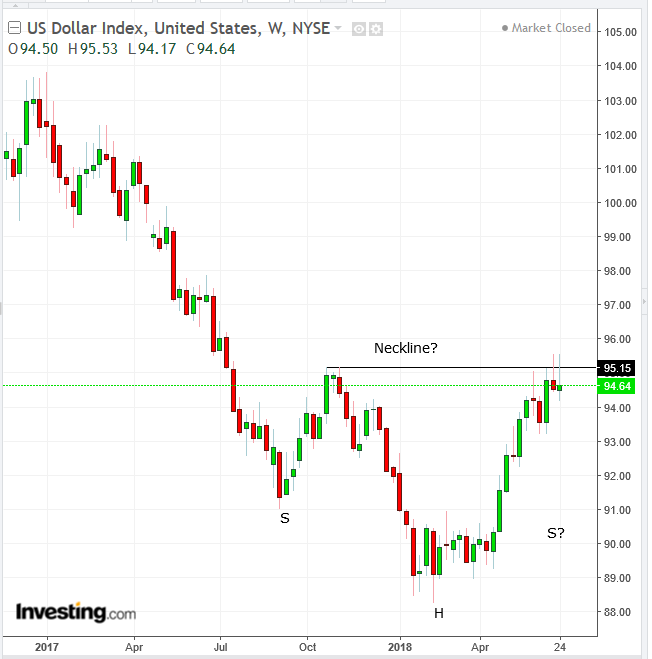
We've just witnessed the dollar’s best quarterly run since the start of Donald Trump’s presidency.
The global reserve currency has benefited from dual boosts: an obvious, expanding, positive interest rate differential and a confirmation of its role as a safe haven currency in times of global turmoil. With the exception of the yen, the dollar gained against all other major currencies after the 2008 crash.
In fact, the dollar even gained on the yen for five months in 2008, from April through August. However, despite its recent rise, technically it has been unable to overcome the 95 level, its October peak. While a fifth failed attempt to advance has bearish overtones, the USD's long-term trading pattern has been developing according to a massive H&S bottom since September 2017, a bullish signal.
The Week Ahead
All times listed are EDT
Sunday
19:50: Japan – Tankan Large Manufacturers Index (Q2): forecast to fall to 22 from 24.
21:45: China – Caixin Manufacturing PMI (June): forecast to fall to 51 from 51.1.
Monday
4:30: UK – Manufacturing PMI (June): expected to fall to 53.5 from 54.4.
5:00: Eurozone – Unemployment Rate (May): forecast to fall to 8.4% from 8.5%.
10:00: US – ISM Manufacturing PMI (June): expected to fall to 58.3 from 58.7.
Tuesday
0:30: Australia – RBA Rate Decision: no change in policy expected. Market to watch: AUD crosses
4:30: UK – Construction PMI (June) forecast to fall to 52 from 52.2. Market to watch: GBP crosses
5:00: Eurozone – Retail Sales (May): expected to rise 2.1% YoY from 1.7%
21:45: China – Caixin Services PMI (June): expected to fall to 51.9 from 52.9.
Wednesday
US Markets Closed for Independence Day Holiday
4:30: UK – Services PMI (June): expected to fall to 53 from 54.
Thursday
8:15: US – ADP Employment Report (June): expected to rise to 180K from 175K.
8:30: US – Initial Jobless Claims (w/e 30 June): forecast to be 221K from 227K.
10:00: US – ISM Non-Manufacturing PMI (June): forecast to fall to 58.2 from 58.6.
11:00: US – EIA Crude Inventories (w/e 29 June): expected to see stockpiles fall by 1.6 million barrels. Markets to watch: Brent, WTI
14:00: US – FOMC Minutes: these will provide further insight into the Fed’s decision to raise rates, as well as the shift on the committee that resulted in the dot-plot suggesting four rate hikes in 2018, from the previous three.
Friday
8:30: US – Nonfarm Payrolls (June): payrolls expected to fall to 190K from 223K, while the unemployment rate holds at 3.8%. Average hourly earnings forecast to be 0.2% higher MoM, from 0.3%.
8:30: Canada – Employment Data (June): 17,500 jobs expected to have been created, from a 7500 fall in May. Unemployment rate to hold at 5.8%. Market to watch: CAD crosses
10:00: Canada – Ivey PMI (June, seasonally-adjusted): forecast to fall to 60.7 from 62.5.
