- Dow hits all-time number of record highs in 2017
- S&P:Russell divergence signals correction ahead
- Dollar’s worst year since 2005, euro’s best since 2003
- Copper’s best run in 30 years
After 2017 turned out to be the best year for US markets since 2013, it ended on a subdued note when all four major US indexes slumped and, save for the Russell 2000, retreated from fresh weekly records. The RUT has been trading below its uptrend line for the previous seven sessions, after an attempt to cross back above it failed, in the wake of it having fallen below it on December 12th, where it traded till December 15th.
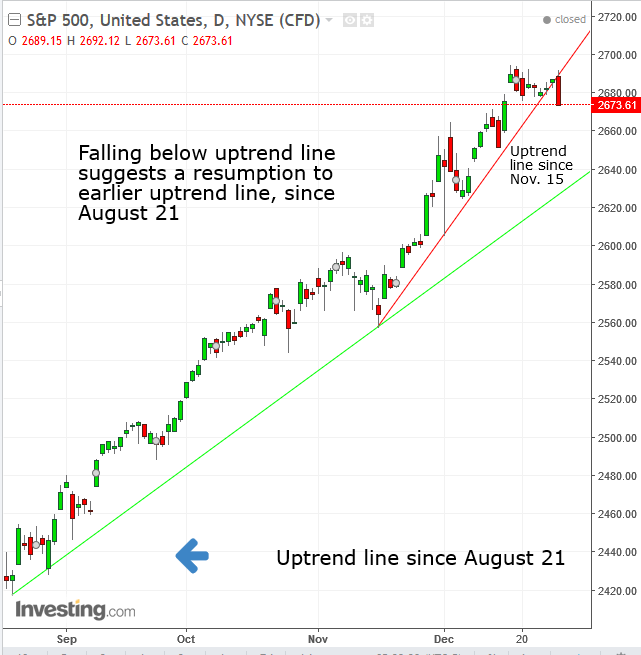
The S&P 500 Index declined 0.36 percent for the week, closing on the very lowest price price for the week, a sign that sellers overwhelmed buyers, absorbing all available demand till that point, while there was no counter-demand to sufficiently absorb supply at which to seek more buyers at higher prices. As well on Friday, the SPX crossed below its uptrend line since November 15. The most followed global stock index climbed 19.4 percent for the year, notching 62 record records during that period.
The Dow Jones Industrial Average fell 0.47 percent for the week, closing extremely near the very bottom of its weekly trade, as investors spent Friday taking profits. The oldest global index and second most followed stock average climbed 25.20 percent for the year, registering 70 records, the most record closes for a year ever for the index, surpassing the previous record of 69, made in 1995.
The NASDAQ Composite had the strongest weekly tumble of all the major averages, down 0.78 percent, falling to its lowest point for the week. That does not necessarily reflect weak fundamentals. Rather, it's a sign of profit taking, after the tech-heavy index's 28.35 percent run-up on the year. As the strongest performer among major US indices this past year, it would make sense that investors took the most profit before the end of 2017.
The Russell 2000 dropped 0.56 percent, closing less than a point off its lowest price of the day Friday. It saw the shallowest gains among the US majors, up 13.10 percent for the year.
It's our view that small caps, and thus the small cap index which is mostly comprised of domestic companies, should be the main beneficiaries of the newly enacted tax reform law in the year ahead. As well, the US economy continued to gain strength in 2017, given the increase in consumer spending, labor market improvement, higher consumer confidence and boost in wages. Under such conditions, these small cap stocks generally tend to outperform since they are less susceptible to global concerns. Additionally, the Fed's three interest rate hikes this past year signal a stronger economy, thereby providing an additional boost to investor confidence in small cap shares. As such, we believe these stocks could be headed for steady returns in 2018.
Why, then is the Russell 2000 not outperforming the other averages right now, but rather somewhat inexplicably underperforming? According to Matt Maley of Miller Tabak, the last time we saw a divergence between the Russell 2000 and the S&P 500, it was followed by one of the market’s last meaningful corrections, in 2015.
This current divergence may be a prelude to a similar correction. Maley doesn’t mention that the Russell 2000 PE ratio is a staggering 131.96, according to the Wall Street Journal. Compare that to the Dow’s 21.77, the S&P 500’s 21.81 and even the outperforming NASDAQ 100’s 26.62. This means that the earnings of small caps have fallen far, far behind those of companies traded on the other indices. Even though investors have bid up small cap share prices the least, they are already priced 5 times their value compared to larger companies.
The Internals
During 2017 the best performing sector—as has been mentioned many times—was Technology, which added 32.34 percent to its value over the course of the year.
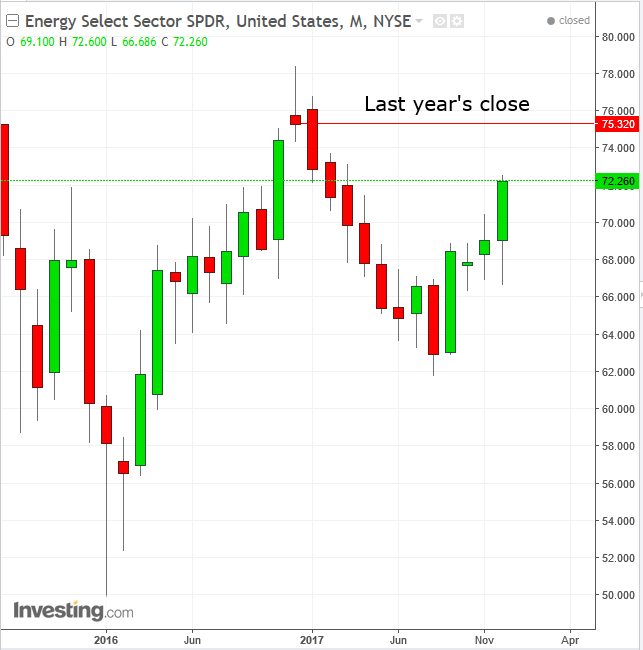
The worst performing sector—and the only one to close the year in the red—is ironically Energy, which lost 4.06 percent since 2016, even as the price of oil closed higher by 12 percent, reaching a two-and-a-half-year high.
This dichotomy reflects investor sentiment on the sector itself versus the commodity, with the message being: “fool me once, shame on you; fool me twice, shame on me,” after the 23 percent drop in energy shares during the first half of the year because of US shale production.
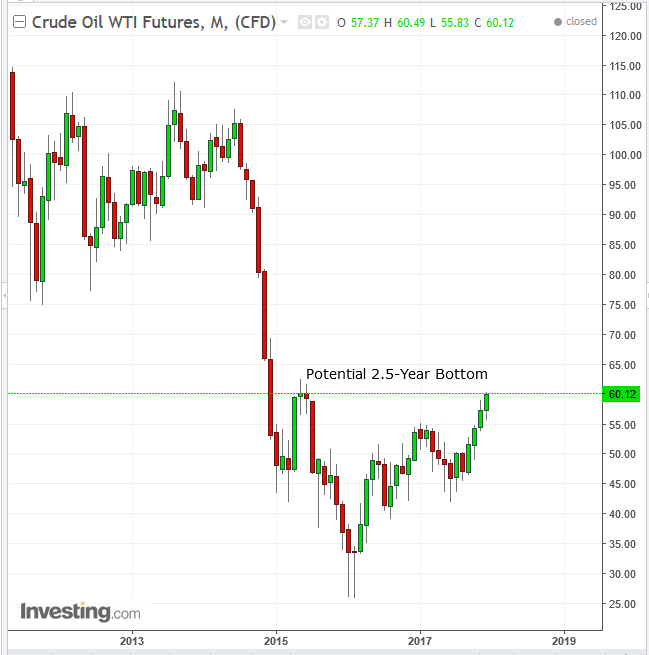
Oil investors, and of course buyers of the commodity itself, seem to be far more bullish, having pushed the price to a close above $60 on Friday to finish out the year, a mere $0.18 below the June 2015 close.
Any close above that level would be the first close of an uptrend since June of 2014, when the commodity closed at $105.37. Putting US shale production fears aside, from a technical standpoint, this would be a gigantic buy signal, having completed an equally massive bottom. Note our strategies for a long position in oil into 2018, and relevant analysis for a USDCAD position.
International Stocks Outperform
While this was the best year for US stocks since 2013, international stocks outperformed, for the first time since 2012, the result of faster paced economic growth in Asia and Europe as compared to US growth. Moreover, their shares provide superior value. As has been reported here previously, Asian shares, with 13 times earnings, are currently among the cheapest globally.
The dollar index closed at its lowest point since September 19, making 2017 its worst year since 2005. Friday's close completed a H&S top, suggesting there's still room to fall, as it would next test the 91.00 level followed by the 90.00 level.
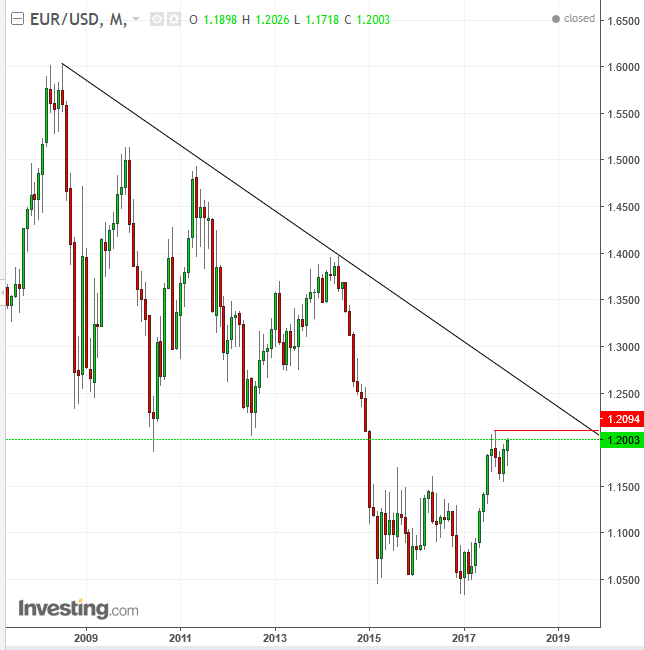
In a mirror image, its largest currency trading partner, the euro, topped $1.20 to finish out the year, making 2017 the single currency's best year since 2003. However, its run is about to be tested, as it reached a downtrend line since July 2008, but the first test will be the September high, just under 1.2100.
The Bloomberg Commodity Index extended a record-breaking string of gains, as WTI crude held above $60 a barrel and copper posted its best run during the month of December in almost 30 years.
The Week Ahead
All times listed are EST
Monday
New Year Holiday, Markets Closed: US, UK, Hong Kong, EU, Taiwan, Japan
- 20:45: China – Manufacturing PMI (December): forecast to rise to 50.9 from 50.8.
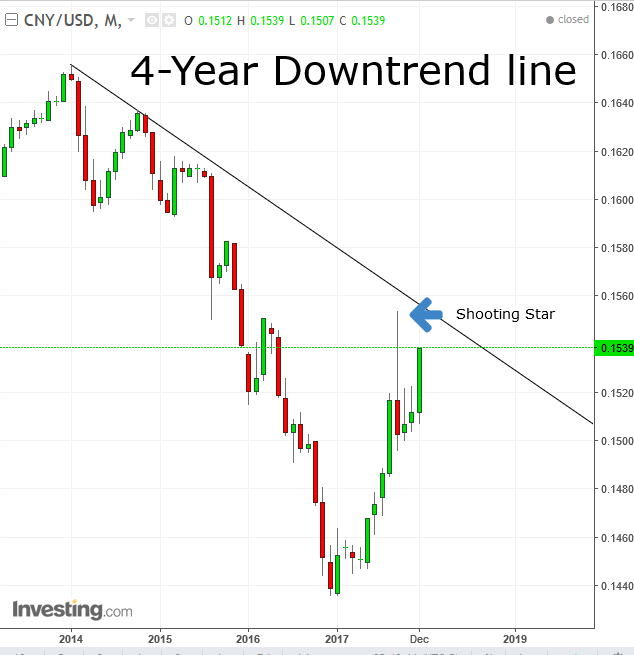
The 7.15 percent bounce for the CNY/USD on the year is coming against the downtrend line from January 2014, already confirmed with a powerful monthly bearish Shooting Star in September.
Tuesday
4:55: Germany – Manufacturing PMI (December): expected to remain steady at 63.3
4:40: UK – Manufacturing PMI (December): expected to fall to 58 from 58.2.
16:30: US – API Crude Inventories (w/e 29 December): stockpiles forecast to fall by 3.1 million barrels from a 6 million drop a week earlier.
The price of oil has completed a continuation pattern known as a symmetrical triangle, when it provided an upside breakout last Tuesday. Notice, in the chart above, that a line connecting the peaks forms a rising channel top, complementing the symmetrical triangle’s suggestion that the preceding uptrend will resume.
Wednesday
3:55: Germany – Employment Data (December): unemployment change forecast to drop by 11,000, while the unemployment rate is expected to remain at 5.6%.
4:30: UK - Construction PMI (December): forecast to fall to 53 from 53.1.
10:00: US – ISM Manufacturing PMI (December): expected to drop to 58.1 from 58.2
14:00: US – FOMC Minutes: the last meeting of 2017 saw another, albeit expected, increase in rates. The minutes will help shed light on the committee’s plans for 2018.
20:45: China – Caixin Services PMI (December): forecast to rise to 52 from 51.9.
Thursday
4:30: UK – Services PMI (December): forecast to increase to 54.2. from 53.8.
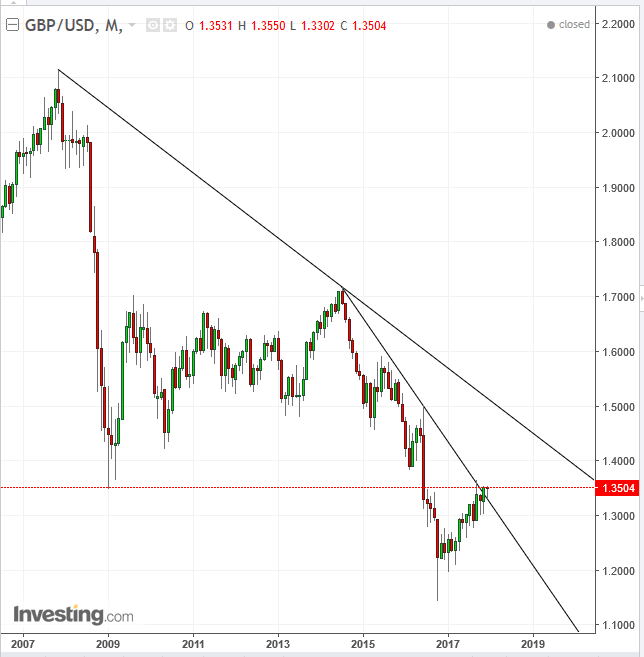
The pound’s 17.6 percent bounce from last year’s October flash crash is being retested by a downtrend line since July 2014 – a steeper decline from the primary downtrend line since November 2007. Note that the resistance of the more recent downtrend line coincides with the support of January 2009, in a demonstration of a broken support turning into a resistance level.
8:15: US – ADP Employment Report (December): expected to see 181K jobs created, from 190K a month earlier.
11:00: US – EIA Crude Oil Inventories (w/e 29 December): expected to see a drop of 1.3 million barrels, from 4.61 million a week earlier
Friday
5:00: Eurozone – Inflation (December, flash): expected to be 1.3% from 1.5% a month earlier.
8:30: US – Nonfarm payrolls (December): payrolls expected to fall to 189K from 221K. Average hourly earnings forecast to be 0.3% from 0.2% MoM. Unemployment rate expected to hold at 4.1%.
8:30: Canada – Employment data (December): 10K jobs expected to have been created, from 79K a month earlier, while the unemployment rate is forecast to remain at 5.9%.
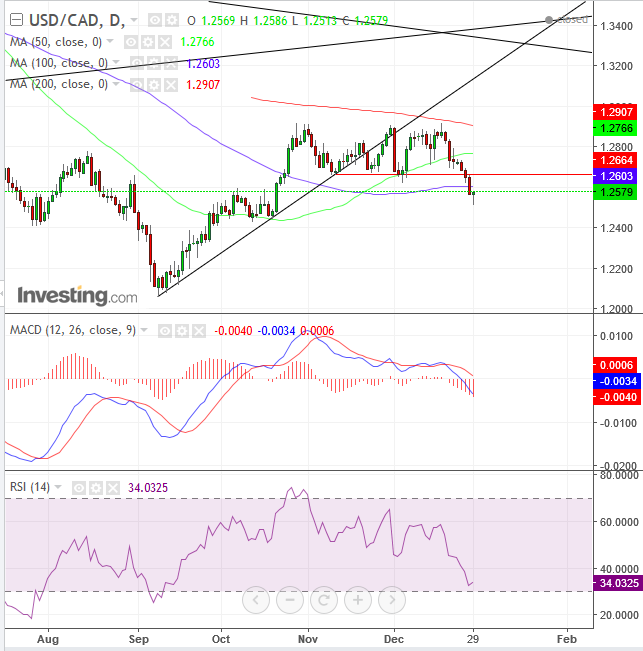
The USD/CAD pair completed a triple top when it provided a downside breakout last Thursday. While it fell below the 50 dma (blue), the last of the three major moving averages, as well as provided a sell signal by the MACD, Friday's powerfully bullish hammer and near-oversold RSI increase the likelihood of a return move, to retest the pattern.
10:00: USD – ISM Non-Manufacturing PMI (December): expected to rise to 57.6 from 57.4.
10:00: Canada – Ivey PMI (December): expected to fall to 59.5 from 63.
