Oil Rallies On Libya Pipeline Explosion
As 2017 comes to a close, there are a number of factors driving oil that can provide hints as to where oil is headed.
On Tuesday, a Keystone pipeline in Libya exploded, prompting the loss of 90,000-100,000 barrels of oil per day, driving up the price of both brent and crude.
The explosion in Libya is particularly detrimental to the price of oil since Libya is one of two OPEC countries without a cap on oil production due to political unrest. A shutdown of production in Libya is therefore far more significant than that of a country with a capped quota, especially as global demand for oil is growing. However, while the Keystone explosion has an impact on oil, it is only a short-term interruption.
The Stronger The Bull, The More Powerful The Bear
The two bullish long-term drivers of oil are Saudi Aramco’s incentive to raise prices as well as rising global demand.
In the past, it has been Saudi Arabia’s strategy to flood the global market with oil in order to combat US shale production, claiming that they can withstand low oil prices for a long time. However, the Crown Prince of Saudi Arabia rocked this status quo when he announced plans to privatize part of the kingdom’s oil company, Saudi Aramco.
This desire to privatize part of Saudi Aramco has incentivized the country to cut oil production, thereby raising prices of the commodity as well as the value of its state-owned oil company. Coupled with continued global economic expansion, this suggests improving demand for oil which we can expect to see continue into 2018.
Nevertheless, despite these bullish drivers, the flip side lends support to oil bears. In particular, that US shale production will strike back.
A rising oil price is all but certain to make it worth US shale production's while to expand operations. The IEA foresees US shale production will absorb market share. As production increases, prices will fall.
Short-Term: Bulls Overcome Bears, Uptrend Resumes

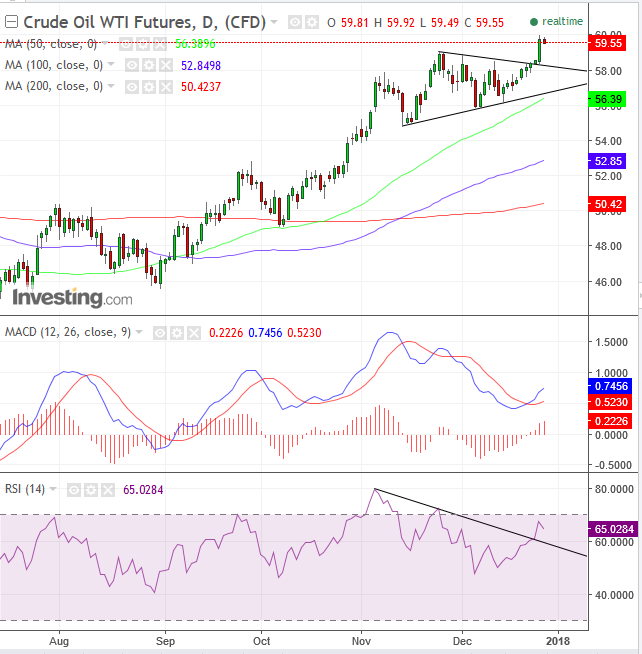
An evenly matched struggle between bulls and bears (interrupting and putting the current trend into question) may have been decided with a bullish victory and a resumption of the prior uptrend. Both MACD and RSI provided buy signals (more on the MACD below in the “Return Move” section). The 50 dma (green) aligning with the triangle bottom demonstrates it being a supply-demand pressure point.
Long-Term: Uptrend Unconfirmed

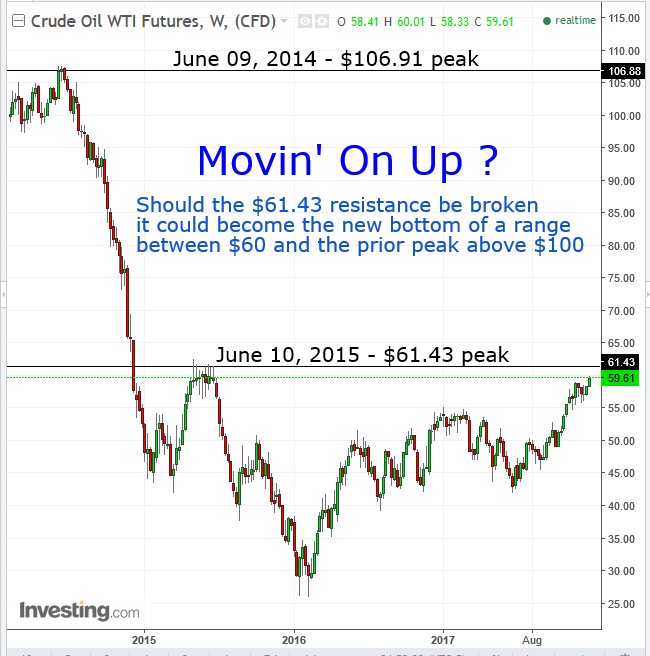
The market narrative claims that oil passed a major milestone yesterday, as price surged, posting a peak higher than its former peak on November 24, registered at $59.05. However, it was unable to keep gains above the key $60 level. More to the point, it must climb above the June 24, 2015 peak, registered at $60.27 if it wishes to resume its uptrend.
However, should we top the last peak before the 2014 crash, from above $100 to $43, it would suggest that what has been considered as the highest price in the last two-and-a-half years, the $60 level, would turn into the lowest price, in which the potential range top would be the $100 key level.
Trading Strategies – Long Position
Conservative traders would wait for the price to penetrate what could potentially be a significant resistance, by registering a peak higher than the former peak of June 24, 2015 at $60.27. That would also complete a 3 percent filter of the upside breakout of the Symmetrical Triangle upper bound, to avoid a bull-trap. So far, the penetration reached 2.6 percent yesterday, satisfying a moderate filter.
Moderate traders might wish to wait for a return-move to retest the pattern’s support, which would be confirmed with a bounce, whose price action covers that of the preceding daily decline.
Aggressive traders may enter a long position now, preferably with placing a stop-loss beneath the $58 level. Otherwise, they must be aware they assume a risk of the return-move.
Return Move Likely
On top of return moves occurring twice as many times as not, the MACD’s buy signal occurred before its moving averages reached the bottom of its chart, while reaching the low levels it reached on October, in a negative divergence to higher, December price. As well, the moving average bullish formation of 50, 100 and 200 are very wide, which increases the likelihood of a pullback.
Target: $62
The triangle height of $4 between $54 and $59 suggest the same players would resume their interplay at the new levels.
