by Pinchas Cohen
The Week That Was
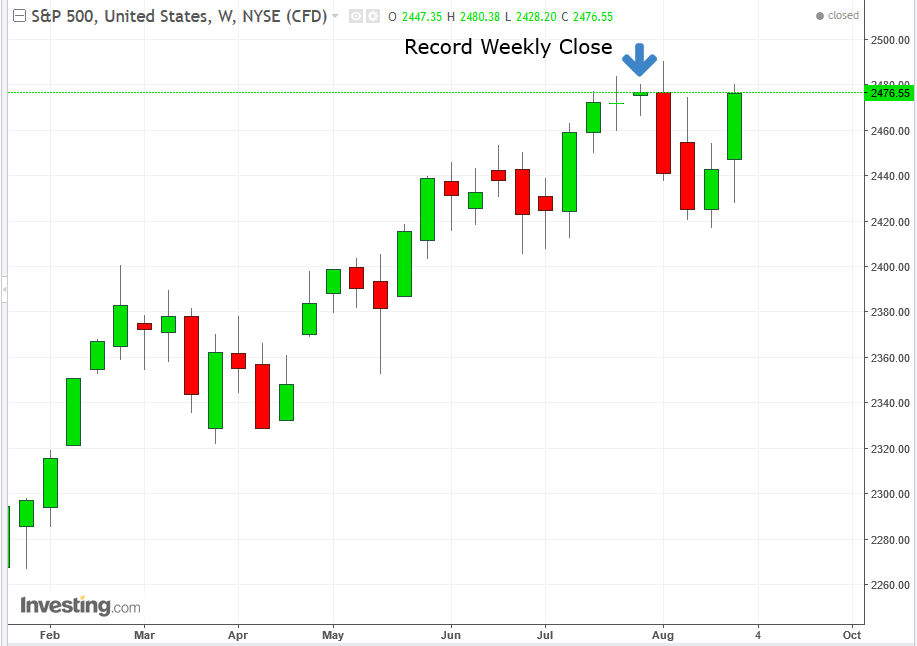
Hurricane Harvey’s impact on the market has been muted, as evidenced by the second weekly gain in a row for the S&P 500. What’s more, last week the benchmark index closed a paltry 28 points lower than the weekly record close for the week ending July 31.
To confirm the appetite for risk, 10-year Treasuries climbed four basis points to 2.16 percent on Friday, recovering 3-and-a-half days of losses.
What’s more, the bounce prevented a downside breakout on a close from the June 14 trough. Finally, the rebound produced a powerful bullish hammer, at the bottom of the range, where it counts the most.
The risk-on sentiment was spurred by a gain in consumer confidence and an expansion in manufacturing activity – the fastest pace of growth in 6 years, driven by employment gains, according to the Institute for Supply Management. This, even with a mediocre August jobs report.
Natural disasters incur a two-stage cyclical impact on economic activity. In the first stage, economic activity is adversely affected, via employment, consumption and production. In the second stage, rebuilding causes economic activity to rebound. In the same vein, while wars are bad for people, they’re great for the economy.
Hurricane Harvey has had a severe impact on the energy market and is expected to continue to be the dominating factor for prices. 20 percent of US refinery capacity is down, which reduces gasoline supply, driving up the prices of gas, diesel and jet fuel. On the other hand, these same shuttered refineries, because no work can be done, will shut down demand for crude oil, allowing imports to glut inventories, driving down oil prices. This is likely to cause volatility on headline inflation in upcoming months.
Friday’s employment report is unlikely to be a game changer. Though 156,000 jobs were added in the month of August, supporting an economic growth story, the release came in below expectations. Building on the disappointment, earlier payrolls prints were subject to downward revisions. Wage growth was weak and rangebound. In the final analysis, the most recent employment report seems to be a continuation of the same story – a strong US labor market, that can’t seem to drive up wages.
Fed consensus is emerging, spelling out the start of shrinking the balance sheet in September but with no additional rate hikes for the year. The last employment report was prepared before the potential data impact of the storm, but the Fed may have a tough time trying to interpret the upcoming employment reports and how they fit into the larger context of the US labor market.
The euro has more upside potential. The single currency is still considered cheap and the eurozone economic data is exceptionally strong.
For example, economic confidence rose to a new high for the cycle, in August. The same data that has been supporting a stronger euro is also responsible for growth in equities. The catch is that a rising euro may adversely impact European equities, as sales figures from multi-national companies may suffer, when their goods become more expensive for foreign buyers.
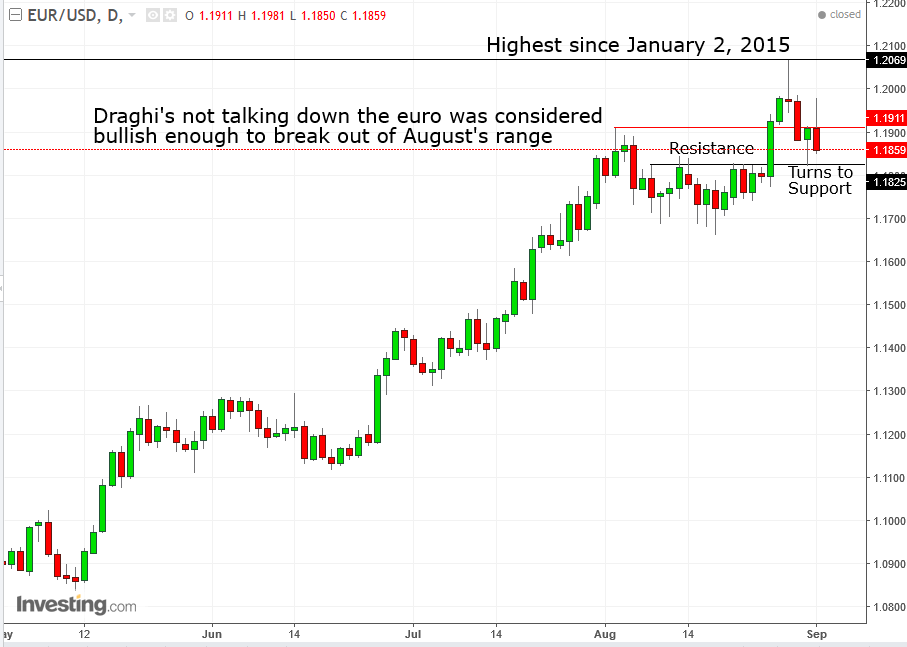
This relationship between the euro and European equities has provoked the ECB to talk down the euro. This is why the euro surged 1.1 percent after ECB President Mario Draghi did not talk down the euro in his Jackson Hole speech a week ago Friday, allowing the single currency to break through its range during the month of August to reach 1.2069 on Tuesday, the currency's highest point since January 2, 2015.
The Week Ahead
All times listed are EDT
Monday
Labor Day Holiday – US and Canadian Markets Closed
4:30: UK – Construction PMI (August): Expected to fall from 52.0 to 51.9
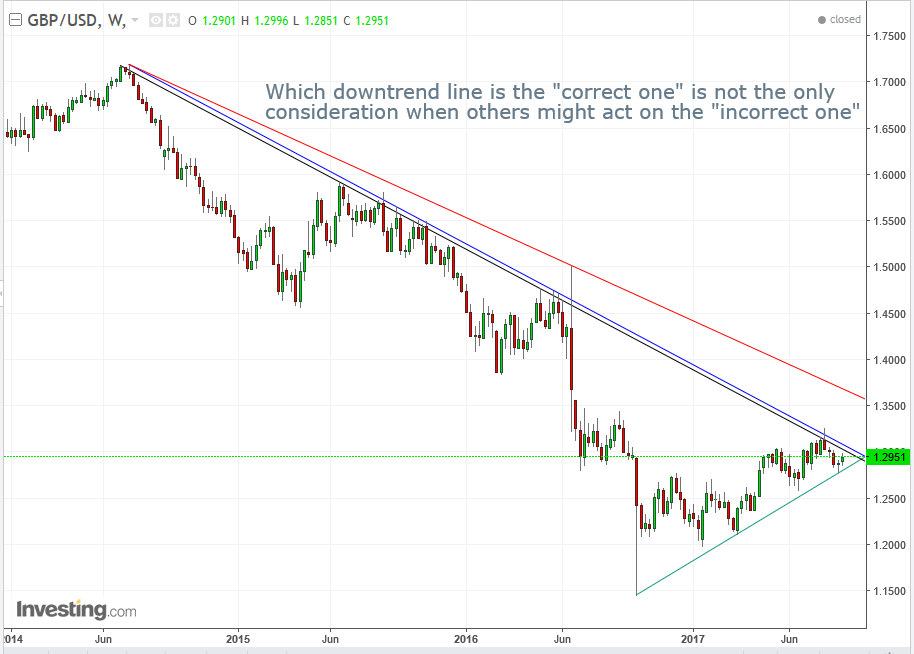
The GBP/USD weekly hammer of two weeks ago, which ended on August 21st, confirmed the uptrend line since the October flash crash. The price action last week extended that weekly advance.
Note the green dotted line marking where the last price meets the bottom of the range before the flash crash – July through September – suggesting resistance of the psychological reversal the flash crash enacted. Also, the key 1.3000 level, only 49 pips above, is expected to provide resistance.
Finally, although in our opinion the correct way is to generally include all price action within trendline analysis (red downtrend line), some only consider closing prices (black downtrend line), or at least ignore outliers (blue downtrend line), such as the October flash crash, as well as the June 20th exceptionally long upper shadow that doesn’t fit the rest of the trend. These traders would therefore consider the current price beneath the downtrend line since July 2014 and create a resistance to the price with sell orders. A good entry for a long would be after a dip toward 1.2800, or after a decisive close above the July, 1.3265 peak.
21:45: China – (August): The private sector survey is likely to demonstrate increasing activity, in which the index would climb from 51.5 to 52.1
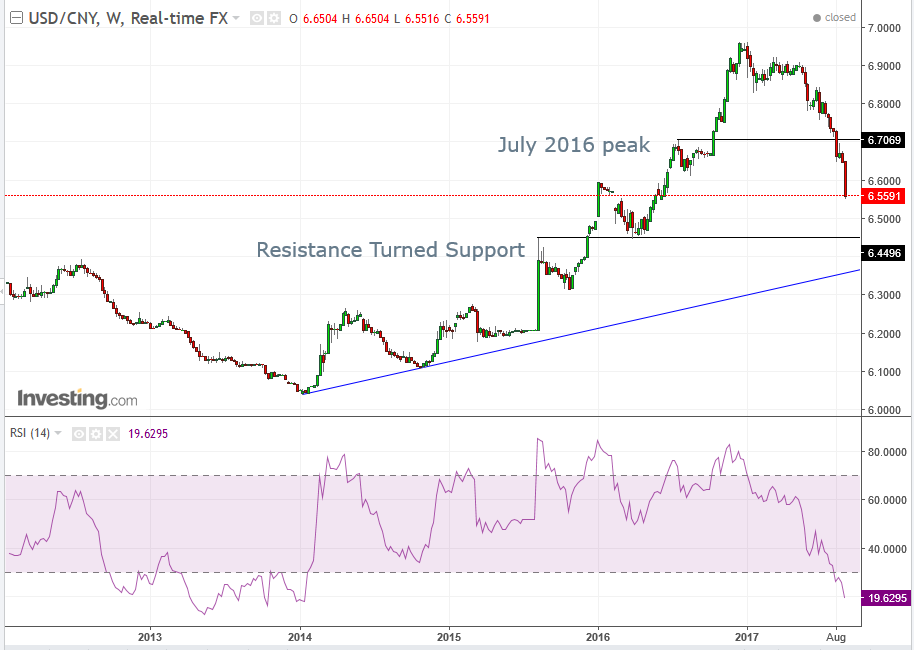
In our last week ahead post, we suggested the USD/CNY will continue its fall toward the primary price since 2014, probably around 6.5000. During the past week the price fell another 1.35 percent. Before jumping in with a short, wait for a correction, as the RSI reached its most oversold condition since January 2014. A good entry for a short would be at 6.7000, the July 2016 peak.
Tuesday
12:30: Australia – RBA Interest Rate Decision: Consensus expectation is for policy to remain steady.
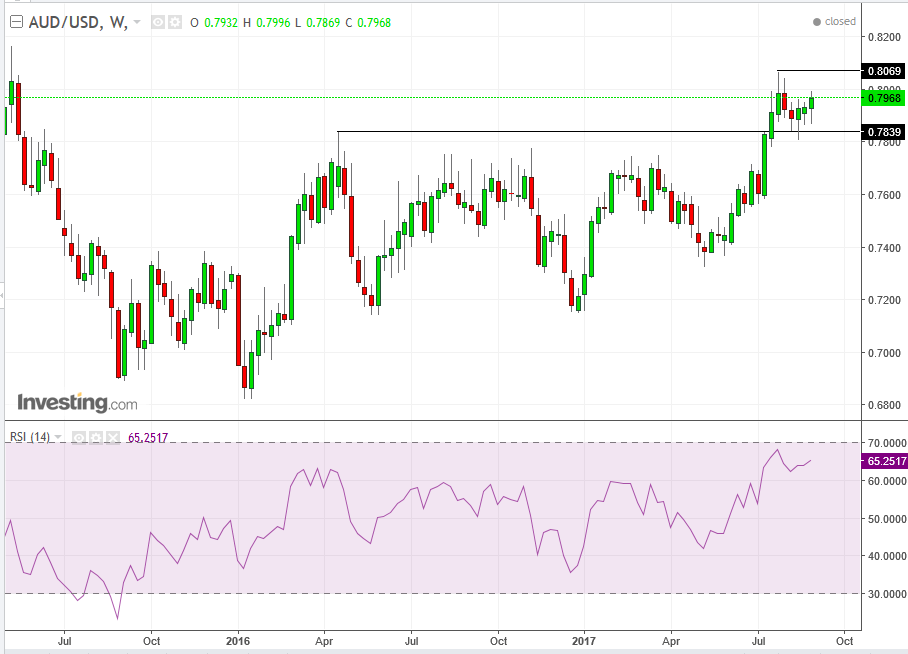
As of July, the Aussie dollar had gained 12 percent versus the greenback and the RSI reached its most overbought condition since April 2011. In the following 5 weeks, the pair failed to register a new high.
Still, the AUDUSD broke out of its range since April 2016. The failure to overcome the July peak was a correction, or a return-move, to retest the support of the new support of the former range top’s resistance. It confirmed it, when it stopped above it in the week ending August 7 and reconfirmed it on the following week, ending August 14, when it dipped below it but didn’t only close above it but registered a weekly gain.
In the following two weeks, the pair extended those gains, for a total of three consecutive weeks. All this is promising for a cross above the 0.7994 resistance level of the July peak, though the pair may experience volatility at those levels, as the bulls and the bears go at it down under, especially around the 0.8000 key level. The lower the entry point toward 0.7800 the less likely for negative fluctuation.
4:30: UK – Services PMI (August): Consensus has the release decline from 53.8 to 53.7.
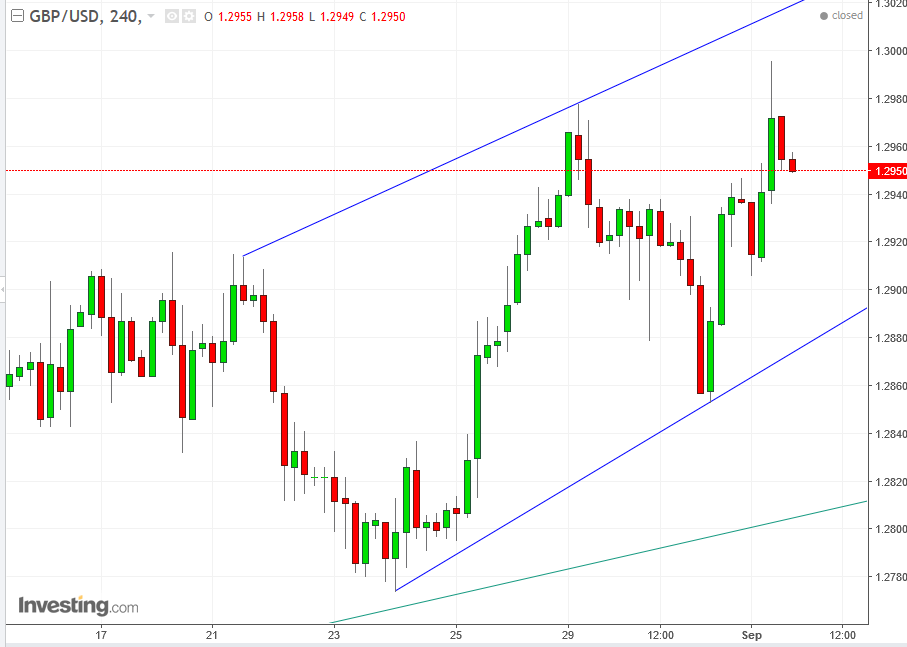
Within the pressure point between support and resistance as described in the GBPUSD weekly chart, in the short-term a rising channel has developed on the 4-hour chart. A dip toward 1.29 would provide a buying opportunity to retest 1.3000
21:30: Australia – GDP (Q2): Expected growth from 0.3% to 0.7% QoQ and from 1.7% to 2.8% YoY. Construction spending is booming and an expanding Chinese economy has been boosting Australian exports.
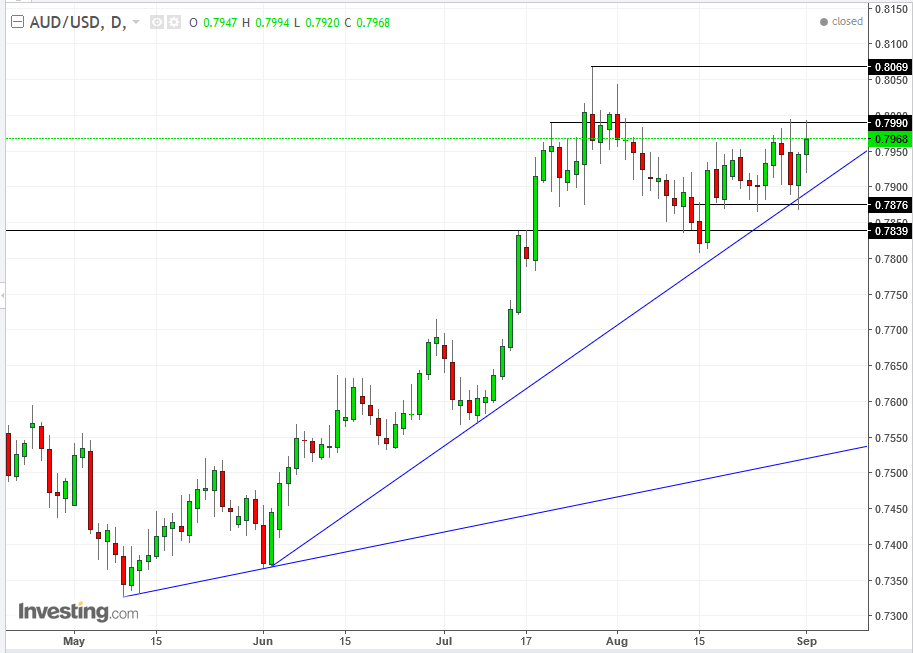
While the AUDUSD trend is rising, the pair has been ranging since July. Friday’s intra-day high reached the height of where price action was mostly heading and closed lower. A good entry point for a long position might be another dip to the uptrend line toward 0.7900, with price targets at the key 0.8000 and the July 27, 0.8069 peak.
Wednesday
8:30: US – Trade Balance (July): deficit forecast to narrow from 43.6 billion to $44.6 billion.
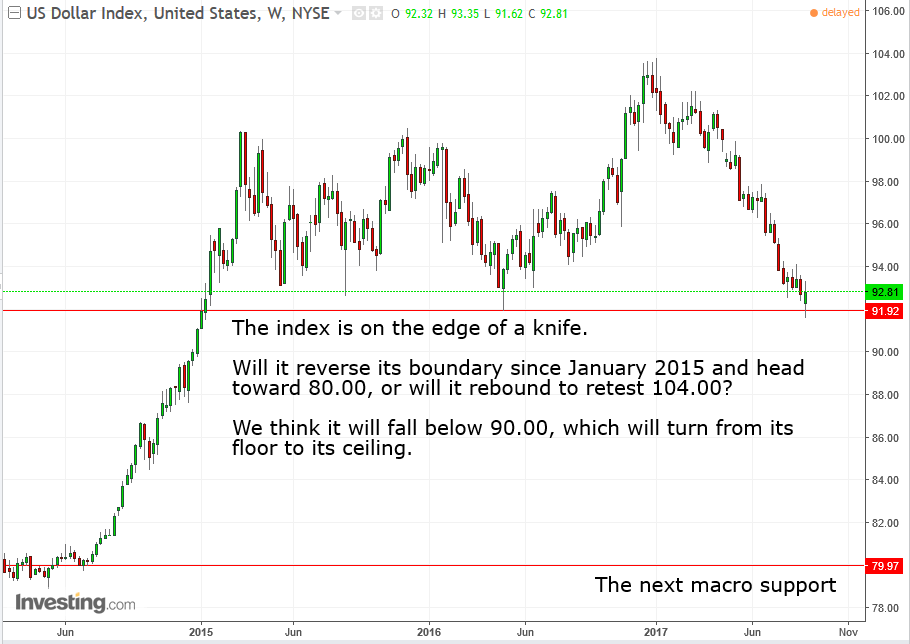
Last week, the US Dollar Index registered its lowest point since early January 2015 – a bearish signal – while it closed above the bottom of the range in which the price has been trading ever since. Last week’s 91.62 low could prove crucial.
Should it break, it could be a breaking point of the highest prices since 2002 (even before there was a Trump Trade, the dollar index reached its highest level since 2003), in which 90.00 would no longer be considered the floor but the ceiling, where the new floor would be near 70.00. On the other hand, should investors consider these prices a worthy buying dip on any upside economic or Fed surprises, it could reaffirm its “floor status” and retest the 104.00.
Our opinion, based on our analysis on the daily chart, is that the dollar is on the verge of a downside macro reversal.
10:00: Canada – BoC Rate Decision: No policy change expected; interest rate remains at 0.75%.
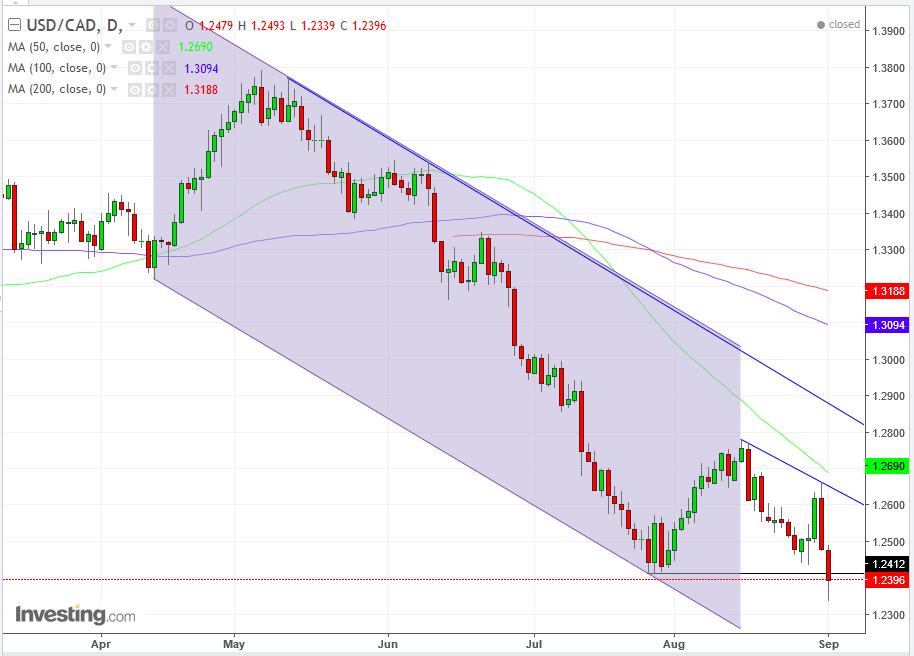
On July 31, we published Why You’d Be Looney To Be A CAD Bull, as the dollar proceeded to strengthen versus the loonie, up 2.8 percent in the next couple of weeks. This past Friday, the price of the pair didn’t just reach below but closed beneath the July trough, confirming the downtrend since May 5. Therefore, we're now bearish on the pair, though we’d be more comfortable suggesting a short position after an upward correction, at least to the midterm downtrend line since August 15 at around 1.2500, if not to the long-term downtrend line since May 5, at around 1.2650.
Also, beware of a bear-trap, as the pair has been down these levels before on May 3, 21016, with a low of 1.2458. A filter to avoid such a trap would be at 1.2258, with a one-percent filter.
10:00: US – ISM Non-Manufacturing PMI (August): Expected to rise from 53.9 to 55.3
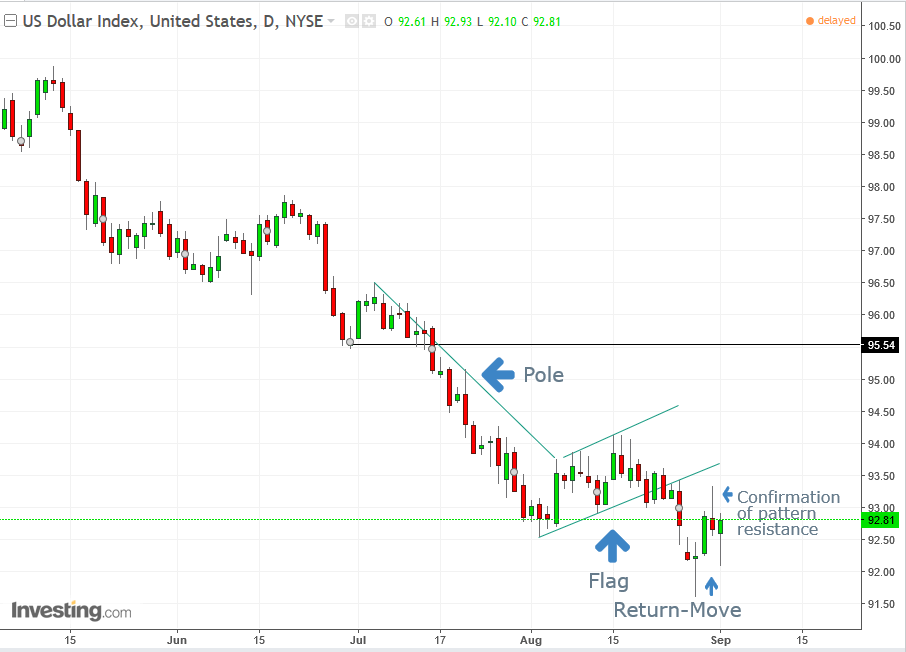
The US Dollar Index completed a bearish rising flag pattern, whose price target implication, as measured by the preceding move, or flag pole, is 325 points from the breakout price of about 93.25, to about 90.00.
Thursday
5:00: Eurozone – GDP (Q2, 3rd estimate): QoQ growth forecast to be 0.6%, and YoY growth 2.2%
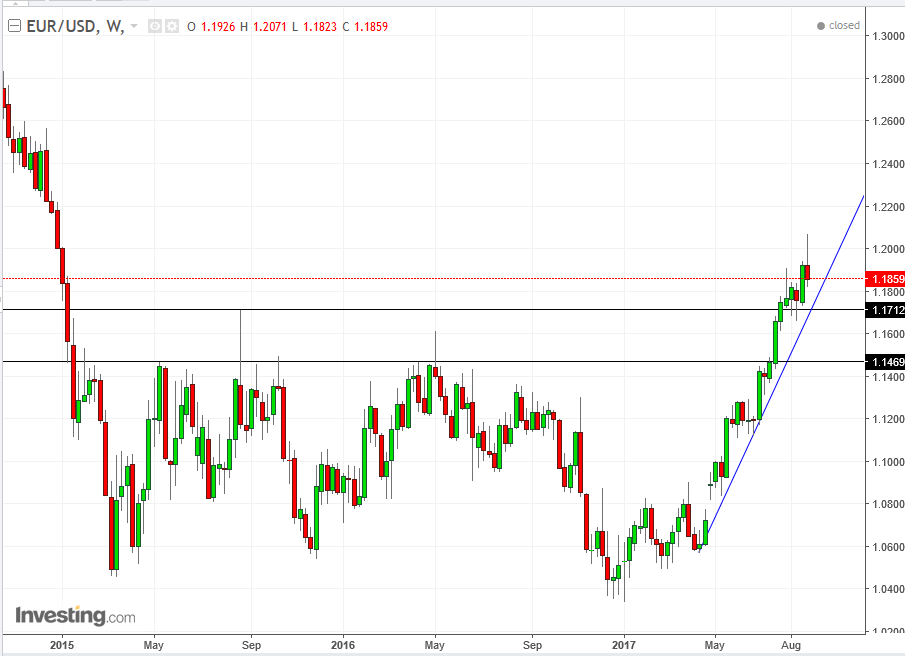
As a driver of the Dollar Index reaching the bottom of its trading range since January 2015, the euro already broke out of its range for the same period. However, last week’s trading produced a weekly bearish Shooting Star, when, after the bulls attempt to gain additional ground, the bears were the victors of that battle.
After the pair's 3-pecent breakout, even the conservative filter has been established, along with the breakout. However, the shooting star highlights the potential for a downside correction in a return-move to retest the range top.
Note, that while the highest price within the trend is 1.1712, the August 2015 peak, a more solid support is at around 1.1470, where there is a high congestion of price-action, forming a resistance. That means there is a potential of the price returning there, or at least retesting the key 1.1500 support. An aggressive long entry would come after a dip to the uptrend line since April. It’s aggressive, because the uptrend line is likely too steep to be sustainable.
A moderate long entry would be upon a dip to 1.1663, the lowest price in August, which is also within the range. A conservative entry for a long position would be the key 1.1500 price level.
7:45: Eurozone – ECB Rate Decision (Press Conference: 8:30): No policy change is expected, while balance sheet normalization would send the euro into a rally. However, Bloomberg reported that the ECB may not have a final QE plan ready until December, in which case traders would only have 10 trading days to adapt strategies. Also, be prepared for Draghi to tempter any good news by talking down the euro, after the market buzz in June held that he's comfortable with continued euro strength, thus the omission of any negative rhetoric. Since then, the euro has fallen on reports that ECB policy makers have increasing concerns regarding its recent strength.
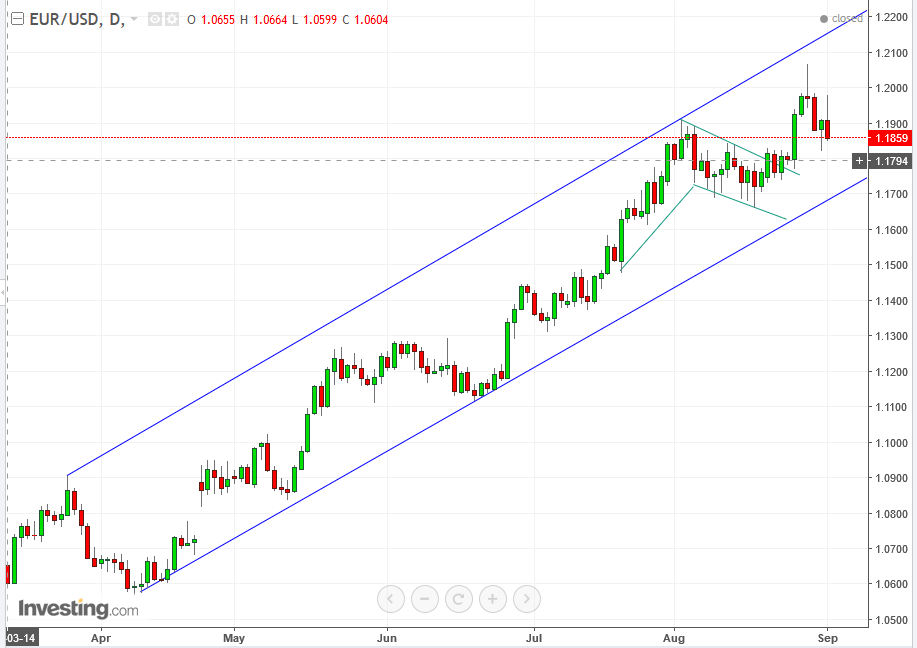
Meanwhile, the pair has been trading within a rising channel since early April. The recent decline fits the peaks and troughs of demand raising prices and taking profits, which causes a correction toward the uptrend line. What’s more, on August 25, trading completed a bullish falling flag, with a decisive breakout. The recent decline is a return-move to retest the support of the pattern. The upside target, as measured by the preceding sharp, move or “flag pole” is 400 pips from the 1.1770 breakout point. Thursday’s bullish hammer provides confirmation of the flag pattern’s support, as well as the end of the correction.
8:30: US – Initial Jobless Claims (week-ending September 2): Expected to rise from 236K a week earlier to 237K.
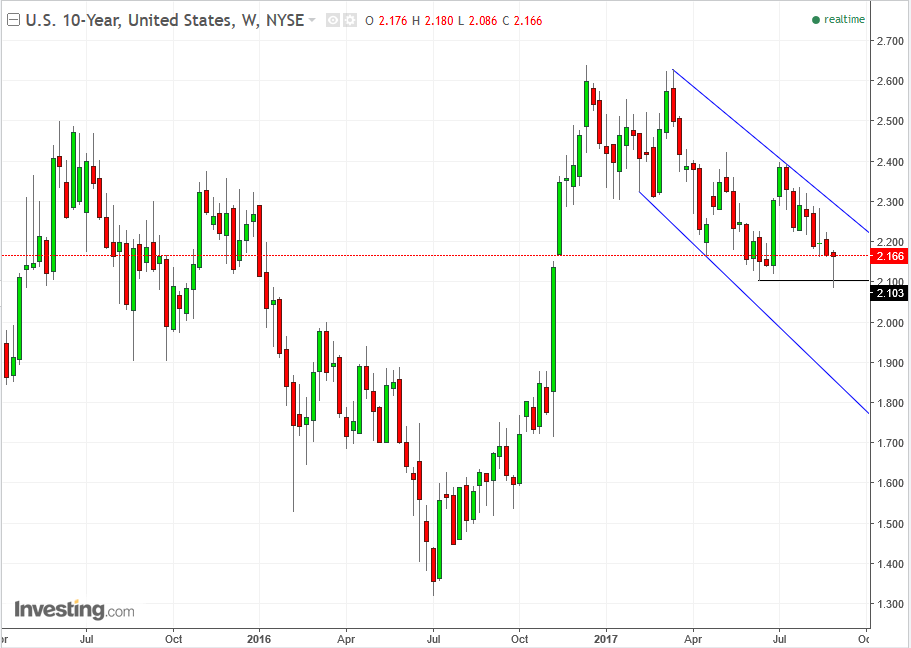
The 10-Y has dropped since the 2.629 percent high on March 13 to a low of 2.086 percent last Tuesday – which tested the waters of the lowest yield since November 7 – one day before the US elections, when consensus had Clinton the victor. This 20 percent decline in 25 weeks may represents a combination of two views: (1) an expectation of higher interest rate in the near future and/or (2) rerouting of funds from risk-off to risk on.
Considering that Fed’s rate-hike odds have been tumbling for months on political risk as well as the Fed’s guidance itself, the 20 percent decline in yields is probably not on an expectation of higher rates soon. What remains is risk-on, which jibes with the 5.5-percent rise of the S&P 500 in the same period.
On the one hand, the lowest yield since November 7 registers a new trough in what may lead to a further decline within a falling trend. On the other hand, the powerful hammer – measured by how much longer the lower shadow is than the real body of the candle – with a higher close than the previous, June 12 trough, may suggest a reversal in the making, in what may be an expression of investors questioning the sustainability of an equity market whose valuations are as high as before the 1929 and 2000 crashes, alongside lackluster economic growth and a chaotic and uncertain political environment.
10:00: Canada – Ivey PMI (August): Expected to rise from 60 to 61.
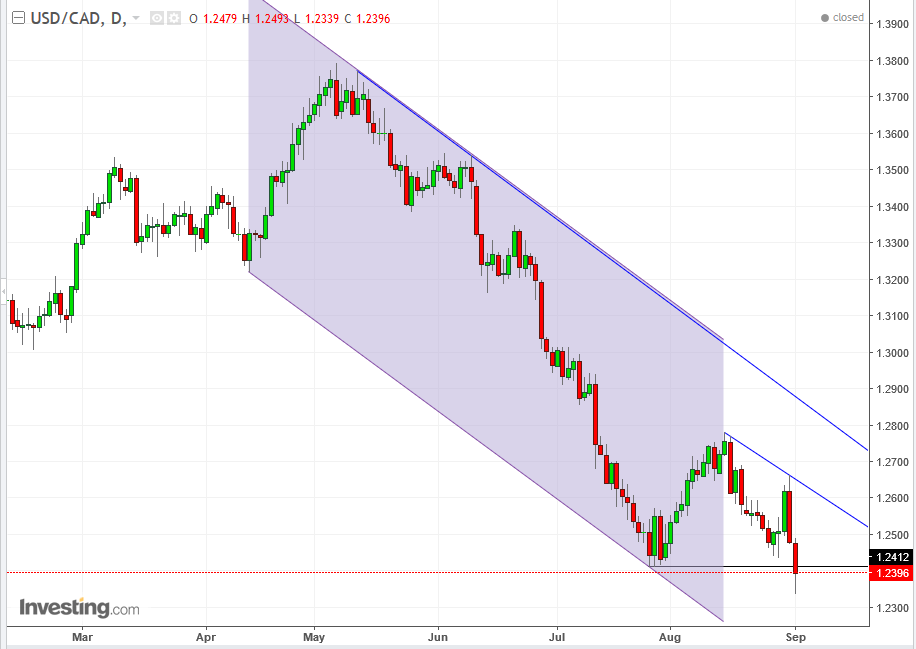
The USDCAD pair has been trading within a falling channel since May. It is currently testing the previous trough. It might fall through it, turning support into a resistance, or it may rebound toward the top of the channel in a correction, before continuing its downward trend.
A conservative short entry would be a return toward the 1.2800 downtrend line. A moderate entry would be entering with a short at the 1.2690 50dma, and an aggressive trade would be waiting for a return to the 1.2600 midterm downtrend line since August 15, the 1.2500 key price level or even immediately, as it closed below the previous trough.
11:00: US – EIA Crude Inventories (Week Ending August 31, but delayed by a day due to labor day): previous week saw a fall in stockpiles of 5.4 million barrels.
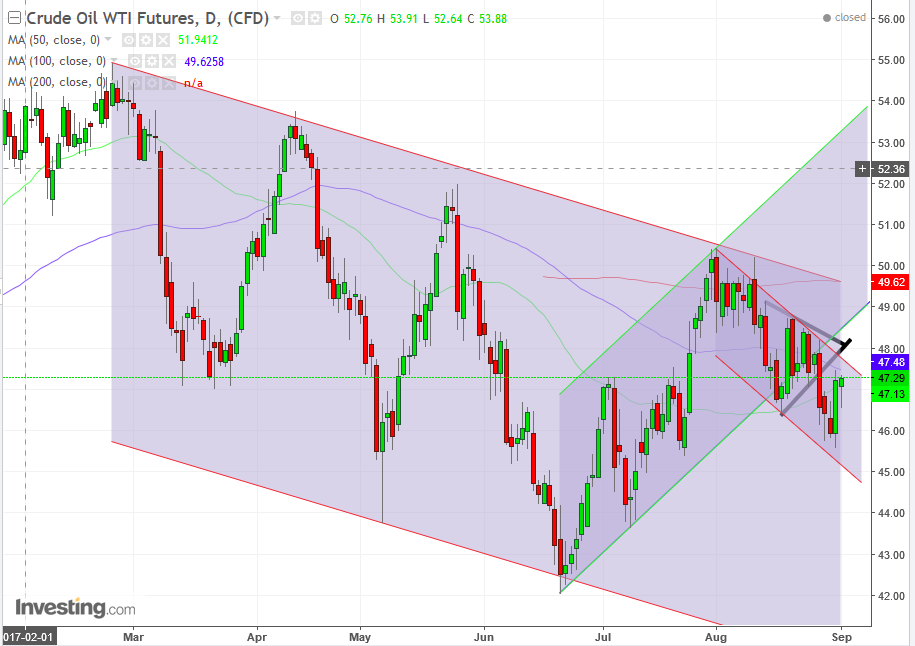
Hurricane Harvey has pushed the price of oil down further along its long-term downtrend, after breaking from its midterm uptrend. On August 28, it broke out of a bearish pennant, which confirms the midterm downtrend within the long-term downtrend since February. This past Thursday and Friday, the price performed a return move and is now expected to continue toward $45.
Friday
10:00: China – Trade Balance (August): Surplus expected to rise from $46.7 billion to $48 billion .
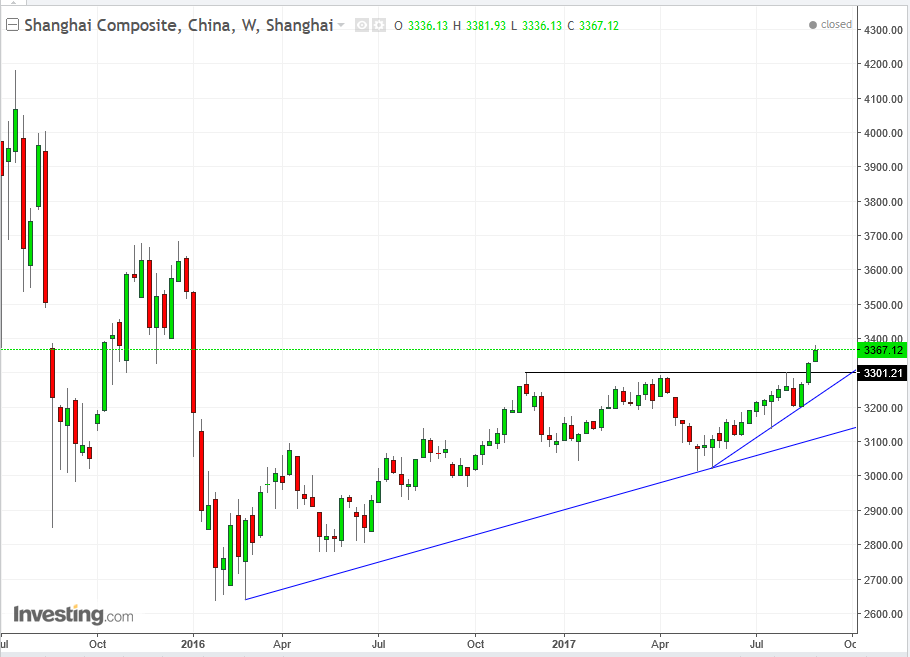
The Shanghai Composite Index has been trading up since late February 2016. During the week before last it managed to break above its resistance since late November 2016. Last week extended the advance. The current price is its highest since January 2016. The next resistance is at 3.600.
A conservative entry point for a long position would be to wait for a return dip toward the primary uptrend line, around 3,200.00. A moderate long entry point would be the 3,300.00 range-top, which should coincide with the midterm uptrend line since May. An aggressive entry would be now, with a stop-loss beneath the 3,300.00-range top.
4:30: UK – Trade Balance (July): Previous reading was a deficit of £4.5 billion.
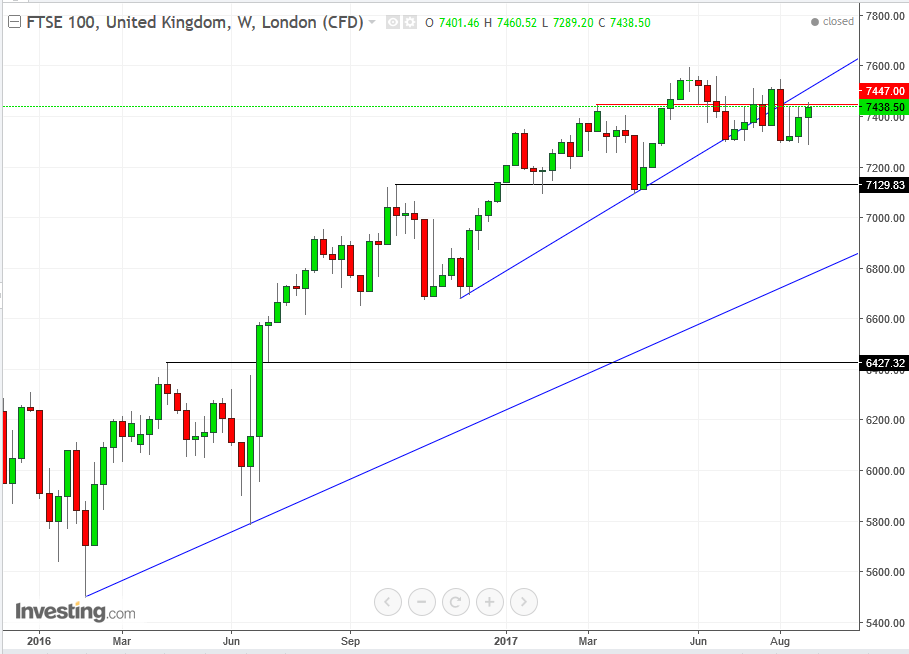
The UK's FTSE 100 has been trading up since early February 2016. It has entered a steeper uptrend since November 2016, riding the coattails of the Trump Trade. However, on August 7 it decisively crossed below the short-term uptrend line since November 2016. Worse, the upward peak-and-trough series was interrupted, as the price fell beneath the March peak (red line). The failure of the short-term uptrend line suggests a return to the mid-term uptrend line since February 2016 around 7000.00.
8:30: Canada – Jobs Data (August): Unemployment expected to hold at 6.3%, while consensus believes 26,700 jobs were created after 10,900 a month earlier.
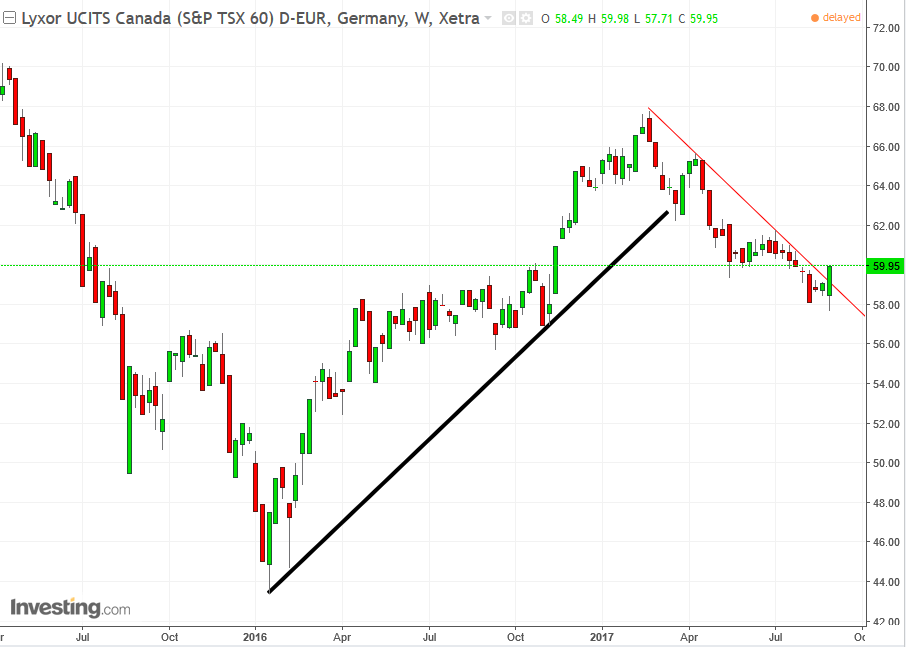
Above, the Germany traded ETF Lyxor UCITS Canada (S&P TSX 60) D-EUR (DE:LYXSPTSX) which tracks the Canada's S&P/TSX 60 benchmark.
The ETF has ended its uptrend since January 2016, when it crossed below it on April. Since then, it has been falling. Last week’s trading closed above the downtrend line since mid-February, putting it into question. However, the previous trading range, from mid-May through late July has confirmed its resistance.
While accepting the risk of a potential reversal with the downtrend line penetration, which could be aided with support of the 2016 congestion, this price provides an excellent short position, between the resistance of the May-July congestion and the 58.00 support.
