by Pinchas Cohen
The Week That Was
Geopolitics
Though geopolitics continued to dominate markets, they had yet to take control of the market, with extraordinary volatility. Indeed, the market recorded fresh highs, though last week investors began to incorporate potential risk into their strategies, as the market provided declines as well as advances. What appears to be emerging as a critical hot spot for investors is whether there will be Congressional cooperation for tax reform.
Economic Growth
As demonstrated by the eurozone's Manufacturing PMI, economic expansion in Europe continues as the measure resumed its upward trajectory, consistently led by Germany's PMI results.
On the surface, the July durable goods result didn’t look good, but aircraft made up a big portion of the reading. Since it’s such a big-ticket item, a few more purchases one way or another swings the measure widely, making it an unreliable, volatile number. The underlying data, however, was consistent with expansion.
Did Yellen and Draghi Join Forces Against Trump?
Both Janet Yellen and Mario Draghi sidestepped any landmines at Jackson Hole, avoiding delivering any insight into inflation or the path to interest rates, nor to the beginning of shrinking the balance sheet.
The annual Wyoming-based retreat was the biggest event last week and dominated the market narrative every single day. Yellen used it to discuss the history of the financial crisis and regulatory failures, and how things have improved since. She praised the Fed’s immediate and timely response to the Great Recession, particularly changes in liquidity and capital requirements that have made banks safer. The Fed chair pushed back against the argument that there are liquidity issues. Considering regulations being outside the Fed’s mandate, it seemed out of place, unless Yellen was defending regulation? But against who did she feel the defense was necessary?
Like Yellen, ECB President Draghi also gave traders nothing new to chew on, even though there was much anticipation prior to the event. While he avoided any insight into interest rate or balance-sheet shrinkage, he voiced his concern over a lack of openness and protectionism. He fears trade is under threat. While not mentioning him by name, Draghi intimated that US President Donald Trump is the single, biggest threat to global growth.
As a result, the euro registered both the highest intra-day price since January 6, 2015 and highest closing price since January 5, 2015. The fact that traders bid the single currency's price higher than the intra-day high of August 2 suggests the momentum will increase upwards to retest the 1.2000, and continue to 1.2300, 1.2500 and even 1.3000, after having broken out of its more than 1,000-pip range, between roughly 1.05 and 1.15, since the beginning of 2015.
Some have interpreted Draghi’s not feeling it necessary to address the euro’s multi-year high and its adverse effects on exports—and by extension growth—as evidence that it’s a non-issue.
We have a different opinion. Our ears are still ringing from Draghi’s loud silence on the subject. We believe Draghi is doing everything he can to avoid another June 27 fiasco. At that time, the ECB President hinted at an autumn tightening, which sent traders scurrying to bid up the euro by 1.4 percent, to its highest level in a year.
In response, Draghi’s lieutenant, ECB Vice President Vitor Constancio attempted to temper the market reaction by stating the remarks were “totally” in line with existing policies and investor response was hard to understand. The dip that followed that mixed signal proved to be nothing more than a very short correction to a much longer rally, as investors decided to ignore the ECB's contradictory signals.
We believe, therefore, that Draghi is afraid of another gaffe, though it's strongly possible he overplayed his hand by pretending not to notice the giant, pink elephant in the room.
The Week Ahead
All Times EDT
Monday
United Kingdom – Summer Bank Holiday
19:30: Japan - Unemployment (July): expected to remain at 2.8% YoY.
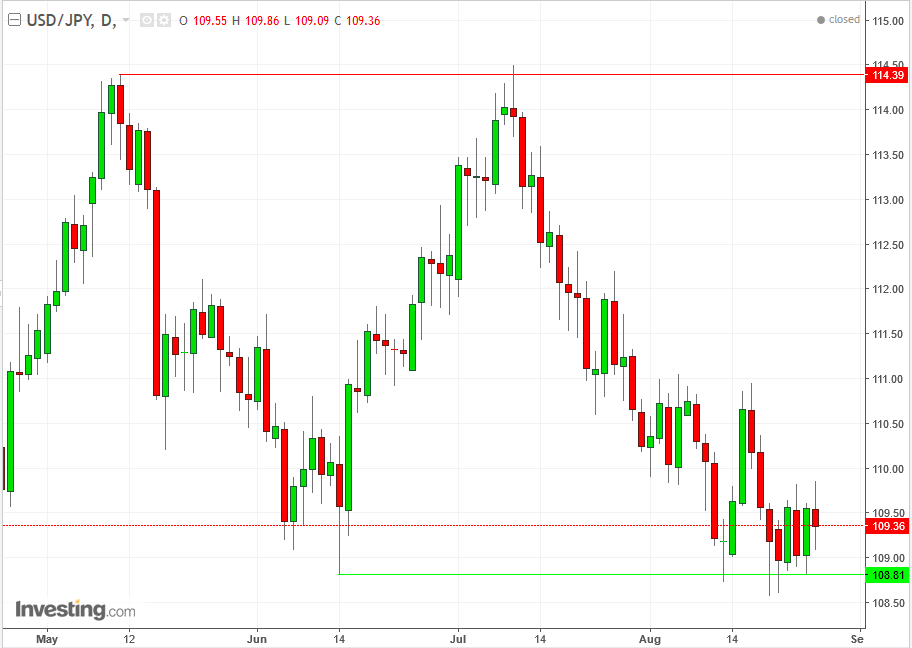
The USD/JPY price is near the bottom of its trading range since May 9, providing a long position with a 0.7 percent downside risk to the August 18, 108.58 low support and a 4.7 percent upside potential to the July 1, 114.51 high resistance. That makes the risk-reward ratio 15:1 in favor of a long position. In other words, for every amount of risk the potential reward is 15 times that. Note, this analysis does not predict that the price will necessarily go up, it only notes the risk-reward ratio.
Tuesday
7:00: Germany – GfK Consumer Confidence (September): forecast to fall to 10.7 from 10.8.
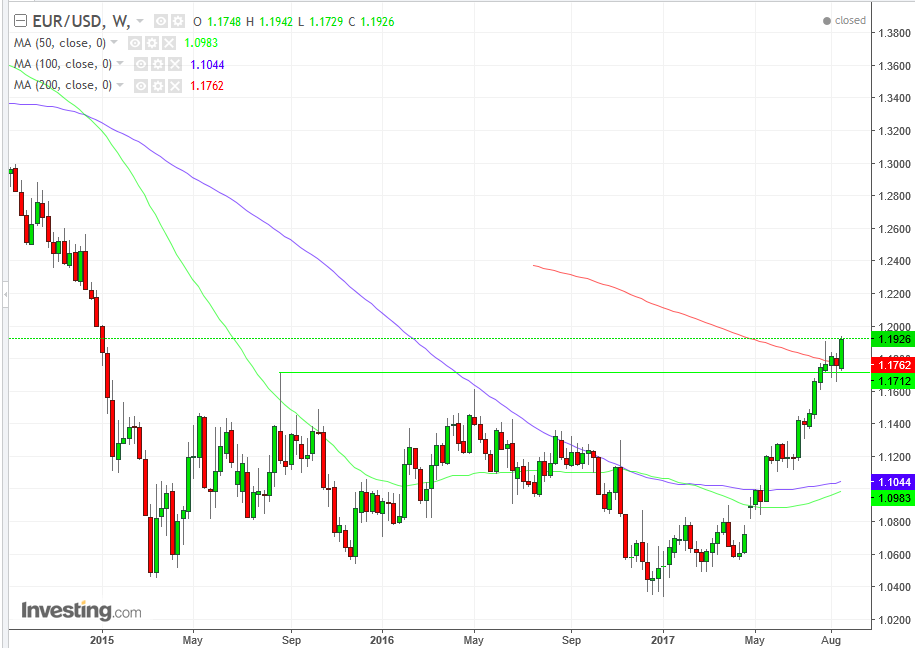
Friday’s weekly EURUSD close and high reached the highest point since January 2015, suggesting an upside move to test the 1.2000 psychological key level, and then to a minimum target of 1.2160, based on the 250-pip range since July, and finally, to 1.2500, based on the minimum 1,000-pip range between 2015 and this year.
10:00: US – Conference Board Consumer Confidence (August): expected to fall to 120 from 121.
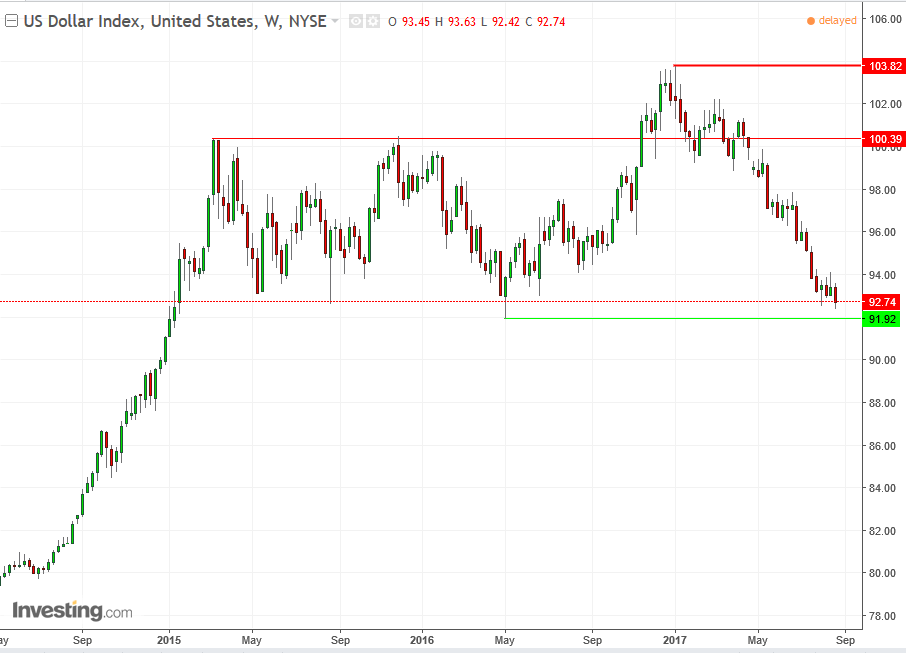
The US Dollar Index is near the support of its lowest price throughout a trading range since the beginning of 2015. Should the price return to the top of the range, as it has done for nearly three years, the downside risk is 0.85 percent to the 91.92 May low and an upside potential of 8.25 percent to the March and November 2015 100.00 peaks, or almost 12 percent to the January 2017, 103.82 high. This provides a risk-reward ratio of 10:1 or 14:1, respectively, in favor of a long position.
Wednesday
5:00: Eurozone – Business Confidence (August): forecast to fall to 1.01 from 1.05.
FX traders drove up the euro at the expense of the dollar, after Draghi said in his Jackson Hole speech that global recovery is firming and did not talk down the euro. Some of the advance was pared, after the ECB chief tempered his earlier bullish tone, stating that significant monetary policy is still needed.
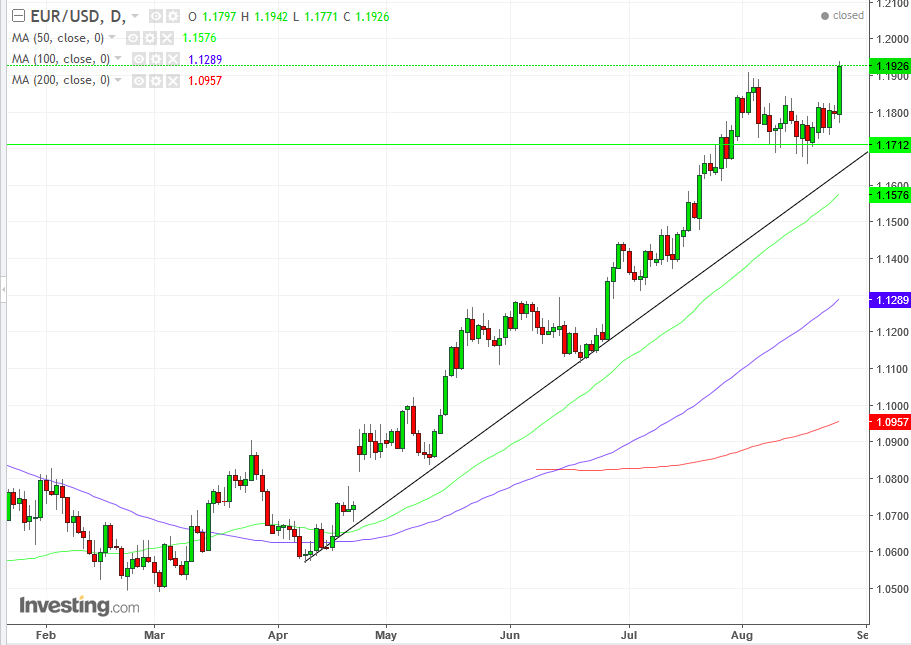
If the pair will be able to breath above 1.1900 we’re likely to see a test of the psychologically significant 1.20 key price. However, a close beneath 1.1900 may suggest a correction toward the uptrend line since April 11, at 1.1700 at the current angle.
8:00: Germany – inflation (August, preliminary): forecast to rise to 1.8% from 1.7%.
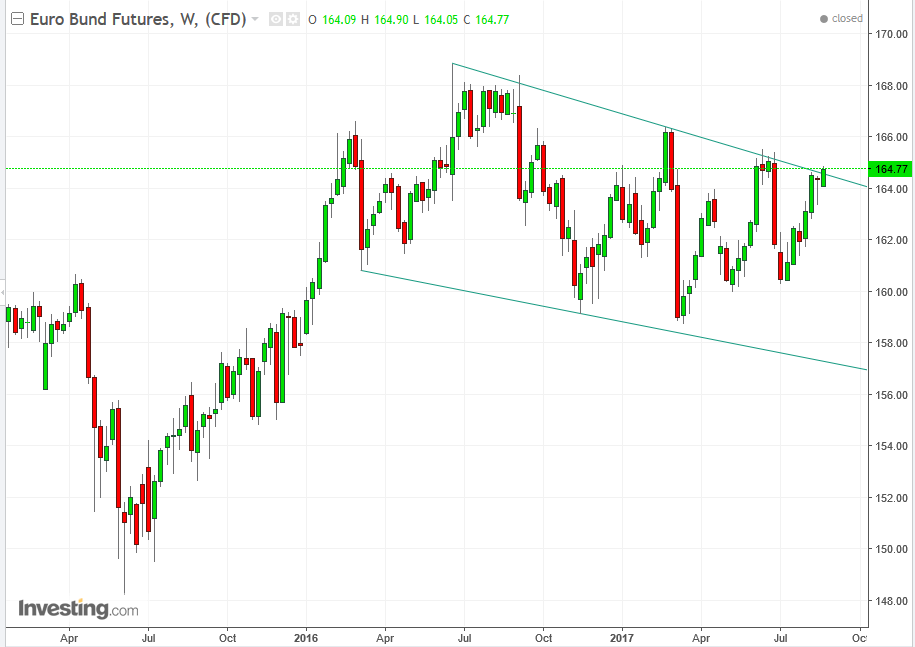
The price of Euro Bund Futures has been trading within a falling channel since June 2016. Last week’s price closed on top of the downtrend line. While a close above the June 12, 165.55 high would suggest a reversal, a close back in the channel would suggest a resumption to 160.
8:15: US – ADP Employment Report (August): forecast to see 180K jobs created, up from 178K a month earlier.
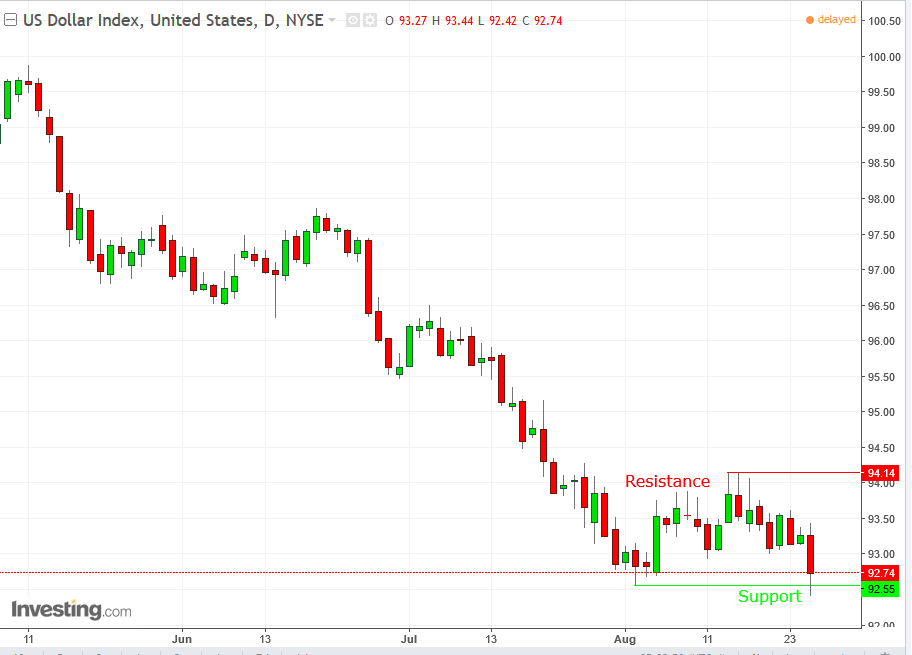
While the DXY declined, it closed above the previous, 92.55, August 2nd low, allowing the possibility of a reversal. A lower low than Friday’s 92.42 would add evidence to a resumption of a down trend, while a close above the August 15 and 16 94.14 peaks may suggest a reversal with a 150-pip upside minimum potential movement to about 95.50.
8:30: US – GDP growth (Q2, second estimate): expected to see QoQ growth of 2.7%, an upgrade from the 2.6% estimate a month earlier.
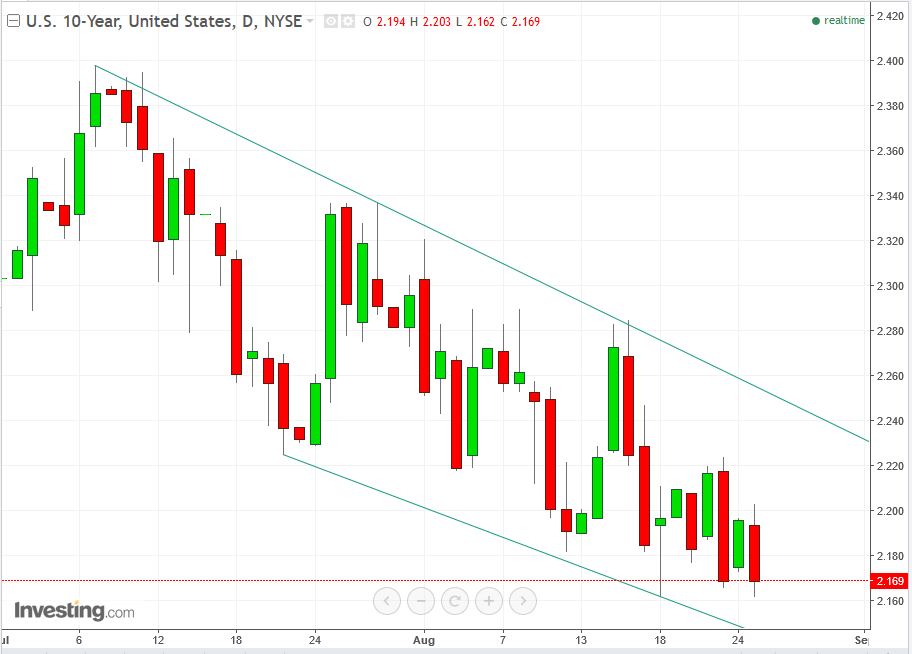
The yield on the US 10-year has been trading within a down-channel since July 7, as risk appetite increased. The support since the High Wave Candle – in itself a signal of a reversal – since August 18 suggests a consolidation at the support of the channel bottom to a corrective rally toward the downtrend line (channel top), toward 2.220
10:30: US – EIA Crude Oil Inventories (w/e 25 August): forecast to see a drop of 200,000 barrels, from a 3.3 million barrel fall a week earlier.
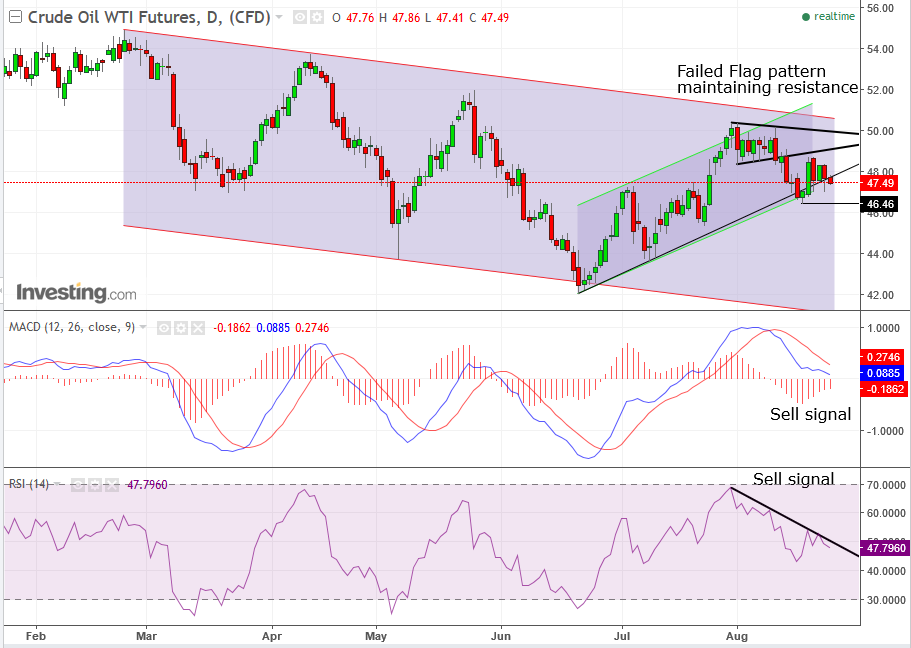
The price of WTI closed on Friday below the shorter-term uptrend line, since July 21, at $47.49, adding to the evidence of a resumption of the down-channel since February 23. However, a clear sell signal will materialize when the price closes below the August 17, $46.46 low. Meanwhile, both the MACD and momentum analysis via the RSI have already provided sell signals since August 9, which are intact.
21:00: China – Manufacturing and Non-Manufacturing PMI (August): mfg PMI to fall to 51.2 from 51.4, while the non-mfg figure drops to 54.4 from 54.5.
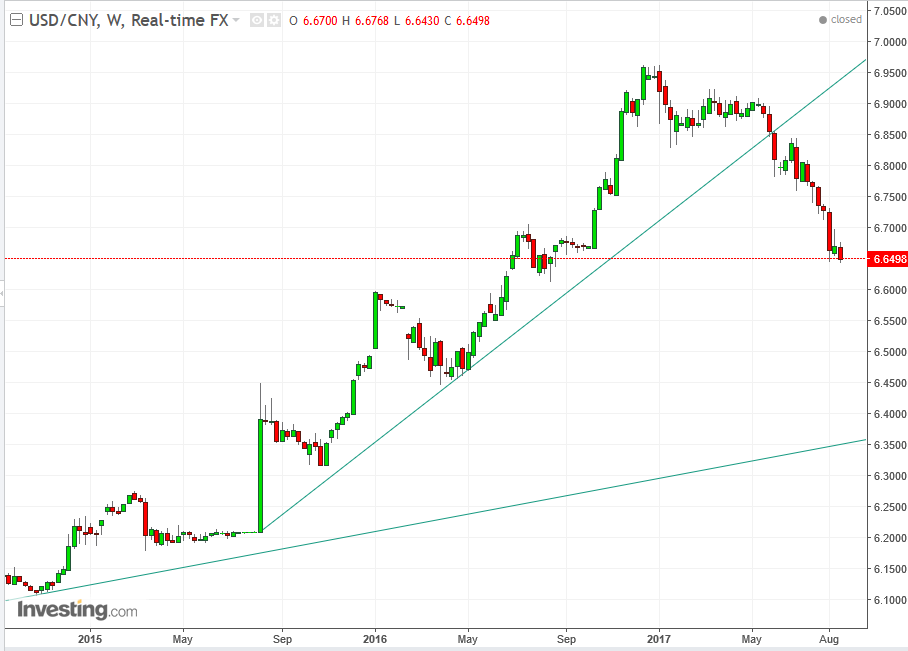
The USD/CNY pair crossed below the uptrend line since August 10, 2015, suggesting a retest of the primary uptrend line since January 2014, at 6.4000 at the current angle, and which will likely coincide with the round 6.5000.
Thursday
3:55: Germany – Unemployment Rate (August): expected to rise to 5.9% from 5.7%.
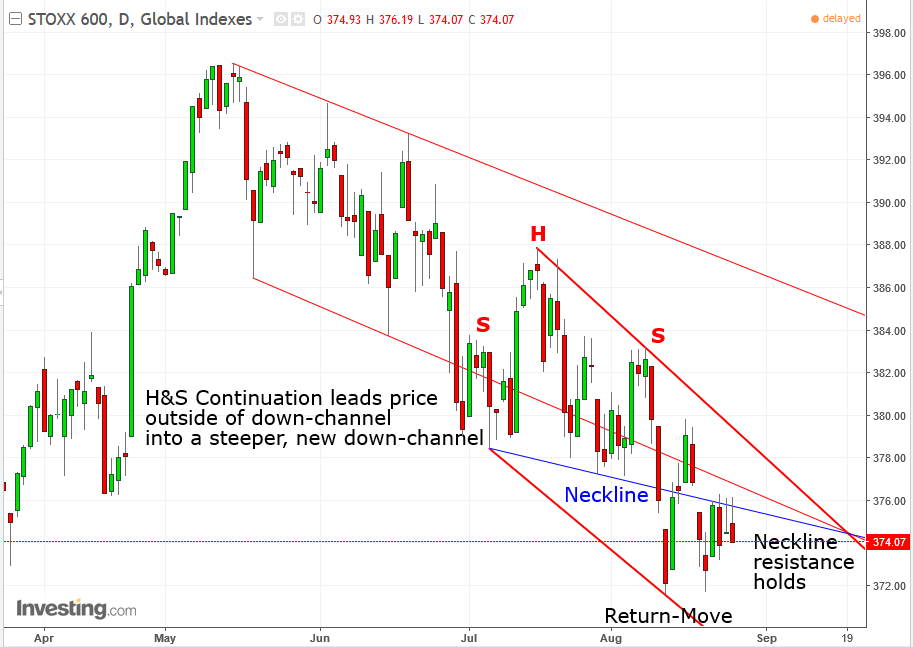
Since May 2017, the STOXX 600 price has been trading in a downward channel. A H&S continuation pattern led it below the channel, into a new, steeper down-channel.
5:00: Eurozone – Inflation (August, flash), Unemployment Rate (July): inflation expected to be 1.5% from 1.3% YoY, and core inflation forecast to be 1.3% from 1.2%. Unemployment expected to hold at 9.1%.
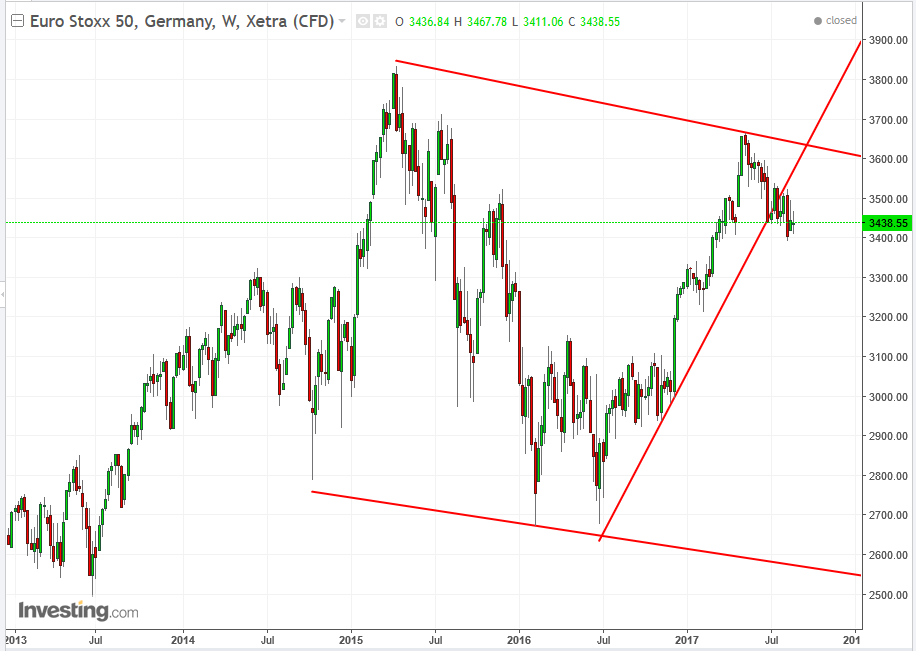
The Euro Stoxx 50 Index appears to have entered a massive down-channel, after declining 7-percent from its May 2017, 3666.80 peak—crossing below its uptrend line since June 2016—which itself failed to overcome the April 2015, 3836.28 peak.
8:30: US – Initial Jobless Claims (w/e 26 August): expected to rise to 236K from 234K. Markets to watch: US indices, USD crosses
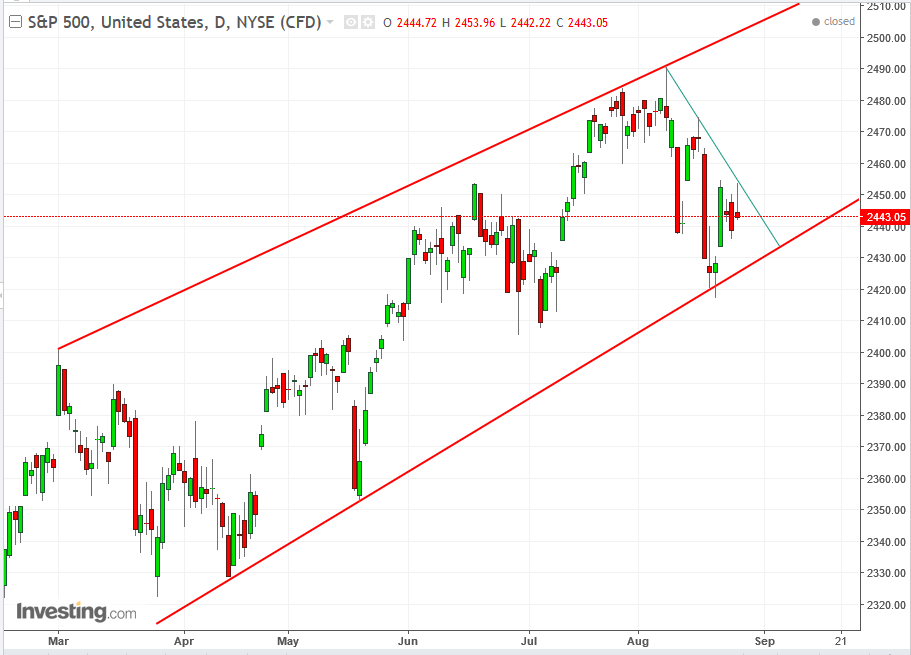
The S&P 500 has been trading within a rising channel since March. On August 21 it confirmed the uptrend line for the third time, producing a hammer and rising 1.5-percent since its low. If the pattern persists, the price should overcome the 2453.96 resistance of Friday’s bearish Shooting Star, which confirmed the shorter downtrend line since August 8. A cross above that resistance would give the price the opportunity to retest the 2480.00 congestion, then the 2490.87 all-time-high, and finally the psychological round-number of 2500.00
8:30: Canada – GDP (Q2): expected to be 0.7% from 0.9%.
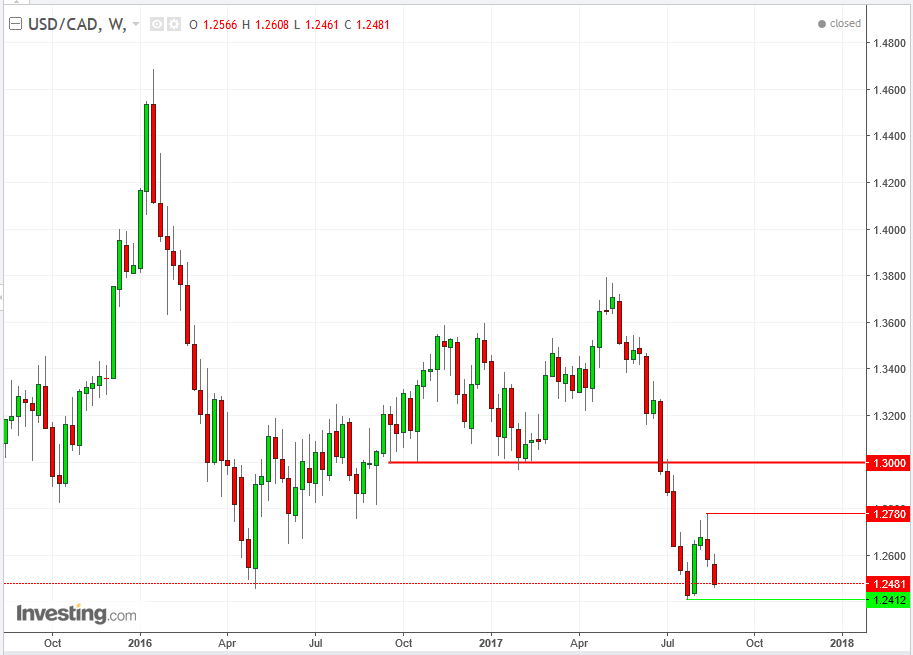
In July, USD/CAD rebounded on the May 2016 support. A close below the July, 1.2412 low would suggest a break of that support, while a close above the 1.2780, August high would suggest a reversal, and a retest of the 1.3000 resistance of the previous support between September 2016 and its break on July of this year.
9:45: US – Chicago PMI (August): expected to fall to 58 from 58.9.
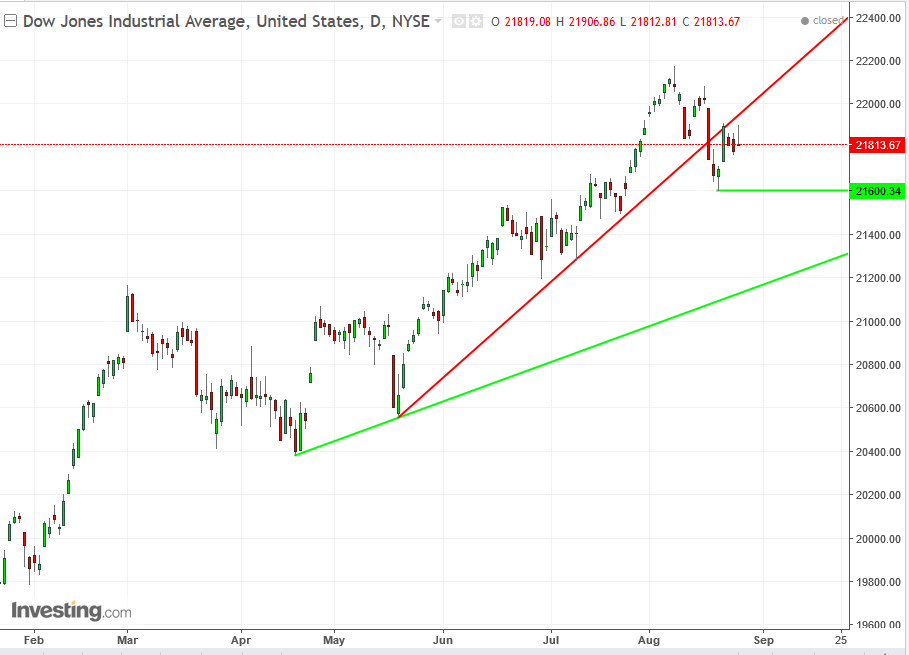
The Dow Jones closed below its uptrend line since May 18, completing a retun move, and the broken uptrend line maintained its new resistance, suggesting a decline to the more tempered—and therefore more sustainable—uptrend line, since Aprill 19, at 21400, at the current angle, while a support should be found on the August 21st hammer’s 21600 support.
21:45: China – Caixin Manufacturing PMI (August): this private survey is forecast to see the index fall to 50.2 from 51.1.
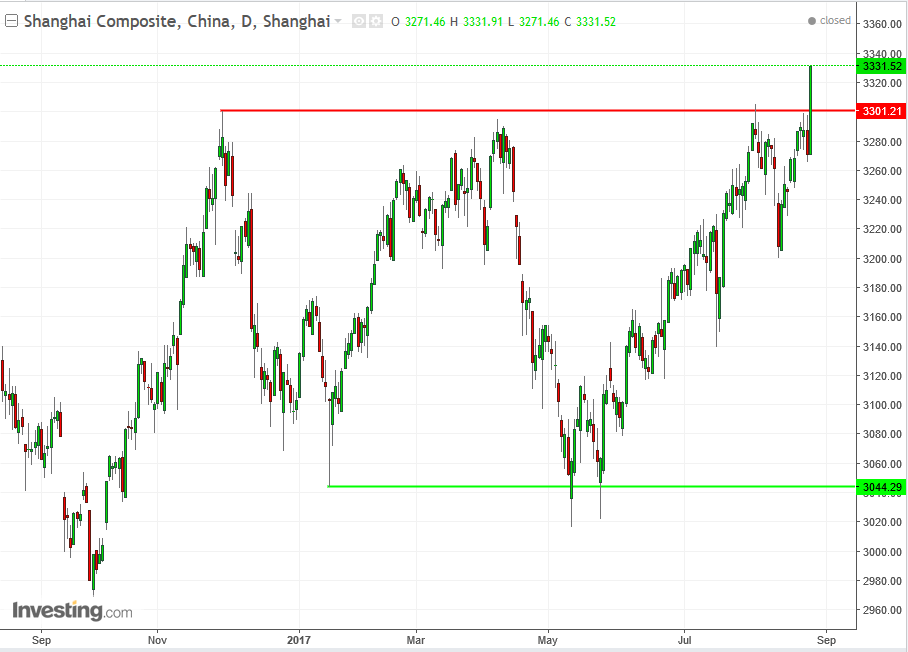
The Shanghai Composite reached its highest level since January 7, 2016, with a close very near the top of its range, a sign that the bears had nothing on the bulls. This registered a close less than 1 percent from the April peak and 0.9 percent from the November peak, which may suggest a breakout of the 250-point or 8-percent range since the end of November, triggering a likely target to the upside.
Friday
1:00: Japan – Consumer Confidence (August): forecast to rise to 44.1 from 43.8.
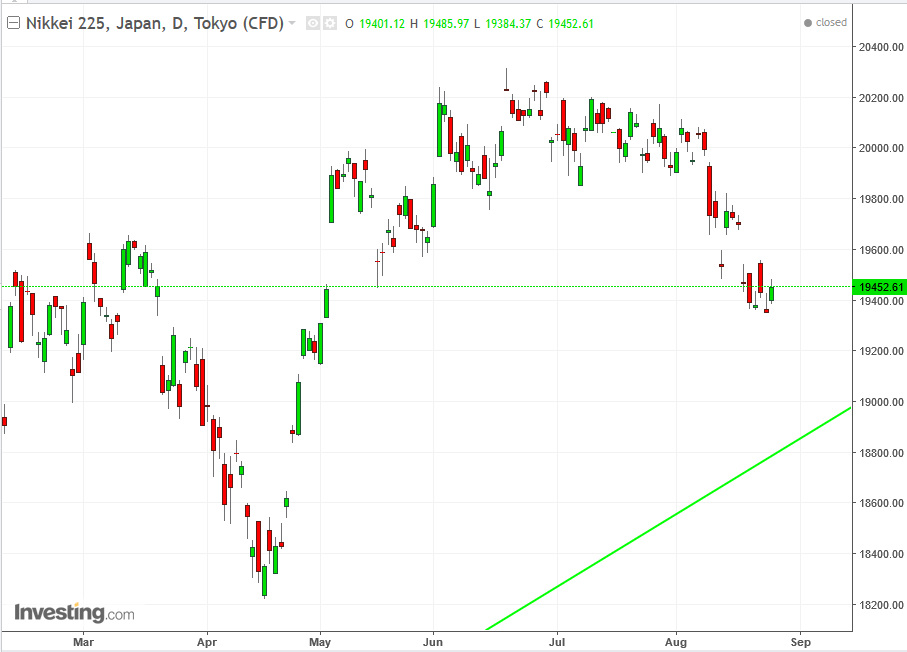
The Nikkei has been declining since its June 20, 20318.11 peak in an extremely congested, sluggish manner. Geopolitics during the month of August finally pushed it down 3.5 percent, toward its uptrend line since June 24, 2016 – the day the results of the UK Brexit vote were published. Both on the 22nd and the 24th, trading produced inverted hammers which is bullish with a confirmation of a higher close in the following sessions. Both have confirmed the repeated candlestick’s bullishness, suggesting an attempt at another rally.
4:30: UK – Manufacturing PMI (August): expected to fall to 54.4 from 55.1.
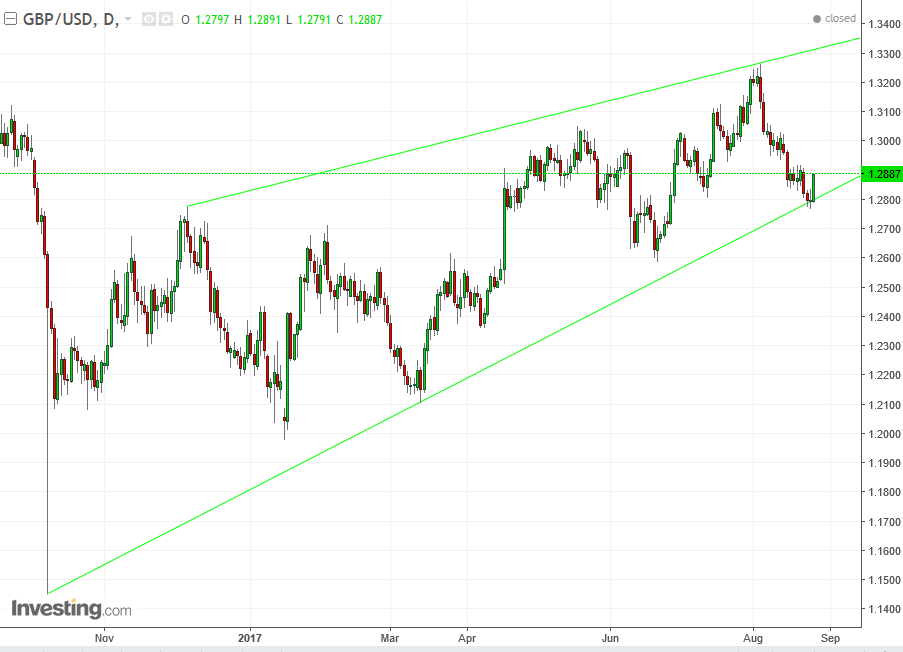
The GBP/USD pair has been registering continuous higher peaks and troughs, including Friday’s biggest advance since July 26, off the uptrend line since October’s flash crash in Asian trading, signaling a bias to a resumption of the uptrend, to be tested at 1.3266, the August 3rd peak.
8:30: US – Nonfarm Payrolls (August): 180K jobs expected to have been created, from 209K a month earlier. Jobless rate forecast to remain at 4.3%, while average hourly earnings expected to be 0.3%, in line with the previous.
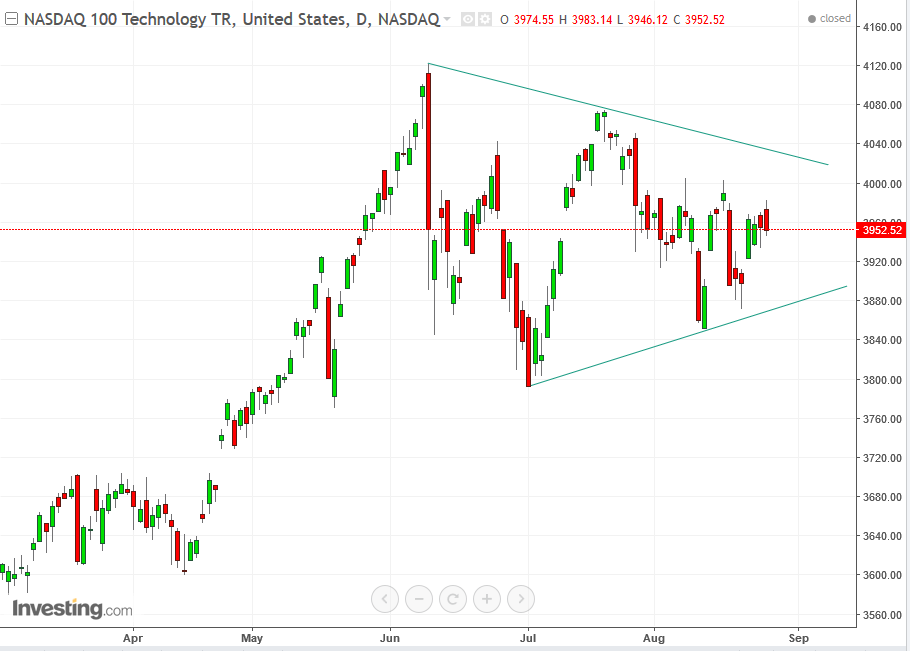
Much has been said about the technology sector, currently the market’s leading segment. However, since June 9 and the Goldman Sachs) report comparing the valuations of big tech companies to where things stood during the internet bubble, the NASDAQ 100 has never recuperated. Other market indices have outperformed it as they continued to register new records, while this technology index failed to make new highs.
The NDX has been trading within a symmetrical triangle. There is a deep argument among analysts whether a triangle by definition is a continuation pattern, as each side of the trade pushes into the resolved trend previous to the interruption; or whether it can be a reversal, as each force spends its capital till a resolution out of the pattern, in either direction, occurs.
Whichever side of the argument is right, the technology sector is moving sideways, while the primary gauges keep rising. A close beneath 3800 should be a clear bearish indication, while a close above 4100 would be a clear bullish indication.
10:00: US – ISM Manufacturing PMI (August): expected to fall to 56.2 from 56.3.
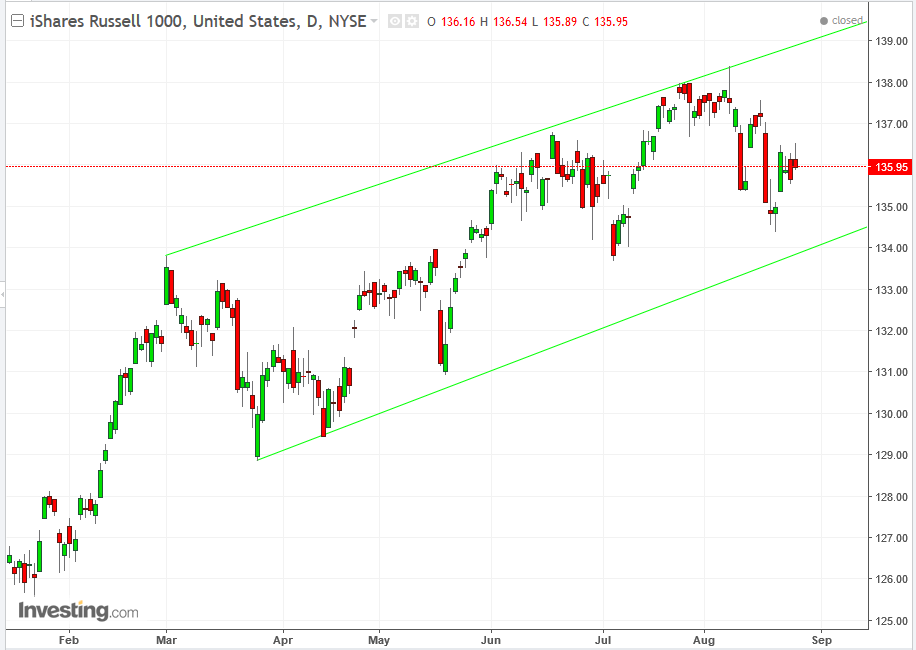
The iShares Russell 1000 (NYSE:IWB) has been trading within a rising channel since March. A dip to 135.00 would be a good opportunity for a long position, both from trend analysis, as well as an attractive risk-reward ratio, to 138.00.
Which stock should you buy in your very next trade?
AI computing powers are changing the stock market. Investing.com's ProPicks AI includes 6 winning stock portfolios chosen by our advanced AI. In 2024 alone, ProPicks AI identified 2 stocks that surged over 150%, 4 additional stocks that leaped over 30%, and 3 more that climbed over 25%. Which stock will be the next to soar?
Unlock ProPicks AI