Wednesday August 9: Five things the markets are talking about
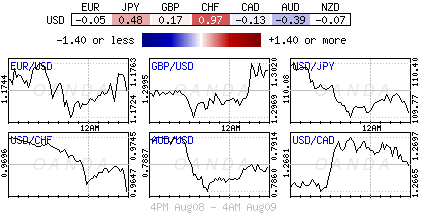
Capital Markets are on the defence as a risk-off tone dominates proceedings overnight, with gold ($1,268.34) and the Japanese yen (¥109.70) advancing and sovereign bond prices edging higher as tension grows between the U.S and North Korea.
Gold prices are heading for its largest gain this month while JPY and CHF remain the biggest winners among G-10 currency pairs after President Trump issued a warning yesterday that if North Korea escalates the nuclear threat, “they will be met with fire and fury like the world has never seen.” Global equities are slumping while oil prices retreat on ‘oversupply’ concerns.
In retaliation, North Korean’s state-run media issued a statement saying, “U.S war hysteria will bring a miserable end.” The market is concerned that North Korea could strike before any preemptive attack by the U.S.
Note: North Korea said it was examining an operational plan for firing a ballistic missile toward Guam, a U.S territory in the Pacific Ocean.
1. Stocks Sea of red
In Japan, the Nikkei skidded to a 2-1/2 month low on rising North Korea risk. The index dropped -1.3% overnight, the weakest closing level since May 31, but defence equipment makers attracted buyers. The broader Topix Japan’s TOPIX index fell -1.1%, the most since May 18.
In Hong Kong, shares ended lower, but developers provided support. The Hang Seng index fell -0.4%, easing away from its two-year high print on Tuesday, while the China Enterprises Index lost -1.1%.
In China, financials dragged stock markets lower amid concerns that regulators will continue to clamp down on debt risks, but strong gains in consumer staples left major indexes only slightly lower on the day. The blue-chip CSI300 was unchanged, while the Shanghai Composite Index dipped -0.2%.
The outlier was Australia’s S&P/ASX 200 Index resisted the region-wide downward trend to add +0.4%.
Note: The CBOE Volatility Index (VIX) closed at 10.96, its highest in about a month, while the CBOE SKEW INDEX, or “black swan” index, which measures the likelihood of extreme moves in the S&P 500 based on how traders are pricing the index’s options is at 140.03 ahead of the U.S open. In July, it traded mostly between 120-140.
In Europe, regional bourses have opened down and have continued in the same direction ahead of the open stateside. Gold is higher, but is not translating into support for materials.
U.S stocks are set to open deep in the red (-0.3%).
Indices: Stoxx50 -1.1% at 3,476, FTSE -0.6% at 7,496, DAX -1.0% at 12,168, CAC 40 -1.2% at 5,155, IBEX 35 -0.9% at 10,643, FTSE MIB -1.1% at 21,809, SMI -1.3% at 9,040, S&P 500 Futures -0.3%
2. Oil steady ahead of U.S inventory report, gold higher
Oil prices are holding their own ahead of the U.S open after yesterday’s weekly API inventory reported a large drop in U.S crude stocks countered balanced industry doubts that compliance with OPEC-led supply cuts will increase.
Note: U.S crude inventories last week fell by -7.8m barrels, more than expected, but gasoline inventories rose unexpectedly.
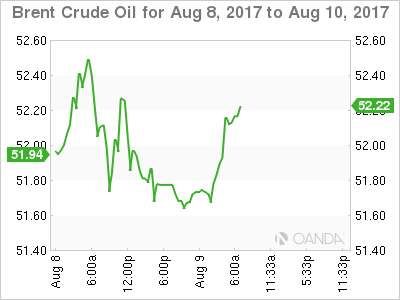
Brent crude is unchanged at +$52.14, after two days of decline, while U.S. West Texas Intermediate (WTI) crude added +4c at +$49.21.
The market will takes its cue from today’s EIA report (10:30 am EDT) to see whether it confirms the yesterday’s API release. The market is looking for crude stocks to have fallen by -2.7m barrels and gasoline by -1.5m barrels.
Note: OPEC in Abu Dhabi this week in an effort to boost producers’ adherence to the supply cuts. The post meeting joint statement said the “conclusions reached would help boost compliance.” However, OPEC was short on details.
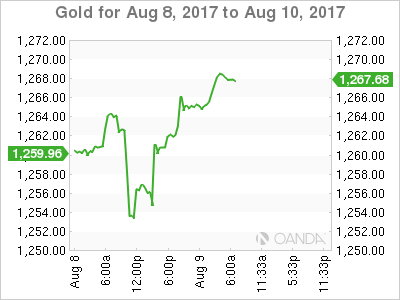
Gold prices remain better bid (+0.4% to $1,265.70 per ounce) amid rising tensions between the U.S and North Korea after the North responded to warnings from U.S. President Donald Trump with a threat to strike the U.S. territory of Guam.
Note: Stronger-than-expected U.S JOLTS jobs data weighed on gold Tuesday, dragging prices to the lowest since July 26 at +$1,251.01 an ounce.
3. Sovereign G7 yields fall on safe haven play
Geopolitics is supporting G7 government bond prices as investors rush to safer-assets after U.S President Trump warned North Korea that it will face “fire and fury” if it keeps threatening the U.S.
Yields on 10-Year Bunds have dropped -1.3 bps to +0.46% in early European trading, while U.S. 10-Year Treasuries have declined -1 bps to +2.25% ahead of their session.
In the U.K, issuance of new Gilts is scheduled to resume Aug. 23. Until then, lack of supply should make it difficult for gilt yields to rise and this should also help gilts out-perform U.S treasuries in the near term.
The medium-term outlook depends on the BoE – Governor Carney and company is expected to find it difficult to hike policy rate given the downside risks to growth. Yields on 10-Year gilts dropped -2 bps to +1.13%, the lowest in six-weeks.
4. Dollar finds risk aversion support
It’s only natural that risk aversion currencies have benefited now that President Trump has raised his rhetoric against North Korea to an unprecedented level.
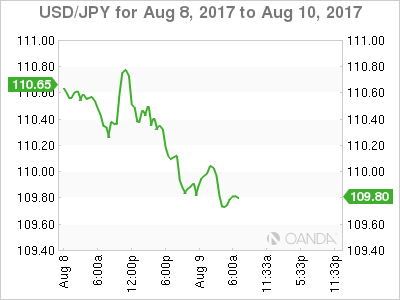
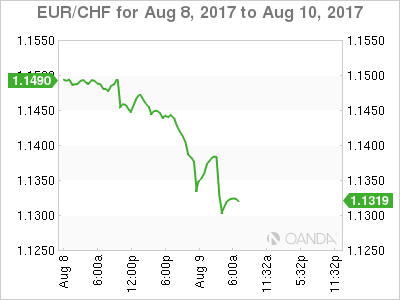
USD/JPY (¥109.84) fell to a fresh two-month low of ¥109.65, while USD/CHF was lower by over -1% to test below €0.9630, while EUR/CHF cross edged away from its recent three-month highs atop of €1.15 to dip below the psychological €1.13 level.
The ZAR is down outright ($13.4470), reversing yesterday’s gains, as President Zuma has survived another no-confidence vote (his seventh). The rand rallied Monday given expectations that Zuma’s eight-year term will be voted out in a secret ballot. Expect ongoing medium term political volatility for the rand.
Down-under, RBA Assistant Governor Kent reiterated that a further rise in AUD (A$0.7888) would result in slightly lower domestic growth – AUD currency appreciation has been more about “dollar weakness and not linked to commodity prices.”
5. China inflation undershot expectations
Data overnight from China showed that China’s producer price gains held steady on surging commodity prices, as demand stayed resilient and the government’s drive to reduce industrial capacity takes hold.
The Producer Price Index (PPI) rose +5.5% in July y/y vs. a market estimate of +5.6%. On a month-on-month basis, the PPI rose +0.2% last month, after three months in the red.
While the Consumer Price Index increased +1.4% vs. a forecast of +1.5% – well below the government ceiling of +3%.
Note: Analysts say given expectations of deeper capacity cuts heading into Q4, keeping supply tight and prices up, operating margins for businesses will probably remain solid in a boost to the bottom line.
