Wednesday August 2: Five things the markets are talking about
To date, political risks and U.S monetary policy uncertainty have plagued the dollar, while the eurozone’s common currency has found support from expectations that the ECB would eventually begin phasing out its ‘easy’ policy.
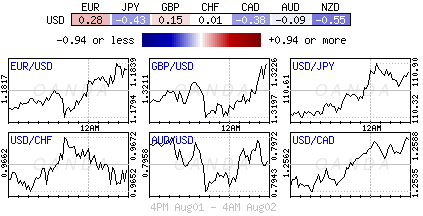
Ahead of the U.S open, the EUR (€1.1863) again traded at a new 30-month high, while the ‘mighty’ dollar trades steady against G10 pairs, halting its recent losing streak as some investors have extended an unwinding of ‘short’ bets on the currency, particularly against the NZD and CAD dollar currencies. Not helping commodity sensitive pairs are fears of a trade spat between U.S and China that again seems to be simmering.
The neutrals are beginning to question whether the ECB ‘hawkish’ expectations that are being priced into the market may be premature.
This months Kansas City Fed’s Jackson Hole Symposium (Aug 24-26) should be the perfect opportunity for G7 policy makers to communicate clearly their intentions on “normalizing” policy in a normal economic environment.
Reports today stateside on private employment (ADP 8:15am EDT) and crude oil inventories (EIA 10:30 am EDT) will provide more clues about the direction of U.S economy.
1. Global stocks see mixed results
Mining and oil shares continue to weigh on a number of global bourses overnight, trumping tech stocks supported by Apple’s results.
In Japan, the Nikkei share average rallied +0.5% to a 10-day high overnight, supported by strong domestic earnings as well as a rally among Apple’s suppliers after yesterday’s earning results. The broader Topix index gained +0.4%, supported by the automotive sector earnings.
Down-under, Australia’s S&P/ASX 200 Index fell -0.5%, weighed down lower commodity prices, while South Korea’s KOSPI index added +0.2%.
In Hong Kong, the Hang Seng Index was +0.2% higher, supported mostly by financials and material firms, while the Shanghai Composite Index swung between gains and losses.
In China, stocks slipped, with continued strength in materials shares offset by weakness in small-cap firms. The blue-chip CSI300 index fell -0.3%, while the Shanghai Composite Index lost -0.2%.
In Europe, most indexes are tracking lower ahead of the U.S open. Lower oil prices are dragging on energy stocks, while the material is underperforming following drops in commodity prices. Apple’s earnings are supporting the tech sector.
U.S stocks are set to open in the black (+0.1%).
Indices: Stoxx50 -0.3% at 3,463, FTSE -0.5% at 7,330, DAX -0.2% at 12,229, CAC 40 -0.3% at 5,110, IBEX 35 -0.1% at 10,558, FTSE MIB -0.2% at 21,525, SMI +0.8% at 9,107, S&P 500 Futures +0.1%
2. Oil prices retreat for a second session, gold steady
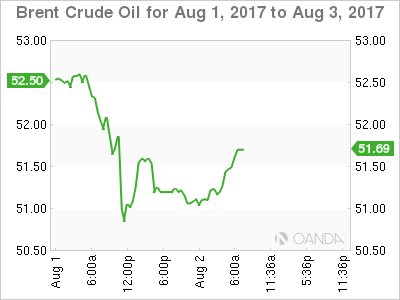
Oil prices continue to retreat from their two-month highs, following a bearish combination of rising U.S inventories, an outage at a European refinery and increasing OPEC production.
Ahead of the U.S open, Brent crude futures are down -11c at +$51.67 a barrel – The price hit +$52.93 on Monday, its highest since late May. U.S West Texas Intermediate (WTI) also fell -11c, to +$49.05 a barrel.
Note: Both contracts dropped sharply Tuesday after Royal Dutch Shell (LON:RDSa) said its +400k bpd refinery in the Netherlands would remain offline for at least the next couple of weeks following a fire.
Adding pressure to prices was yesterday’s unexpected rise of +1.8m barrels in U.S crude inventories (API), which has hopes that recent inventory draws signified a tighter inventory market stateside.
Expect the market to take direction from this morning EIA report (10:30 am EDT -3.2m expected drawdown).
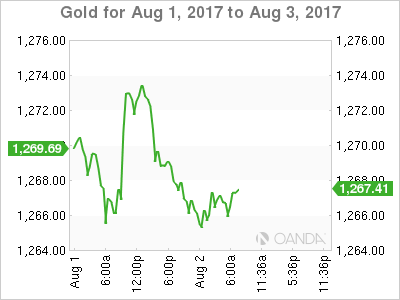
Gold prices (-0.2% to +$1,266.43 an ounce) are edging away from its two-month highs as ‘mighty’ dollar steadies. The prudent investors will continue to look for further evidence of stronger U.S inflation numbers before they get a little bit more optimistic about a rate hike, which remains a natural headwind for gold prices.
3. Yield curves little changed
Overnight as expected, the Reserve Bank of India (RBI) cut their overnight funds rate (repurchase) by -25 bps to +6% as inflation and economic growth slows.
Note: Consumer-price inflation (CPI) in Asia’s third-largest economy slowed to +1.5% in June, well below the +2% bottom of the RBI’s target range.
Their accompanying statement noted that their policy stance remained “neutral.” The decision to cut key rates was not unanimous (4-1) with lone dissenter seeking to keep policy steady. The RBI noted that the inflation trajectory is expected to rise from current levels.
Nevertheless, fixed income futures are pricing in another -25 bps rate cut within the next 12-months.
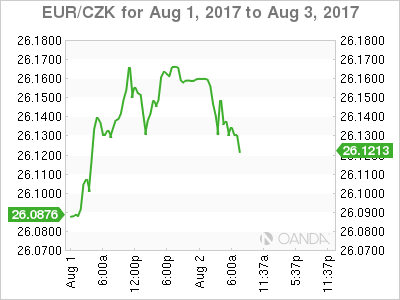
The Czech central bank (CNB) meet tomorrow (07:00 am EDT) and a percentage of the market are preparing itself for a possible hike in the base rate.
Note: A rise in the Czech benchmark rate, which is currently the lowest in Central Europe at +0.05%, would be the first tightening in the region in four years.
Arguments for a ‘hike’ include solid economic growth of around +3% expected for this year and next and inflation above target, coupled with wages and house prices soaring (EUR/CZK €26.1294).
Elsewhere, the yield on U.S. 10-Year Treasuries has backed up +2 bps to +2.27%. Germany’s Bund 10-Year yield rallied +1 bps to +0.50%, while U.K’s 10-Year Gilt yield advanced +2 bps to +1.24%, the highest in a week.
4. Dollar steady, EUR prints new highs
Improving risk sentiment is aiding emerging market (EM) currencies and Europe’s single unit in recent sessions.
Ahead of the U.S open, the EUR managed to print fresh 30-month highs outright at €1.1863, but has since backed off on some profit taking (€1.1833). It continues to trade firmer against other G10 pairs.
The ‘big’ dollar has also stabilized against most of the majors. The yen is again a tad softer with USD/JPY up +0.7% at ¥110.77 – recent local election defeats by economic reform-minded candidates in Japan suggest PM Abe will now bring in new faces to the cabinet who will, in turn, push hard on his ‘third arrow’ structural reforms.
Commodity currencies, (C$1.2560, A$0.7955 and NZ$0.7424) are under pressure from lower crude oil, gold and dairy prices.
5. UK July construction PMI falls to 11-month low
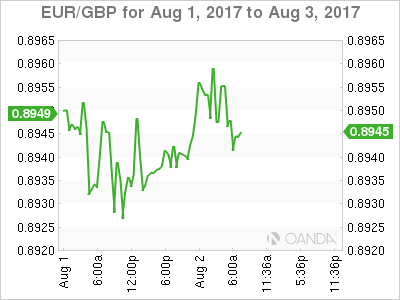
U.K data this morning, Purchasing Managers’ Index on U.K. construction sector activity fell to its lowest since August 2016 last month, at 51.9, down sharply from 54.8 in June.
According to Markit, which compiles the survey, the July slowdown reflects “lower volumes of commercial building and a softer expansion of housing activity.”
Digging deeper, the survey also showed reduced new business volumes for the first time in 11-months, while prices for construction materials increased at one of the sharpest rates since H1 2011.
