Monday May 14: Five things the markets are talking about
Last week was a light week on the economic data front as the market focused again on the continued outpouring of earnings reports and geopolitical news from Asia and the Middle East.
This week there are no central bank meeting scheduled, however, there are a number of moving parts that are expected to keep capital markets on their toes.
U.S. and Chinese officials will meet in Washington for a second round of trade talks mid-week, after apparently making little progress in discussions in Beijing earlier this month. Also stateside, both Canada and Mexico are ‘not’ doing a convincing job in trying to downplay the urgency to reach a Nafta deal/outline this week.
Elsewhere, flash Q1 GDP data will be released for the Eurozone, Germany and Japan (May 15). In the U.K, it releases its April labour market report (May 15), while down-under we get Aussie employment data (May 16).
Stateside, U.S. retail sales (May 15) and industrial production are due while we close out the week with Canadian CPI and core-retail sales (May 18).
In the Middle East, investors can expect this powder keg to remain a key focus with displays of aggression between Israel and Iran on the rise.
1. Stocks in the ‘black’
Global equities head higher on hopes of thawing trade tensions.
In Japan, the Nikkei share average rose to a four-month high overnight following sharp gains in cosmetics after better-than-expected earnings offset weak tech shares. The Nikkei ended +0.5% while the broader Topix rallied +0.6%.
Down-under, Aussie shares rose on Monday, carried higher by BHP hitting its highest in four-years. The S&P/ASX 200 index rose +0.3%. In S. Korea, the KOSPI ended the session flat.
In Hong Kong, stocks rose for a six consecutive session and hit a more than seven-week high overnight, as Sino-U.S trade tensions eased. The Hang Seng index rose +1.4%, while the China Enterprises Index gained +1.6%.
In China, it was a similar story, easing trade tensions between Beijing and Washington gave investors the green light. The blue-chip CSI 300 index rose +0.9%, while the Shanghai Composite Index rose +0.3%.
In Europe, regional indices trade mostly lower in a subdued session, however, there is one exception, the Swiss SMI trades slightly higher.
U.S. stocks are expected to open a tad higher (+0.2%).
Indices: STOXX 600 -0.2 at 391.8, FTSE -0.1% at 7717.4, DAX -0.2% at 12972, CAC 40 -0.2% at 5532.3, IBEX 35 -0.2% at 10254, FTSE MIB -0.1% at 24127, SMI +0.2% at 9010, S&P 500 Futures +0.2%
2. Oil slips from multi-year highs as U.S. rig count rises, gold higher
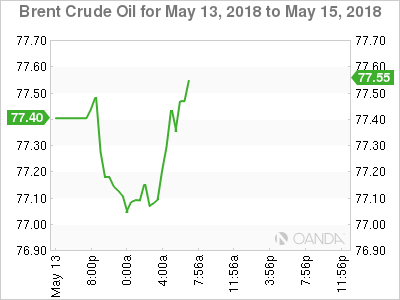
Oil prices eased from just shy of their four-year highs overnight as resistance emerged in Europe and Asia to U.S. sanctions against major crude exporter Iran, while rising U.S.drilling pointed to higher N. American production.
Benchmark Brent is down -40c at $76.72 a barrel, while U.S light crude oil is down -35c at +$70.35.
Note: Both oil futures contracts hit their highest levels in nearly four-years last week at +$78 and +$71.89 a barrel respectively, as markets anticipated a sharp fall in Iranian crude supply once U.S sanctions bite later this year.
U.S. Iran sanctions is supporting China’s newly established crude oil futures, and may spur efforts to start trading oil in yuan rather than dollars. Since launching in March, Shanghai crude oil futures have seen a steady pick-up in daily trading, with daily volumes hitting a record +250k lots last week.
Note: According to Baker Hughes data on Friday, capping crude prices is U.S. drillers adding 10 oil rigs in the week to May 11, bringing the total to 844, the highest level since March 2015.
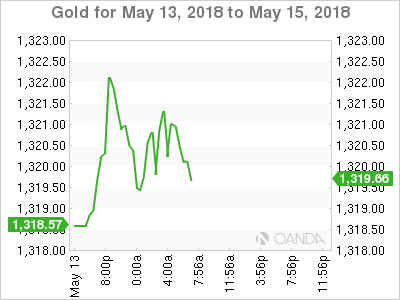
Ahead of the U.S. open, gold prices are a tad better bid on the back of a subdued dollar as the market considers the prospects of fewer interest rate hikes in the U.S. this year. Spot gold is up +0.2% at +$1,320.80 per ounce, while U.S gold futures for June delivery is little changed at +$1,320.80 per ounce.
3. German Bund yields rally to a two-week high
The benchmark German 10-year bund yield has pushed back to a two-week high ahead of the U.S open and is set for the biggest daily rise in three-weeks, after the ECB’s Francois Villeroy de Galhau said the central bank could give fresh guidance on the timing of its first rate hike as the end of its bond stimulus approaches.
His comments have certainly caught the fixed income market flat footed in a relatively thin market and in a week where European corporate bond supply is expected to dominate sentiment.
The German 10-year bund yield has backed up to +0.60%, its highest level since April and up +4 bps on the day.
Elsewhere, the yield on two-year Treasuries has dipped less than -1 bps to +2.53%, the first retreat in more than a week, while the yield on 10-year Treasuries climbed less than +1 bps to +2.97%. In the U.K, the 10-year Gilt yield has advanced +2 bps to +1.467%.
4. Dollar under pressure
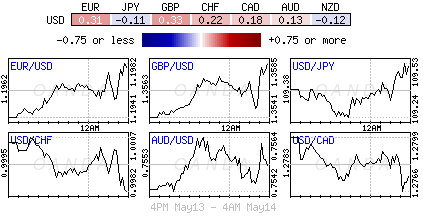
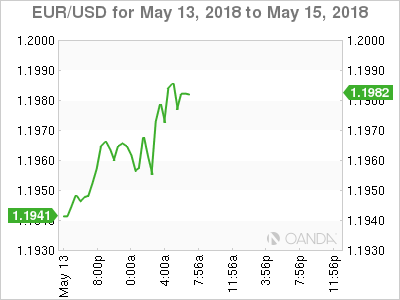
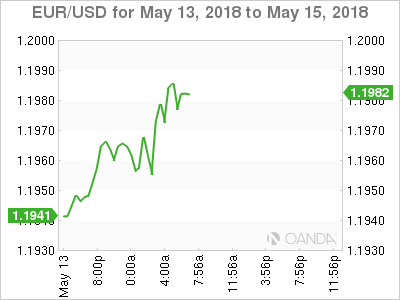
The EUR (€1.1978) is better bid heading into the U.S session, mainly due to dollar weakness, but also because Italy’s 5-Star Movement and far-right League have agreed to form a government.
Although there may be concerns about a government made up of anti-establishment parties, but should reduce for the time being any enduring risks of another Italian election and ongoing political impasse. However, follow-through price support for the single unit is expected to be somewhat minimal as the market awaits details on policy proposals and the name of Italy’s next Prime Minister.
GBP/USD (£1.3580) is edging aging towards the pivotal £1.3600 resistance. The market is looking to Tuesday’s UK jobs data for guidance. A sustainable move above the psychological £1.3630 area could flush out weak shorts in the short-term.
Note: UK average earnings for Q1 are expected to have risen +2.9% compared with a +2.8% rise in Q4, 2017.
Elsewhere, Bitcoin (BTC) continues to fall, down -4% to $8,357 in the euro session. Last week it lost -13% mainly due to criticizing comments from Warren Buffet and Bill Gates, and the fact that S. Korean’s biggest cryptocurrency exchange was raided by the regulators.
5. Banque De France – French growth to slow
Banque De France (BoF) expects the French economy to continue growing in Q2, albeit at the slower pace it set at the start of the year.
Q2 GDP will rise +0.3% on quarter, according to the central bank’s monthly survey of business activity that was conducted in April. At +0.3%, growth marks a slowdown from 2017 when the French economy accelerated sharply. In Q4 2017, GDP expanded at +0.6% on quarter.
Digging deeper, sentiment indicators for April inched down in manufacturing and services, with both falling to 102 from 103. In construction, the sentiment indicator declined slightly to 104 from 105. The long-term average for the sentiment indicators is 100.
