Things were looking a little scary for the bulls into the start of US trade and the view that tactically various risk assets were due a pullback was starting to play out.
Our ASX 200 opening call overnight (around 01:00 aedt) got as low as 5975, with SPI futures trading down to 5984 or -0.8%. Naturally, the lead for SPI futures came from S&P futures, which were heavy through European trade and dragged lower by selling in the Euro Stoxx 50 and DAX index, although both staged a decent comeback to finish modestly lower. The German DAX traded into the 13000 to 12900 support zone, which now looks like rock solid support on the daily timeframe, so in the session ahead if the bulls can dominate and we see a higher high then that should be respected and could mark a short-term low in the index.
The S&P 500 cash index opened on its lows of 2574, naturally in-line with how the futures market had been reacting, with buyers then steeping in from the get-go and pushing the index slightly above the flat line. The buy-the-dip mentality is still very much in place, but then again who wants to sell and realise a capital gain when you may get a lower tax rate next year?
Either way, we can see an improvement in market breadth (60% of S&P 500 companies are trading higher), with good volumes going through the various exchanges. Notably, the Dow, where value traded was some 52% above the 30-day average. One can put emphasis on General Mills Inc (NYSE:GIS), which is lower by 8% and taking 11 points out of the market and as something Telstra Corporation Ltd. (AX:TLS) shareholders will attest to, the market is never enthused when management lower you dividend by 50%, even if this does still represent an above sector payout ratio of 85% of forecast free cash flow. Sector-wise, we can see broad sector appreciation within the S&P 500, with utilities and staples leading the way, with modest gains in materials (+0.6%) and financials (+0.3%). Energy and industrials have seen small losses and have been the laggards.
Small underperformance has once again been seen in high yield credit, with spreads widening by a single basis point, but there is no cause for concern here. The Russell 2000 is trading largely unchanged, although the noise around US tax reform is set to heat up with headlines just out that the Senate Finance Committee will release its revised tax plan tonight. So this index will be worth watching as it is the poster child of all things tax reform and will be well traded as the vehicle on how tax reform plays out and whether the House and the Senate can reconcile the key difference in tax reform.
In fixed income land, we have seen a slight bear flattening of the Treasury curve, with two-year Treasuries ticking up two basis points (bp) to 1.68% (the highest level since October 2008), while the 10-year and longer-end of the curve remains anchored at 2.40%.
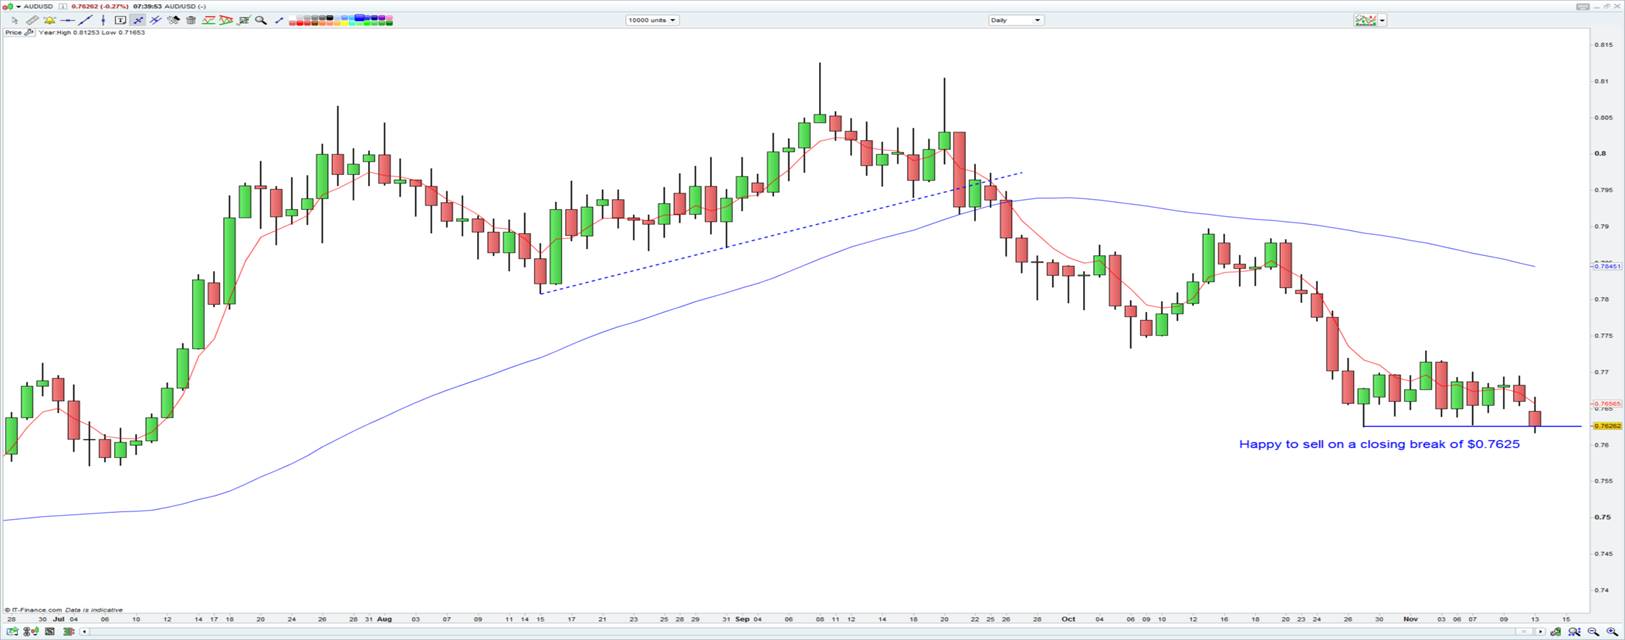
The attention of AUD/USD traders has been fixed on the yield premium commanded to hold Aussie 10-year bonds over US 10-year Treasuries and the fact this yield differential has dropped from 61bp in September to currently sit at 22bp and eyeing a move into the year low of 14bp. I would urge switching to focus on the five-year part of the bond curve, which obviously has a strong sensitivity to monetary policy changes over the coming five-years. Here, we can see the yield advantage the Aussie bond commands falling to a mere 6 bp over US 5-year Treasuries and the smallest premium since July 2000. AUD/USD, itself is trading heavy and lower by 0.5% on the session and a close below $0.7625 (the 27 October low) would open up further downside and I am a willing seller through here on both a trend and momentum basis. In terms of event risk for the session ahead and there are a few to focus on, although whether they affect price is another thing.

AUD/CAD is another chart on the radar and as seen on the daily timeframe, we can see price having broken the September uptrend and looking like it wants to test the September lows. A close through c$0.9799 opens up strong downside in my opinion.

So locally, we get the NAB business conditions and confidence report at 11:30 aedt, although I would not expect this to promote too great a reaction. China is in focus and while we saw the release of the October credit data overnight, which showed M2 money supply and new yuan loans were both below the market's forecast, while total social financing has held up well. If we look at the China CSI 300 ETF (NYSE:ASHR ETF) there has been little concern here and we see it trading +0.2%. Fast forward to 13:00 aedt though and we get the October data dump, with retail sales (consensus at +10.8%), fixed asset investment (+7.3%) and industrial production (6.3%) in play, but again, we find markets like copper and AUD have not been overly sensitive to this release for a while.
Our call then for the ASX 200 sits at 6009 (-12 points) and it will be of interest to see how investors and trader act from around 10:10 aedt and the full unwind of the market. BHP Billiton (LON:BLT) Ltd ADR (NYSE:BHP) looks set to open -1.2% and that should weigh, with energy also likely to struggle if it follows the lead from the S&P 500 and the modest selling in both US and Brent crude. As a guide for the materials space, we see spot iron ore -0.7%, although more positive flows have been seen in the Dalian futures exchange with iron ore, steel, and coking coal closing up +0.8%, 0.5%, and +0.3% respectively. Copper is up 1.5%. Financials, as always are key but there doesn’t seem to be any clear catalyst for the space on open.
