Wednesday November 15: Five things the markets are talking about
Market risk-off continues to dominate capital market moves; both European and Asian stocks have seen ‘red’ in their sessions while bonds and gold prices advanced.
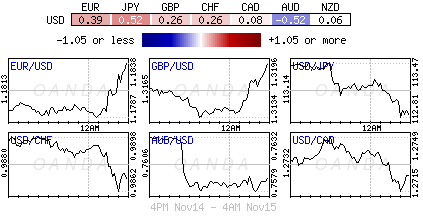
The dollar has fallen to its lowest level in nearly three weeks overnight, reflecting the diminishing expectations that Republicans will be able to push through a tax overhaul this year.
Investors attention now turns to data coming out of the U.S. this morning – consumer prices and retail sales (08:30 am EDT) should provide clues on the strength of the world’s largest economy after the ‘flattest’ U.S. Treasury yield curve in a decade is raising concern that growth will slow.
1. Stocks see ‘red’
In Japan, the Nikkei share average fell to a new two-week low overnight, with all sectors in negative territory as investors took profits following a two-month rally that pushed the index up by about +20%. The index ended down -1.6%, while the broader Topix closed -2% to seal its longest streak of losses since September 2016.
Down-under, Australia’s S&P/ASX 200 Index declined -0.6% and the KOSPI index in Seoul was down -0.3%.
In Hong Kong, stocks followed other Asian markets lower, dragged down by resources and industrial firms, amid worries over China’s economic growth after sluggish economic data. The Hang Seng index fell -1.0%, while the China Enterprises Index lost -1.6%.
In China, stocks extended their losses, hurt by resources shares amid signs of a slowdown in industrial production. The blue-chip CSI 300 index fell -0.6%, while the Shanghai Composite Index dropped -0.8%.
In Europe, regional indices trade lower across the board following on from weakness in Asia. Softer commodity prices are weighing on miners after weaker Japanese GDP (+0.3% vs. +0.4%) and downbeat Chinese economic data.
In the U.S, stocks are set to open in the ‘red’ (-0.5%).
Indices: STOXX 600 -0.8% at 380.8, FTSE -0.5% at 7375, DAX -1.0% at 12898, CAC 40 -0.5% at 5287, IBEX 35 -0.8% at 9911, FTSE MIB -1.0% at 22084, SMI -0.7% at 9065, S&P 500 Futures -0.5%
2. Oil prices slide after IEA casts doubt over demand outlook, gold higher
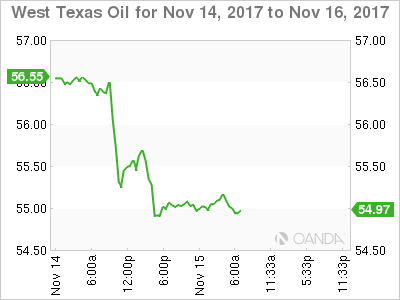
Oil prices fell by -1% overnight, continuing yesterday’s slide after the IEA cast doubts over the past few months’ narrative of tightening fuel markets.
Brent crude futures are at +$61.61 per barrel, down -60c, or -1% from yesterday’s close. U.S West Texas Intermediate (WTI) crude is at +$55.14 per barrel, down -56c, or -1%.
Note: Crude prices are now down by around -5% since hitting 2015 highs last week, ending a +40% rally between June and early November.
Yesterday, the IEA cut its oil demand growth forecast by -100k bpd for this year and next, to an estimated +1.5m bpd in 2017 and +1.3m bpd in 2018.
U.S. crude inventories are also weighing on prices. API data yesterday showed that U.S. crude inventories rose by +6.5m barrels in the week to Nov. 10 to +461.8m.
Note: U.S. government inventory data (EIA) is due later this morning (10:30 am EDT).
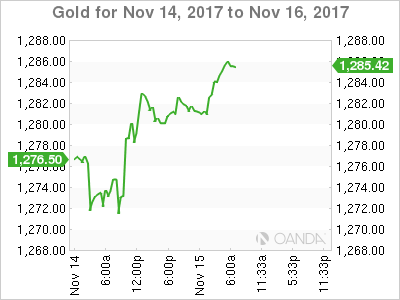
Ahead of the U.S. open, gold prices have edged higher as the dollar slipped ahead of the release of inflation data and retail sales that could provide hints on the Fed’s monetary tightening policy. Spot gold is up +0.3% at +$1,284.30 per ounce.
Note: On Tuesday, gold touched +$1,270.56, its lowest since Nov. 6, before rallying to close +0.2% higher.
3. Sovereign yields fall
Global yield curves have returned to a ‘flattening’ trend and have pushed the U.S. benchmark spread (2/30) back below +70 bps.
From here, sovereign yields are expected to range trade for the remainder of this year now that the Fed’s rate increase for December is almost fully priced, and while the ECB has set its course for most of 2018.
Overnight, the yield on U.S. 10-year Treasuries has decreased -4 bps to +2.33%, the lowest in more than a week. In Germany, the 10-year Bund yield has decreased -3 bps to +0.37%, their lowest yields in a week. In the U.K., the 10-year Gilt yield has declined -4 bps to +1.285%, the largest decrease in almost a fortnight.
4. Dollar in trouble
The USD remains on the back foot on investor concerns over the U.S. tax reform proposal losing momentum.
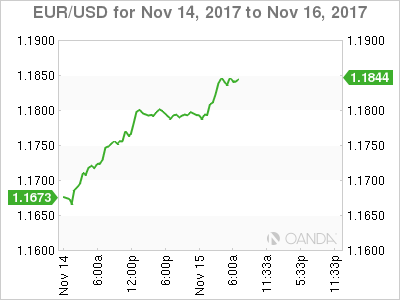
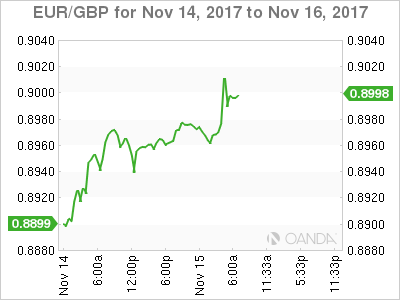
The EUR/USD (€1.1840) has managed to print a three-week high above the psychological €1.1850 print and is poised to record its sixth consecutive session gain. Euro data this month suggests that the market is witnessing the best macro-economic recovery since the ‘single’ unit has come into existence. If eurozone data strength continues, investors should expect the short-end of the Euro yield curve to correct and further support a stronger EUR.
GBP/USD tested above £1.32 ahead of key wage data (see below). The wage data did beat market expectations, but the sterling’s firm tone has been short-lived as investors question the sustainability of the upward momentum.
USD/JPY (¥112.76) is a tad softer on mostly safe-haven flows as global equity markets fall again.
The Turkish lira (€4.6036) continues to struggle after hitting a record low against the euro yesterday. The lira has come under sustained pressure in recent weeks following its diplomatic spat with the U.S and a deteriorating economic position.
5. UK employment, real wages fall in Q3
Data this morning showed that the number of U.K. citizens in work fell on a quarterly basis after nearly two years of growth, dropping by -14k. At the same time, the number of economically inactive Britons – those neither working nor seeking employment – rose by +117k, the biggest increase in seven-years.
Data from the Office for National Statistics (ONS) also showed that the squeeze on living standards in the U.K. continues, with real wages dropping for the seventh consecutive month. The data pointed to a -0.5% drop in real earnings on a yearly basis, excluding bonuses.
