Global Equities marched north on Monday, with the S&P 500 and Nasdaq hitting fresh record highs. It seems that the main catalyst behind the latest boost may have been signs of progress with regards to the development of a coronavirus vaccine. As for today, the main indicator on the agenda may be Germany’s Ifo survey for August.
CORONAVIRUS TREATMENT HEADLINES LIFT SENTIMENT
The US dollar traded somewhat lower against the majority of the other G10 currencies on Monday and during the Asian morning Tuesday. It gained against CAD, JPY, and NZD, while it underperformed versus NOK, EUR, GBP, SEK, CHF, and AUD in that order.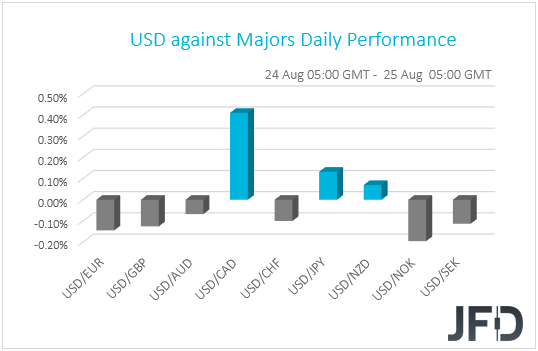
The weakening of the dollar and the yen suggests that the financial world traded in a risk-on fashion, but the relative strength of the franc and the slide in the Kiwi points otherwise. Thus, in order to get a clearer picture with regards to the broader market sentiment, we prefer to turn our gaze to the equity world. There, major EU and US indices were a sea of green, with the Nasdaq and the S&P 500 hitting new records. The optimism rolled somewhat over the Asian session today as well. Although China’s Shanghai Composite and Hong Kong’s Hang Seng are down 0.30% and 0.31%, Japan’s Nikkei and South Korea’s KOSPI are up 1.34% and 1.58% respectively.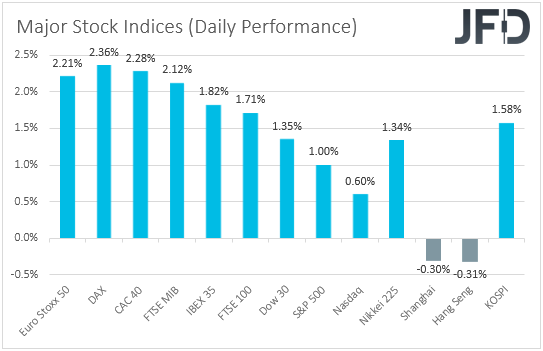
The main catalyst behind the boost in investors’ morale may have been signs of progress in developing a coronavirus vaccine. On Sunday, the US Food and Drug Administration authorized the use of plasma from recovered patients as a treatment option, while the Financial Times reported that the Trump administration is considering fast-tracking the vaccine being developed by AstraZeneca (NYSE:AZN) as the company marked further progress. Overnight reports that top US and Chinese officials see progress being made in resolving concerns over the Phase-One trade accord may have also helped the broader appetite.
It seems that investors are still ignoring that the virus continues to spread fast around the globe. Lately, Europe has seen an acceleration in infected cases, and still, EU shares rose on average 2.08% yesterday. Perhaps the market believes that we have more cases due to more tests being conducted, and/or it may be looking at the better situation in terms of hospitalization and death toll. What may have also taken back seat is the fact that, in the US, Republicans and Democrats remain deadlocked over a new coronavirus-aid bill.
Looking ahead, the next event that could attract investor attention is the Kansas City Fed Jackson Hole economic symposium, which will be held virtually this time due to the pandemic. The conference is scheduled for Thursday and Friday. Following the blurry picture the Fed minutes painted last week in terms of the Committee’s future plans, investors could lock their gaze on Fed Chair Powell’s keynote speech on Thursday, looking for clues as to whether more stimulus will be introduced soon, and if so, what form it may take. Market chatter also suggests that Powell may address the future approach to the inflation target, allowing consumer prices to overshoot it in order to make up for the years of undershooting.
NASDAQ 100 – TECHNICAL OUTLOOK
The Nasdaq 100 cash index hit a new record on Monday, at 11725, and then it pulled back. That said, the retreat remained limited near the 11530 zone, and then, the index rebounded again. Overall, the index continues to trade in an uptrend mode above the upside support line drawn from the low of April 21st, and thus, we would consider the outlook to still be positive.
If the bulls are willing to stay in the driver’s seat and surpass yesterday’s record of 11725, we may see them aiming for the psychological zone of 12000. If they refuse to stop there as well, then, a break higher may set the stage for advances towards the 12280 area, which marks the 261.8% Fibonacci extension level of the July 21st – 24th downside correction.
Now, in order to start examining the case of a decent correction to the downside, we would like to see a clear dip below 11530. This would confirm a forthcoming lower low on the 4-hour chart and may initially pave the way towards the low of August 21st, at 11405. Another break, below 11405, could see scope for extensions towards the 11225 barrier, marked by the low of the day before, where another break could allow declines towards the 11100 zone, or the aforementioned upside line taken from the low of April 21st.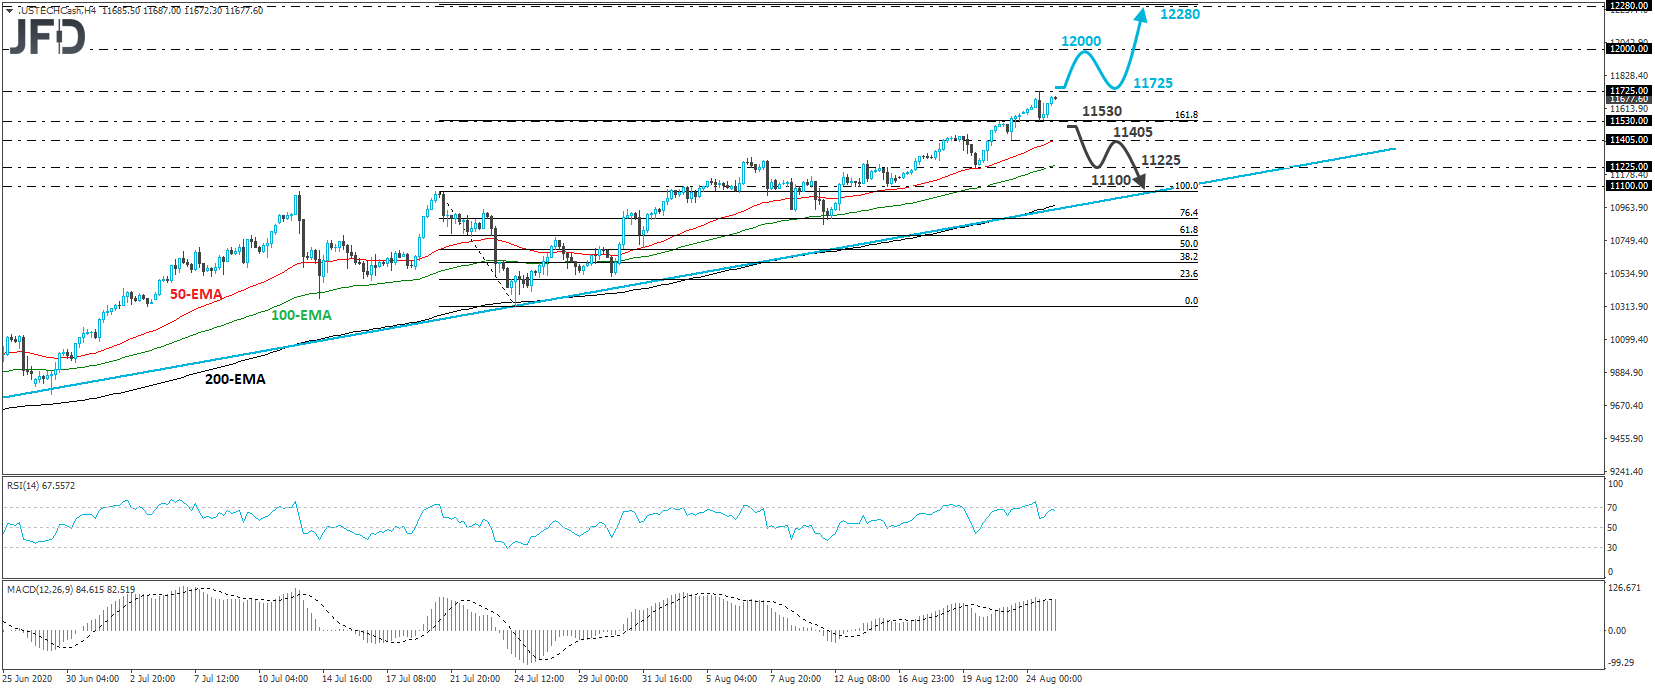
AS FOR TODAY’S EVENTS
During the early European morning, we already got Norway’s GDP for Q2. The headline qoq rate slid to -5.1% from -1.7%, while the mainland one fell to -6.3% from -2.2%, missing slightly estimates of -6.1%. Bearing in mind that in Norges Bank’s June quarterly report, the forecast for the Q2 mainland GDP was -6.1%, we don’t expect a 6.3% qoq contraction to alter the plans of Norges Bank officials for staying sidelined for a while more. After all, that may have been the reason for NOK’s modest reaction at the time of the release.
From Germany, we have the Ifo survey for August. Both the current assessment and expectations indices are expected to have risen to 87.0 and 98.0 from 84.5 and 97.0 respectively, something that will drive the business climate index up to 92.0 from 90.5. Having said that though, bearing in mind that the current conditions index of the ZEW survey slid further into the negative territory, instead of rebounding as the forecast suggested, we would consider the risks surrounding the Ifo current assessment index as tilted to the downside. With the number of infected cases in Europe accelerating lately, while at the same time, cases in the US have started to slow somewhat, a deteriorating view with regards to Germany’s current economic condition will not come as a surprise to us, although this could hurt the euro somewhat. The nation’s final GDP for Q2 is also coming out, which is expected to confirm the preliminary estimate that Eurozone’s economic powerhouse has contracted 10.1% qoq.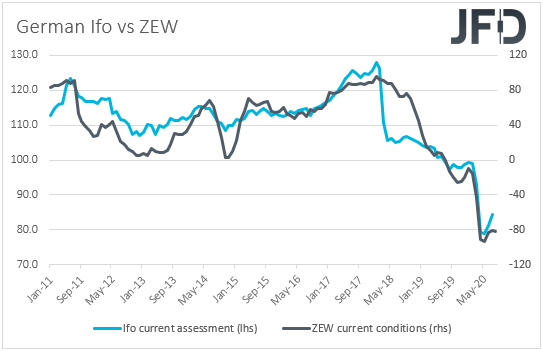
Later in the day, from the US, we have the Conference Board consumer confidence index for August and the new home sales for July. The CB index is expected to have risen fractionally, to 93.0 from 92.6, while new home sales are anticipated to have slowed to +1.3% mom from +13.8%. The API (American Petroleum Institute) weekly report on crude oil inventories is also coming out, but as it is always the case, no forecast is currently available.
We also have two speakers on today’s agenda: San Francisco Fed President Mary Daly and BoC Governing Council member Lawrence Schembri.
EUR/AUD – TECHNICAL OUTLOOK
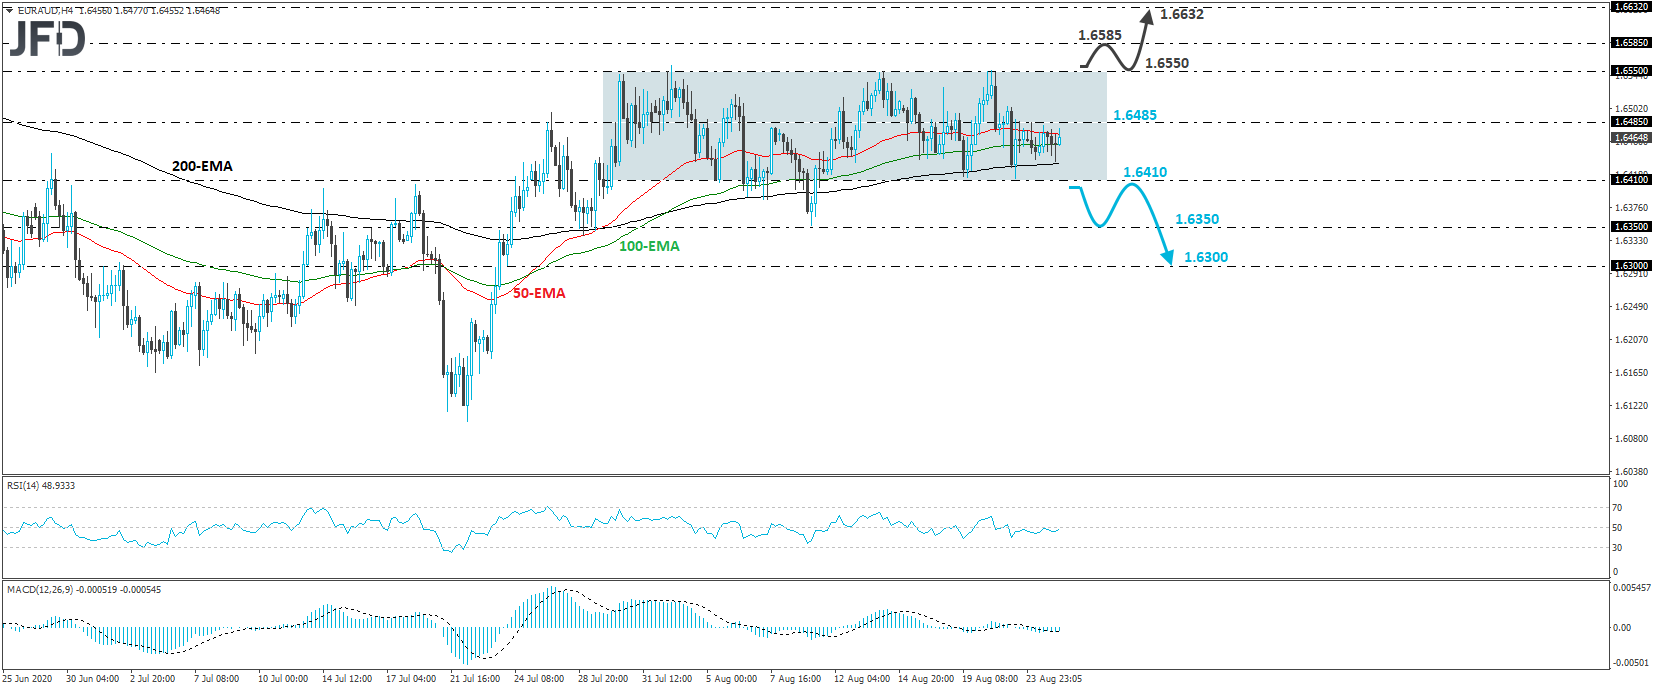
EUR/AUD traded in a consolidative manner yesterday, staying between the support of 1.6410 and the resistance of 1.6485. Overall, the rate continues to trade within the sideways range between 1.6410 and 1.6550, that’s been containing most of the price action since July 30th, and thus, we would consider the near-term outlook to be flat for now.
In order to start examining whether the bears have gained the upper hand, we would like to see a decisive break below the lower end of the range, at 1.6410. Such a move could open the path towards the low of
August 11th, at around 1.6350, the break of which may extend the slide towards the low of July 24th, near 1.6300.
On the upside, a break above 1.6550 may be needed for the bulls to feel comfortable again. This will confirm a forthcoming higher high and may initially target the 1.6585 territory, which is marked as a resistance by the inside swing low of May 28th. If that level is not able to stop the advance either, then the next stop may be the low of the day after, at around 1.6632.