Risk sentiment is on the up and there have been a number of technical developments that suggests being long risk is the right trade for now.
The price action in the S&P 500 yesterday was about as bullish as one will see and it doesn’t take a technician to understand that a chart starting at the bottom left and closing at the top right is bullish. Add in excellent participation (91% of stocks gained on the day), reasonable volume and, most importantly, strong moves in credit markets, and we have a rally of high quality. We even saw the US yield curve steeped for the first time in a while, with strong selling in the long end of the curve.
The S&P 500 has broken above neck line of the January and February double bottom and is at the best levels since 7 January.
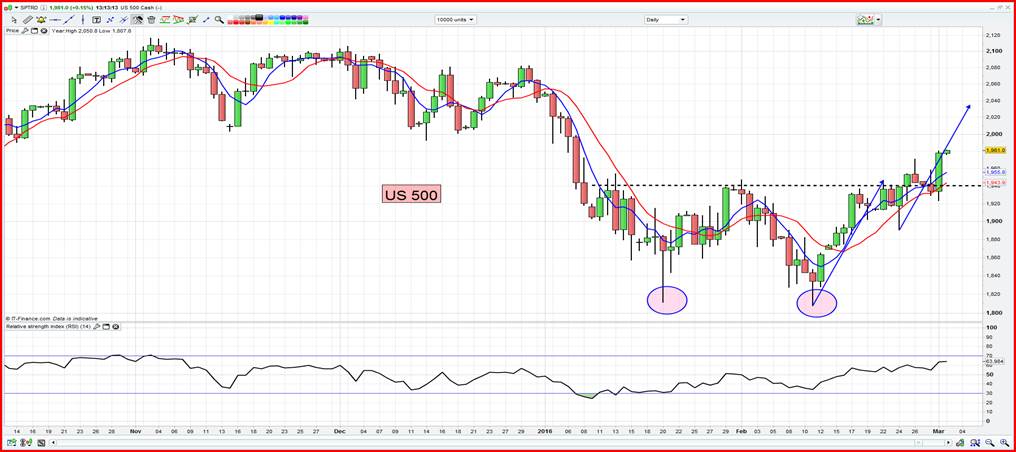
The trend here is up (we can see that from both moving averages), so 2000 would be the first stop and a break of 2020 would suggest the US benchmark makes a tilt at a new all-time high. Given all the craziness seen during the 13.5% decline in the MSCI World Index throughout December and February, the fact that I could believe new highs may be on the cards feels strange. However, if we focus on the leading indicators for equities, it suggests a positive feeling for now.
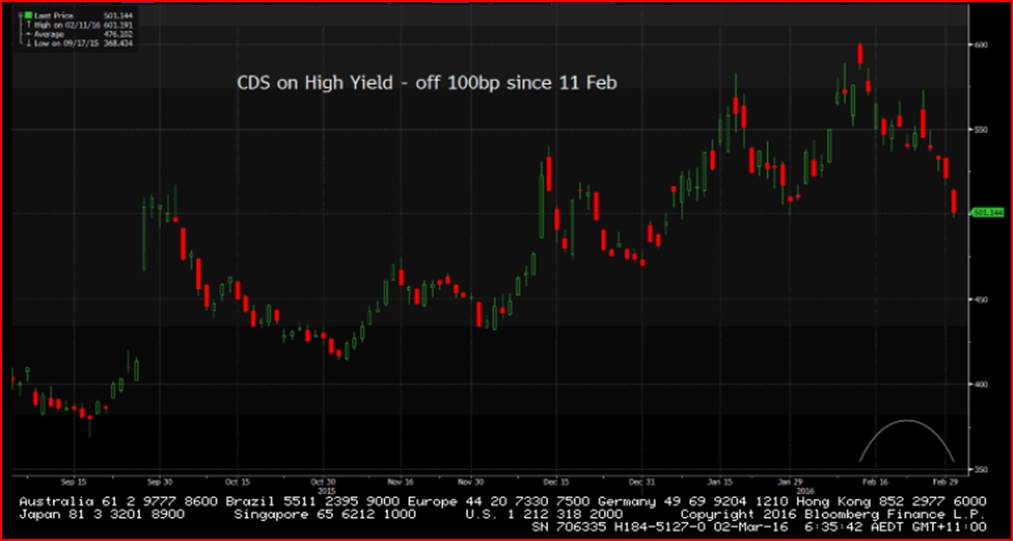
Credit-default swaps on high yield debt have been in strong decline since 11 February.
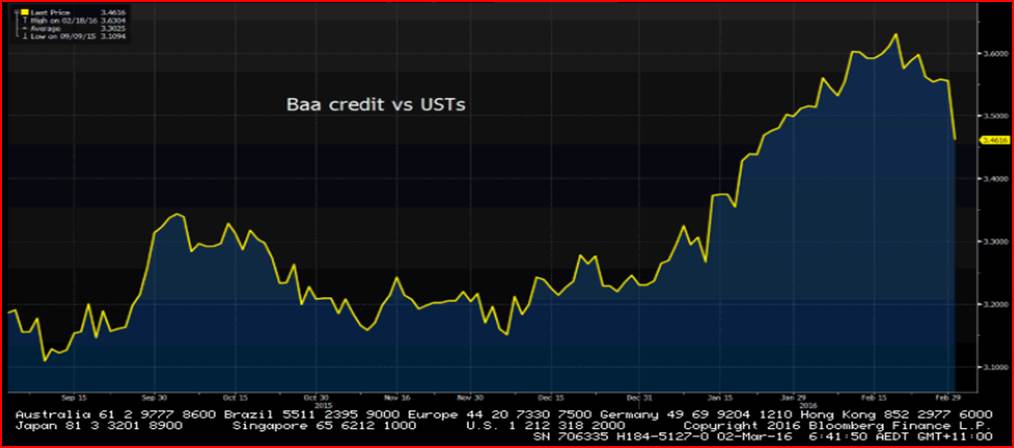
Investment grade credit spreads are collapsing.
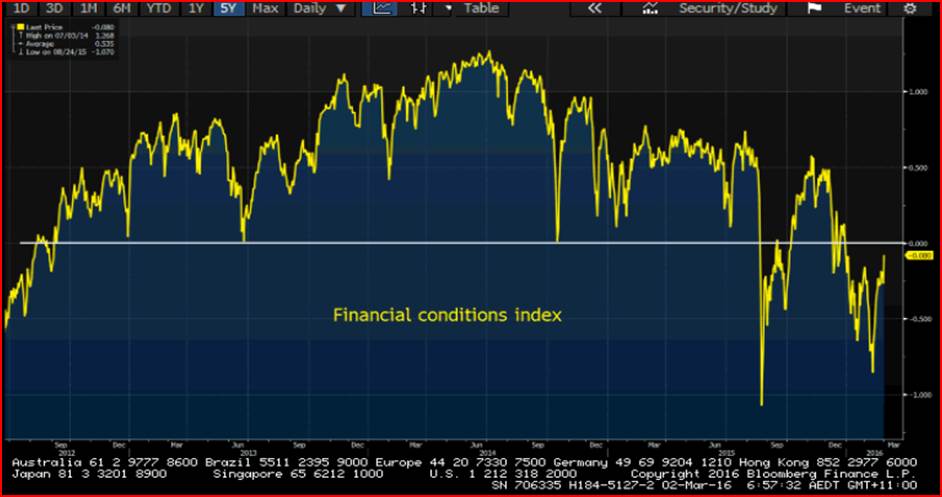
The Bloomberg US financial conditions index is about to turn accommodative for the first time in 2016. Bloomberg incorporates the S&P 500, VIX, various credit spreads, the USD and money market spreads into this index. This will fill the Fed with confidence and is absolutely USD positive, especially given speculative positioning is at its lightest since July 2014!
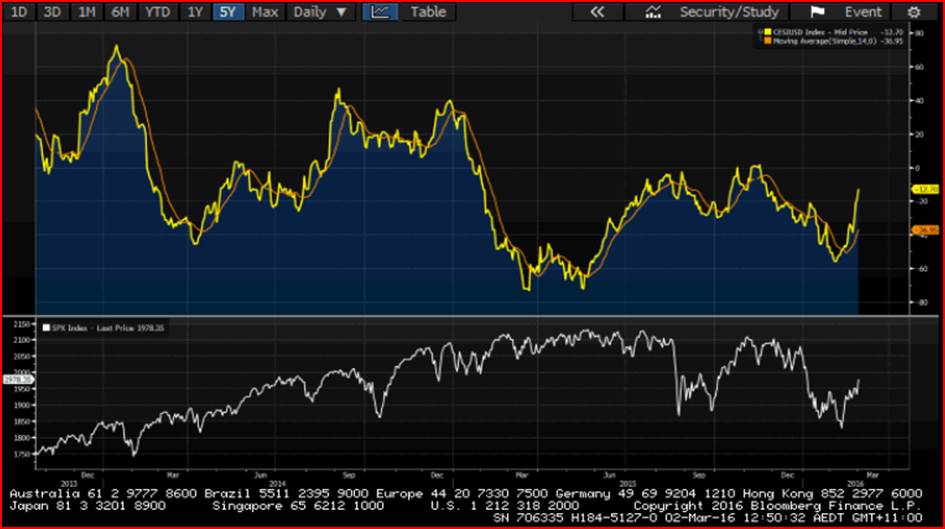
US data has been improving and I’ve highlighted this using the Citigroup Economic Surprise index (top pane – yellow). This tracks US data releases relative to the consensus. One can see that the data has been on an improving trend which seems nicely correlated with the S&P 500 of late (lower pane – white line). This is positive as it confirms that good news is good news and bad news is bad news! The idea that bad data results in a more accommodative stance is not true, unlike periods in 2014 and 2015.
It also suggests that good numbers in this week’s US services ISM, durable goods and payrolls report could see global equity markets higher.
We saw strong buying in European markets yesterday, but clients have been very active today too and we are eyeing another strong open. US futures haven’t really shown any life and importantly there hasn’t been much concern about ‘Super Tuesday’, although traders haven’t heard anything that wasn’t expected to be fair. Markets have known they were staring at a Trump/Clinton face-off for a while and the net effect is that traders are positioned for a Clinton win in November.
Asian trade has naturally followed suit with the Nikkei flying and ASX 200 breaking 5000 level. The Australian index is back at a level where strong supply was seen in January and February, but price action today isn’t thematic of a market too worried about an imminent sell-off, despite the People’s Bank of China weakening the CNY by 105 pips. The bulls will want to see a break of 5050 for the December highs of 5331 to come back into play. Clearly the S&P 500 will dictate, so watch price action on moves into 2020.
The news of the day for local traders was the upside surprise seen in Australia Q4 GDP at 0.6%. Granted GDP is a backwards looking indicator, but if the Reserve Bank of Australia (RBA) were loath to ease prior to this release, then this will give them more ammunition. If we look at the swaps market, we have seen a modest re-pricing of expectations for future easing 38bp of cuts over the coming 12 months. I suggested short EUR/AUD trades today and see lower implied volatility, rising equity markets and the prospect that the RBA won’t cut this year. The European Central Bank will ease and there is a risk they won’t deliver which is another consideration. Traders are using the EUR as a funding currency for carry structures and one just has to look at the daily chart to see the firm trend lower. A look at the weekly chart shows a break of the A$1.4500 to A$1.4600 (multi-month double top neckline) area would set the pair up for a monster decline over the medium-term. Trips to Italy, Greece and Spain could be about to become a whole lot cheaper.
Ahead of the open we are calling the FTSE at 6194 +42, DAX 9792 +75 and CAC 4442 +36
