Trend Model signal summary
Trend Model signal: Risk-on
Trading model: Bullish
The Trend Model is an asset allocation model which applies trend following principles based on the inputs of global stock and commodity price. In essence, it seeks to answer the question, "Is the trend in the global economy expansion (bullish) or contraction (bearish)?"
My inner trader uses the trading model component of the Trend Model and seeks to answer the question, "Is the trend getting better (bullish) or worse (bearish)?" The history of actual (not backtested) signals of the trading model are shown by the arrows in the chart below. In addition, I have a trading account which uses the signals of the Trend Model. The last report card of that account can be found here.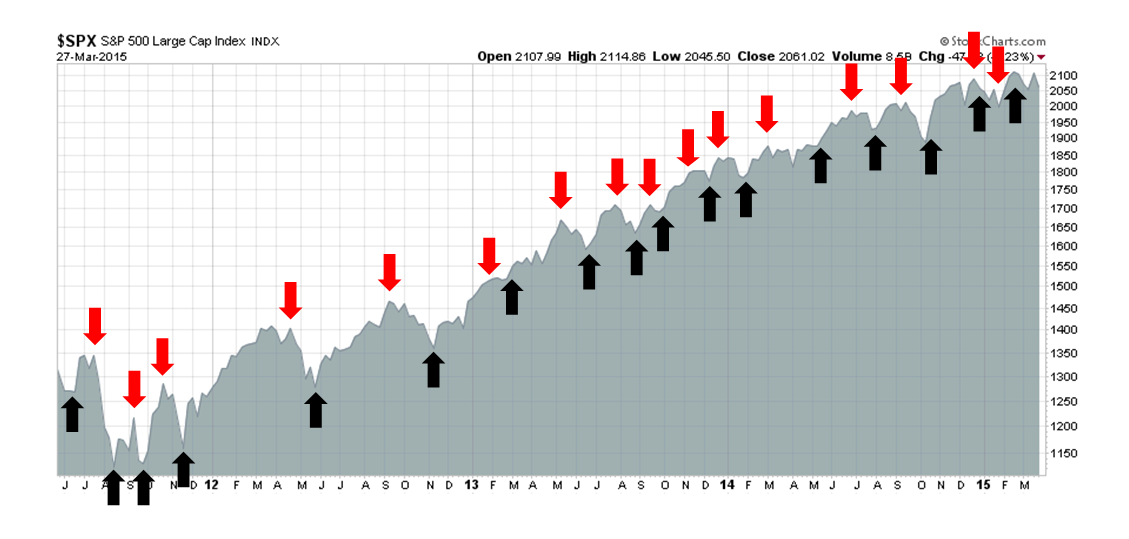
Update schedule: I generally update Trend Model readings on weekends and tweet any changes during the week at @humblestudent.
Volatility is back
I would love to say that I am right all the time, but the market gods will humble anyone who does that (hence the name of my blog "Humble Student of the Markets"). Last week, I was leaning bullish (see The bulls are alright), but that directional bet worked for all of one day before reversing downward.
Brett Steenbarger had an interesting observation about how badly chasing price momentum has worked in the last few years [emphasis added]:
Above we see a chart of the total number of SPX stocks making 5, 20, and 100-day new highs vs. new lows each day. Note the tendency of this multiperiod breadth measure to top ahead of price during intermediate-term market cycles. The measure has remained strong recently. Interestingly, going back to 2012, when the multiperiod measure has been positive (more stocks making new highs than lows), the next five days in SPX have averaged a gain of +.15%. When the measure has been negative, the next five days in SPX have averaged a gain of +.71%. Yet another example of how momentum trading (buying strength and selling weakness) has not worked for stock index traders in recent years.
In a different post, Steenbarger distinguished between trend following and momentum investing, which argues for a strategy of staying with the intermediate term trend but fading strength or weakness in the current environment:
Overall, chasing new highs and stopping out of long positions on expansions of new lows has brought subnormal returns. We have had a trending environment since 2012, but not a momentum environment. Understanding that distinction has been crucial to stock market returns.
My base case scenario is a choppy market, but with an upward bias as the intermediate term trend remains bullish. There was much consternation among technicians when the SPX broke down through an uptrend that began last October. However, an examination of the other major US equity averages, namely the NASDAQ Composite, DJIA and Russell 2000, show the uptrend remains intact.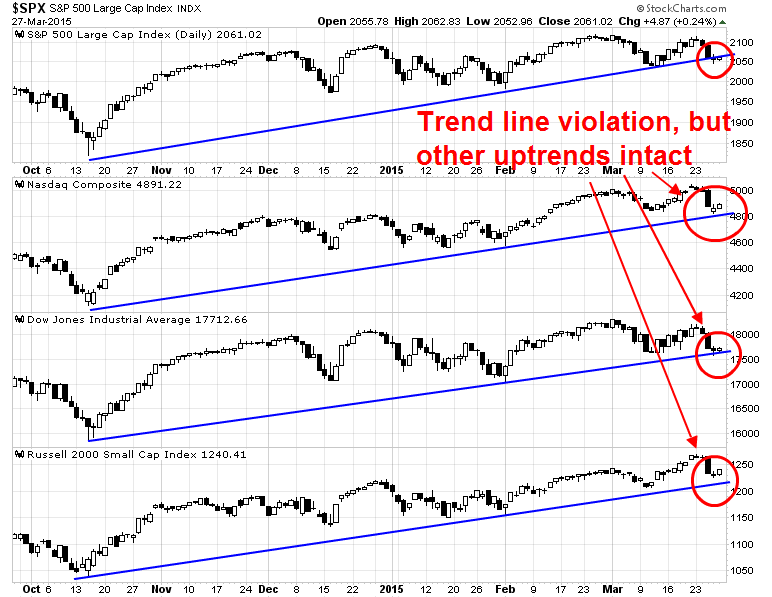
There are plenty of additional signs of a bullish intermediate-term trend.
Signs of global growth
Regular readers also know that the Trend Model uses inter-market analysis to spot global trends. Simply put, I am not seeing any signs of major weakness overseas. Across the Atlantic, the charts of European averages—the STOXX 600, Euro STOXX 50 and FTSE 100—look constructive.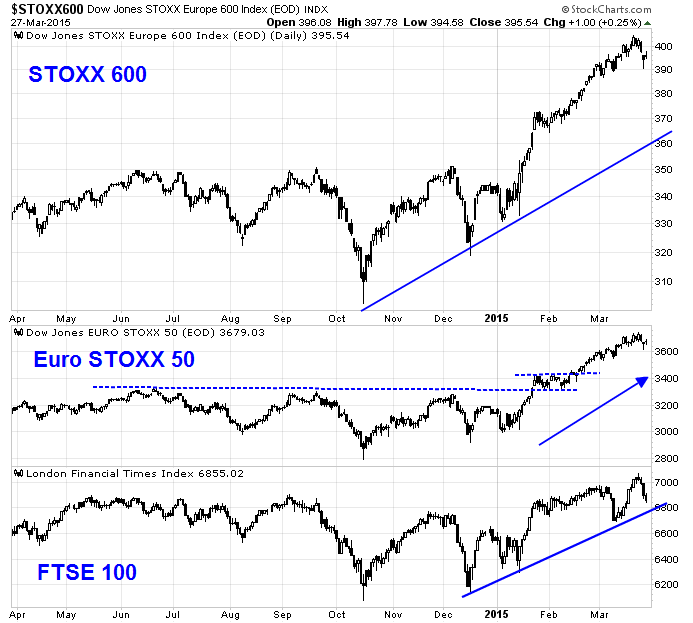
As well, the Greater China equity markets—Shanghai Composite, Hang Seng, Taiwan Weighted, KOSPI and Australia's ALL ORDINARIES—are in uptrends.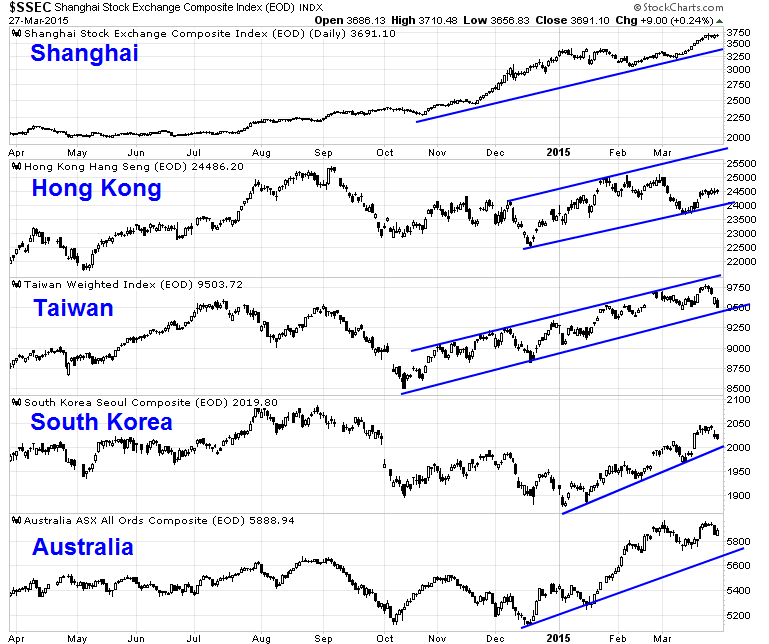
Commodity markets (via DJ Industrial Metals Index and CRB Index)) are trying to rally instead of showing signs of weakness. These are all indications of a growing global economy.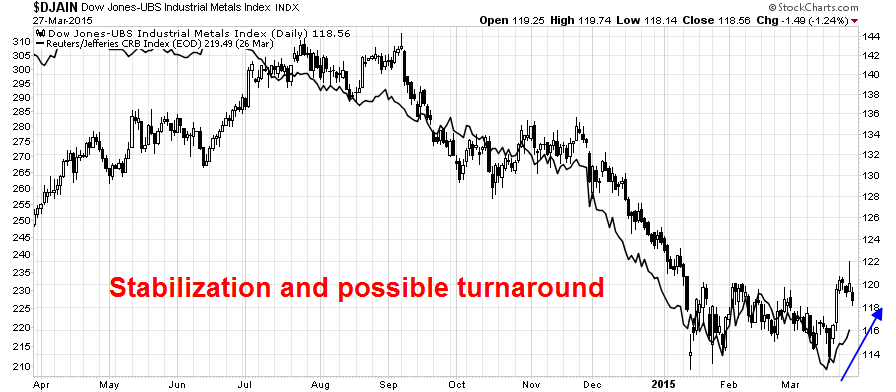
In the US, the latest update from John Butters of Factset shows that forward EPS is rising again, which is supportive of higher prices. It seems that the headwinds from falling oil prices and the rising USD are abating (annotations in red are mine).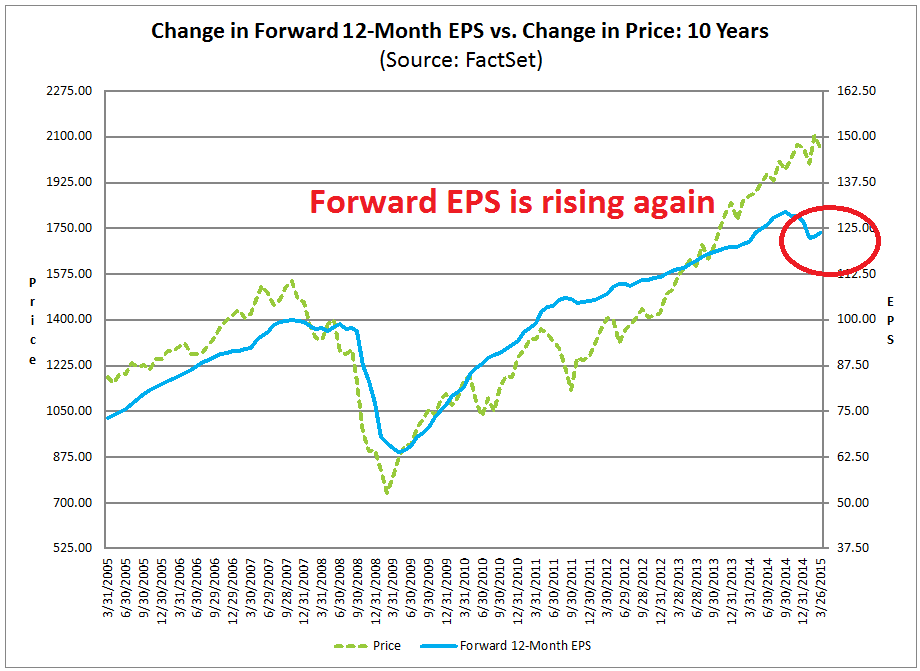
Risk appetite remains healthy
Despite the minor pullback we saw in equities last week, I am not seeing any signs of rising risk aversion. Consider, for example, this chart of the relative performance of HY bonds (via iShares H/Y Corporate Bond ETF (ARCA:HYG)) to Treasuries (via iShares Barclays 3-7 Year Treasury Bond ETF (ARCA:IEI)) compared to the stock market. Even as stock prices fell, HY bonds actually outperformed, indicating rising risk appetite.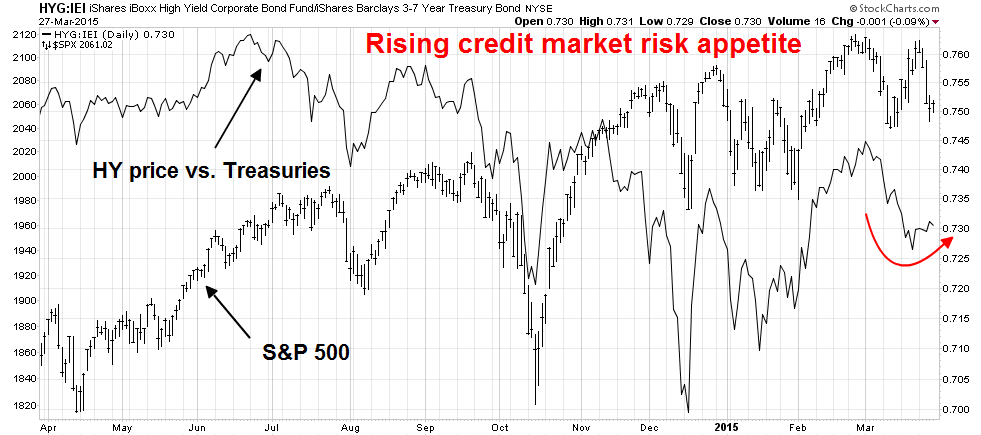
A similar picture can be found in the relative performance of the high-beta, high octane and glamour groups of the stock market, such as biotech (via iShares NASDAQ Biotech ETF (NASDAQ:IBB)), internet (via PowerShares NASDAQ Internet ETF (NASDAQ:PNQI)), broker-dealers (via iShares DJSU Broker-Dealers Index (NYSE:IAI)), IPOs (via Renaissance IPO ETF (NYSE:IPO) and social media stocks (via Global X Social Media Index (NASDAQ:SOCL)). Does this look like a picture of an impending correction?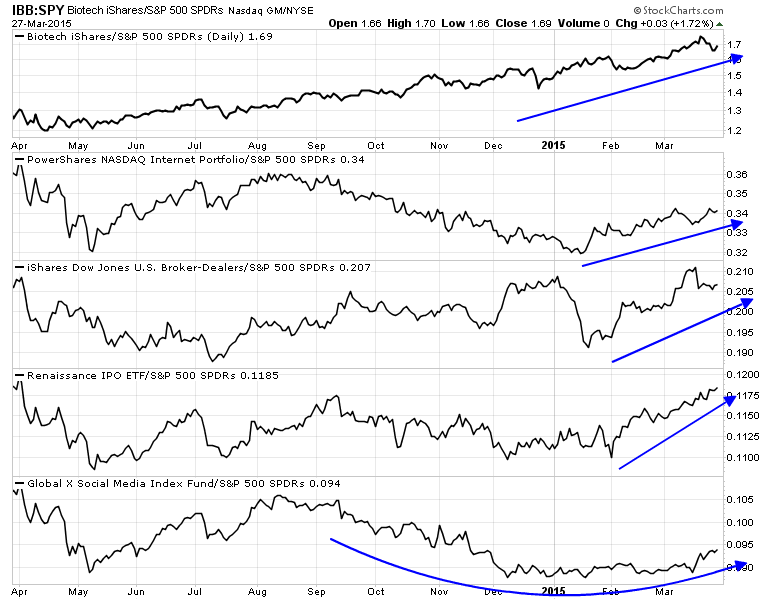
In addition, small caps (via iShares Russell 2000 Index (ARCA:IWM) and WisdomTree Europe SmallCap Dividend ETF (NYSE:DFE)) are outperforming large cap stocks (via SPDR S&P 500 (ARCA:SPY) and Vanguard MSCI EU ETF (ARCA:VGK)). The pattern is evident not only in the US, but in Europe as well.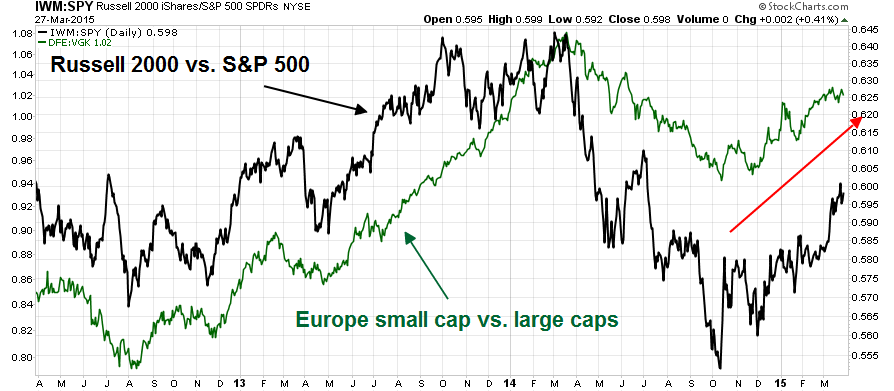
When I put it all together, I can only conclude that the recent weakness is a hiccup. The intermediate-term trend remains up.
More weakness: Not oversold enough?
Looking to the week ahead, however, I do have some concerns that the recent bout of weakness may not be over. While the stock market averages have softened, they have not pulled back enough to register extreme oversold readings that indicate a durable, short-term bottom. As the chart below shows, the 5-day RSI, 14-day RSI are nearing oversold readings, but there is room for them to fall a bit further. As well, the SPX has fallen to the lower Bollinger® Band before reversing itself during recent episodes of market weakness.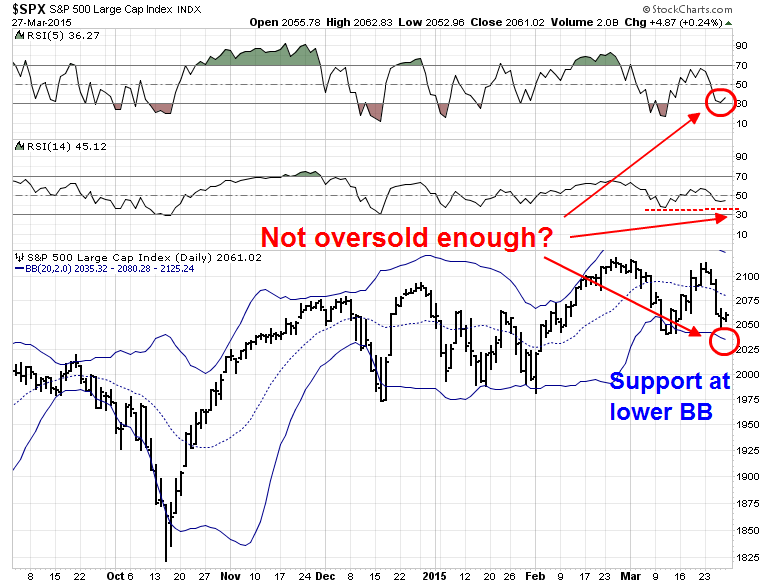
From a short-term technical viewpoint, I would have to allow for the possibility that stock prices weaken further in the coming week. Downside risk for the SPX stands at about 2035, which is slightly more than 1% below the closing levels on Friday.
Event risk: Heads I win, tails I tie (?)
No market review would be complete without the consideration of event risk, the outcome of which is binary and difficult to predict. There are three on the radar screen right now:
- Saudi-Yemen
- Greece
- Iran
The market was spooked last week by the news of Saudi airstrikes against the al-Houthi rebels in Yemen. Oil prices spiked in a knee-jerk fashion and stock prices deflated. Yet, this Stratfor analysis shows that the conflict is a regional one and al-Houthi does not appear to be a major threat in the region (via Business Insider):
The al-Houthis do not pose a major threat to Saudi Arabia; on the contrary, the rebels' control over north and central Yemen insulates Saudi Arabia from the chaos in other parts of the country and especially from al Qaeda in the Arabian Peninsula, which is a more immediate threat.
The Saudis would rather have the al-Houthis on their southern border instead of a jihadist quasi-state that is hostile to them. While the Saudis would prefer not to have al-Houthi control of such a large piece of Yemen so close to their border, the situation seems to be the best outcome in a situation where all options are bad — as long as the al-Houthis do not start pushing northward.
The conflict is ultimately regional and sectarian. The al-Houthi rebels are a counterweight to the jihadists in Yemen, AQAP:
In fact, the United States has already indicated that it will work with the al-Houthis to fight jihadists in Yemen, another sign of the shift in the United States' position in the Middle East. Washington sees Iran, Hezbollah and even the Syrian government — except for President Bashar al Assad — as partners in the fight against the Islamic State, a development Saudi Arabia feels threatened by.
The conflict in Yemen should therefore be seen as a minor geopolitical event and thus pose little threat to stability in the region. So relax and pencil one in for the bulls.
As well, Greece is going to to be in the headlines next week. Bloomberg provided a timetable of key events (link here) for Greece, and Athens is scheduled to present a list of key reforms on Monday, March 30, in order to get more bailout funds.
While events could easily spiral downward for Greece, they could also go right too. Whatever the outcome, I believe that the market reaction is likely to be skewed to the upside. During the market sell-off last Thursday, Doug Kass tweeted the news that Italy had managed to sell 2017 zero-coupon paper for an incredible 0.162% yield. I interpret this as an indication that Greece has largely been firewalled.
Any possible downside from a negative reaction to the Greek proposals is likely to be limited. On the other hand, the proposals could be accepted and we would likely see a risk-on rally.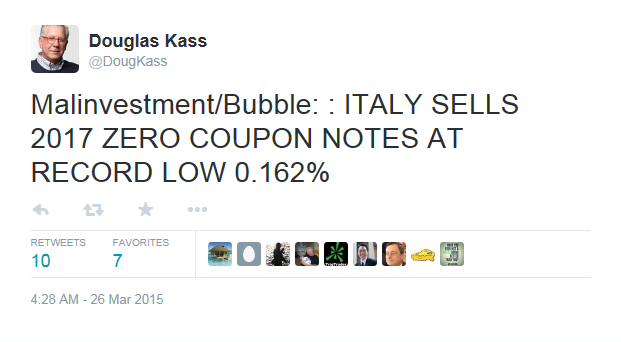
Marc Chandler indicated that the likelihood of a positive outcome is high:
The bar to freeing up aid money is not very high. All the Greek government has to do is submit a list of a few reforms it will implement. After a couple of false starts, the Tspiras government appears to have down this before the weekend and is being reviewed. Fitch grew impatient and cut the country's rating from B to CCC just before the reforms were submitted.
The list of reforms reportedly includes higher "sin taxes" on alcohol and tobacco. The tax on high incomes may be increased. There will be a greater effort to clamp down on tax evasion. Reducing the associated penalty is reportedly generating some positive results. News reports also indicate that Tspiras will also a primary budget surplus half of the 3% that the EU demanded.
Pencil another one in for the bulls.
Speaking of what could go right, the nuclear talks with Iran are rapidly approaching their self-imposed deadline of March 31. The headline that crossed the tape on Friday: "Oil dives 5 percent as worries about Iran talks trump Yemen" tells the story of market expectations:
Oil tumbled 5 percent on Friday, erasing the previous session's gains, as Yemen's conflict looked less likely to disrupt Middle East crude shipments and investors turned their focus to talks for a potential Iran nuclear deal that could put more supply on the market.
In other words, a deal with Iran trumps any concerns over Yemen. Such a blockbuster deal would spark a market positive reaction and a risk-on rally. If there is no deal, we go back to the status quo. (Note that my comments are focused on the likely market reaction. As for the issue of whether a deal with Iran is positive or negative from a geopolitical viewpoint, that question is beyond my pay grade.)
As I write these words, there are indications from news reports that the broad outlines of a tentative deal are in sight, though nothing is certain:
Iran and six world powers have reached tentative agreement on key parts of a deal sharply curtailing Tehran's nuclear programme, Western diplomats said Sunday while cautioning that the pact is by no means done.
One of these diplomats in talks in Switzerland said Iran had "more or less" agreed to slash the number of its centrifuge machines by more than two-thirds and to ship abroad most of its stockpile of nuclear material.
As negotiators in Lausanne raced to nail down by midnight Tuesday the outlines of a deal, due to be finalised by June 30, the diplomats cautioned however that with some tough issues still to resolve, things may change.
Iranian diplomats denied that any tentative agreement on these points has been struck, saying that reports of a specific number of centrifuges and exporting its stockpiles were "journalistic speculation".
(Lightly) pencil a third in for the bulls.
In short, there are a number of tail events with binary outcomes that could affect global markets in the near future. While I have no way of forecasting what will happen, the risk-reward ratio seems to be skewed to the upside.
A bullish skew
As I review market conditions, they can be summarized by an intermediate term bull trend, mildly (but possibly insufficient) oversold readings and event risk that is skewed to the upside.
Bottom line: My inner investor remains bullishly positioned. My inner trader was caught offside by last week's decline and he is staying long despite the pain he endured. The risk-reward remains tilted positively with a long position rather than a short position.
Disclosure: Long SPXL, TQQQ
Disclaimer: Cam Hui is a portfolio manager at Qwest Investment Fund Management Ltd. ("Qwest"). This article is prepared by Mr. Hui as an outside business activity. As such, Qwest does not review or approve materials presented herein. The opinions and any recommendations expressed in this blog are those of the author and do not reflect the opinions or recommendations of Qwest.
None of the information or opinions expressed in this blog constitutes a solicitation for the purchase or sale of any security or other instrument. Nothing in this article constitutes investment advice and any recommendations that may be contained herein have not been based upon a consideration of the investment objectives, financial situation or particular needs of any specific recipient. Any purchase or sale activity in any securities or other instrument should be based upon your own analysis and conclusions. Past performance is not indicative of future results. Either Qwest or Mr. Hui may hold or control long or short positions in the securities or instruments mentioned.
