Review and Update
Last week, I was unable to produce a newsletter so I will be updating my analysis from two weeks ago. Fortunately, nothing has changed much as the ongoing levitation of asset prices in hopes of “tax cuts/reform” still linger even as the risk of disappointment seems to have risen.
On Thursday and Friday, the market experienced a very minor “sell off” as concerns over the “tax cut” bill surfaced. But even those concerns were rapidly offset by the “buy the dip” crowd with the S&P 500 finishing the week lower by sliding -5.56 points or -0.21%.
OMG – “There’s blood in the streets.”
I jest, of course, but there are a couple of indicators which point to a further decline in the next week. The chart below is the NYSE Advance-Decline Line. The vertical dashed lines are points where the A/D line issued a “sell signal” which also corresponded with a corrective action in the S&P 500. Such a signal is on the verge of being issued currently.
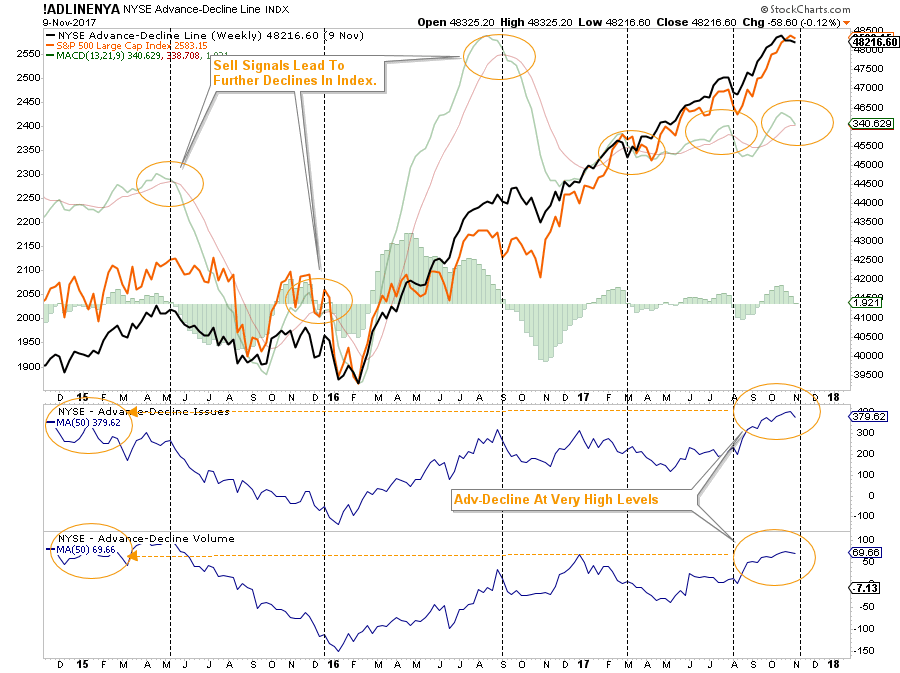
Secondly, the A/D Issues and A/D Volume (50-day moving age) are at extremely high levels which previously suggested bigger corrective actions previously.
I will give you my theoretical timing for that correction in a moment.
Junk bonds, oh, excuse me, I mean “high yield” bonds are also turning lower. There has been a high correlation between the S&P 500 and “high yield” bonds since the financial crisis. While the downturn itself isn’t a “major alert,” when combined with deteriorating internals, weakness in price momentum and extreme deviations from long-term means, we shouldn’t dismiss the warning.
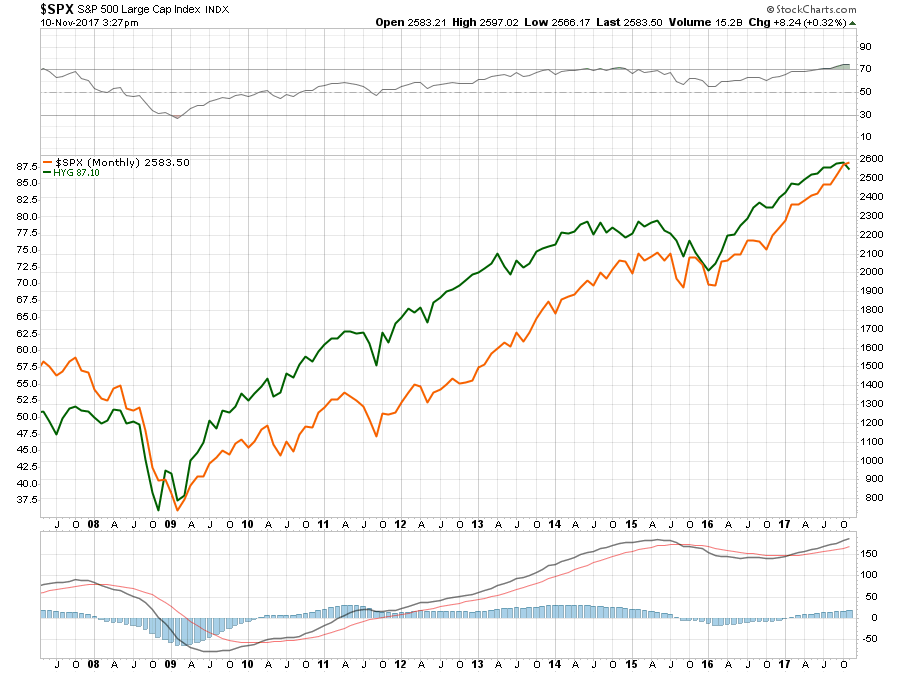
Importantly, as I addressed two weeks ago, the “seasonally strong period” of the market was confirmed by both of the weekly MACD’s registering “buy signals” in October. Again, the only concern is that those signals were triggered from extremely high levels which tend to be shorter in nature.
Nonetheless, the bullish trends do remain intact and the last two months of the year are typically bullish for asset prices. Understanding this, these conditions keep portfolios allocated towards equity risk currently.
Timing Of A Correction
I am not talking about the beginning of the next “bear market,” but I am suggesting we are likely to see a correction of 3-5% to work off the current extremes.
As shown in the chart below, I believe the current market momentum can carry the market through the end of the year to hit our year-end target of 2600. As noted, there will be a couple of bumps along the way particularly in the second week of December when mutual funds make their annual distributions. But with fund managers chasing markets to “close their performance gap,” the traditional year-end “Santa Claus” rally is likely.
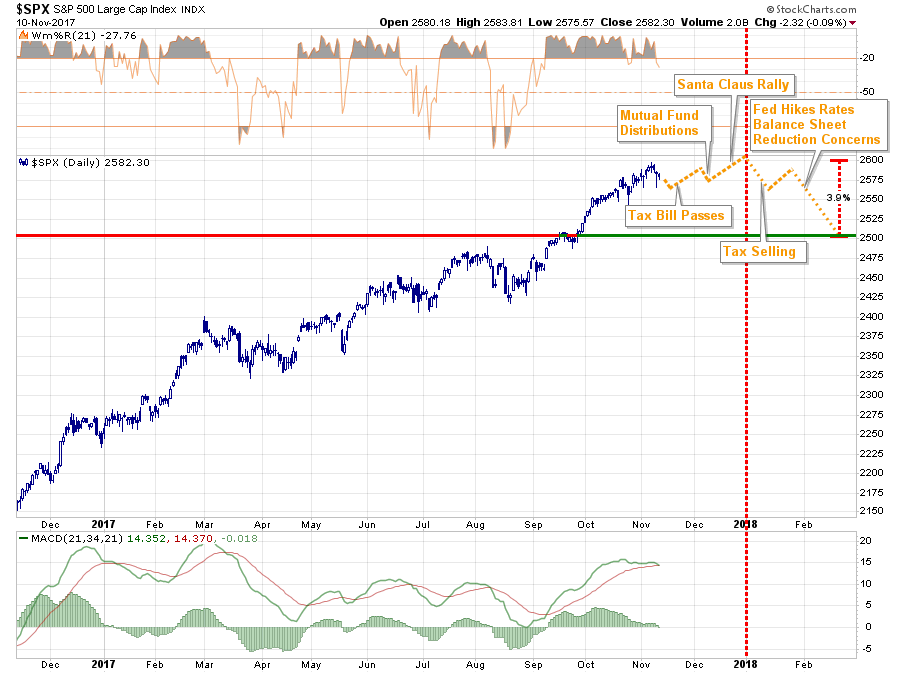
It is the turn of the calendar where I see the potential for a bigger correction. Come January, I think there is a high-likelihood of “tax selling” by fund-managers to lock in gains, particularly if “tax reform” legislation has passed, as taxes won’t be due for 21-months (assuming late filing.)
That selling, combined with concerns over the Fed’s rate hike in December and reduction of the balance sheet, could facilitate a deeper correction of 3-5%.
Don’t laugh.
Considering we have had the longest stretch in market history without a 3-5% correction, a correction of such magnitude will “feel” much worse than it actually is.
Tax Bill Overview and Thoughts
On Friday, I discussed the two current tax bills with Scarlett Fakhar of Real Investment News:
There is a rising, and significant, probability that “tax reform” will fail to pass in the Senate. This would delay the passage of tax reform bill until well into 2018, and possibly 2019 assuming the Republicans can hold majorities in both houses next November. Such is a slim possibility at best.
I encourage you to take a few minutes to review my previous analysis of the effectiveness of tax cuts on the economy.
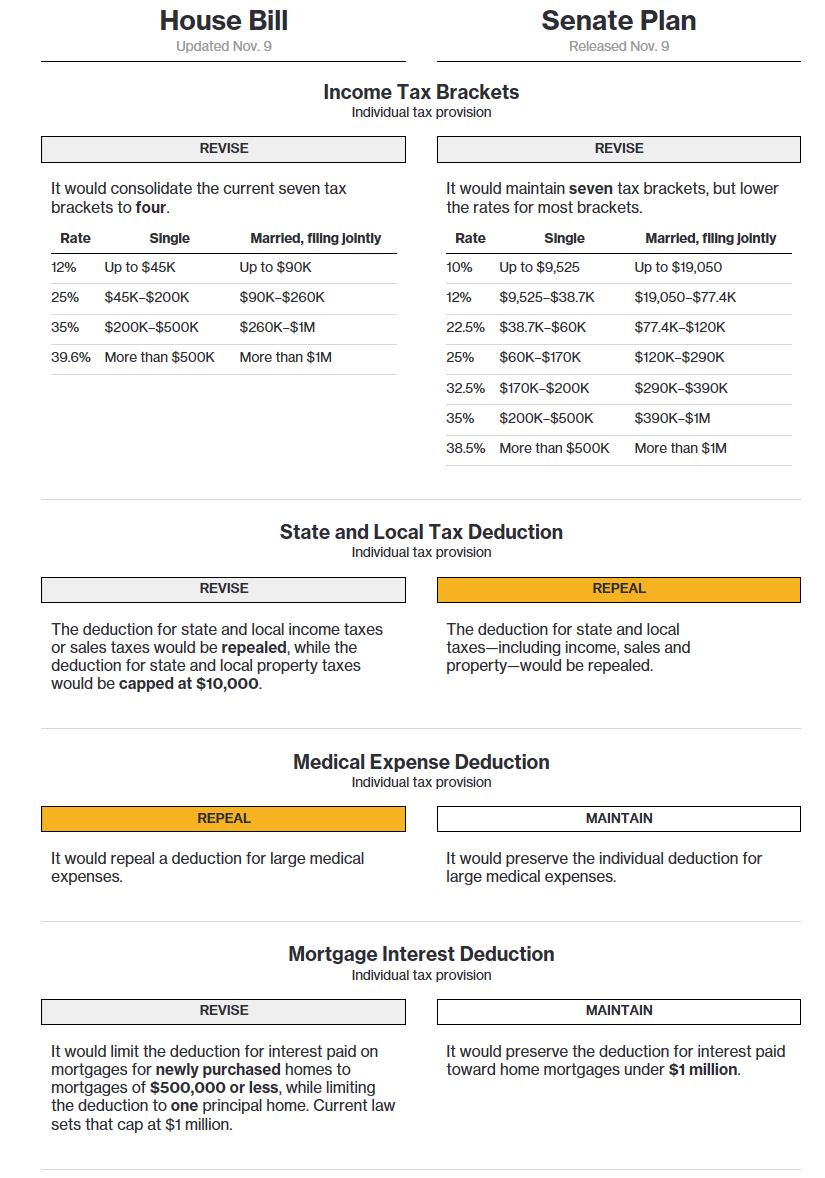
This past week, Bloomberg produced a very concise comparison of both bills currently presented.
(Click HERE For The Full Analysis)
The Committee For A Responsible Budget did a terrific piece of analysis which concurs with many of my assumptions as well. To wit:
“Fundamentally, the Senate bill suffers from the same fatal flaw as the House bill – it tries to cut taxes by $1.5 trillion over the next decade with no plan to pay for these cuts. As recent dynamic scores have shown, there is no way economic growth can pay for more than a fraction of this cost.
In fact, tax cuts that add to the debt do less to grow the economy than fiscally responsible reform and may even hurt economic growth over the long term.
It is frightening that so many members of Congress are willing to believe in fantasy economics based in no historical or mathematical reality.
If tax cuts paid for by debt are signed into law, Congress will have sent a massive, budget-busting tax bill to our children to pay, and it will result only in a short-term sugar high with little to no economic improvement over the long term.”
EXACTLY, the point I have repeatedly made.
- There is absolutely NO historical evidence that “tax cuts” alone lead to stronger economic growth, higher wages, or more jobs.
- There IS plenty of evidence, however, that shows tax cuts lead to bigger deficits and more debt.
The market WILL figure this out eventually, and the consequences will not be good.
Managing Past The Noise
There are obviously many more arguments for both camps depending on your personal bias. But there is the rub. YOUR personal bias may be leading you astray as “cognitive biases” impair investor returns over time.
“Confirmation bias, also called my side bias, is the tendency to search for, interpret, and remember information in a way that confirms one’s preconceptions or working hypotheses. It is a systematic error of inductive reasoning.”
Therefore, it is important to consider both sides of the current debate in order to make logical, rather than emotional, decisions about current portfolio allocations and risk management.
Currently, the “bulls” are still well in control of the markets which means keeping portfolios tilted towards equity exposure. However, as David Rosenberg once penned, the markets are set up for disappointment. To wit:
“So we have a sluggish U.S. economy on our hands with growth revisions to the downside. We have a situation where some investors see the softness enduring long enough that Fed funds futures are now pricing in less than 50-50 odds that Yellen et al make another rate move by year-end. Yet the Fed is signaling that it will begin to shrink the balance sheet by the fourth quarter, with no economic liftoff.
The political backdrop is rife with gridlock — unbelievably, there is still hope among investors that tax reform is coming by 2018. At the same time, evidence is mounting that the Dems have a serious shot of taking the House next year. We have a White House that, with the help of inside leaks and the media, continues to find itself embroiled in controversies. And health care reform, which was always pledged to be the first item to be done, is looking more and more like now a pipe dream. When hasn’t governing been complicated? It took the Gipper five years and endless bottles of scotch with Tip to get tax reform legislated in 1986!”
Currently, there is much “hope” things will “change” for the better. The problem facing President Trump, is an aging economic cycle, $20+ trillion in debt, an almost $700 billion deficit, unemployment below 5%, jobless claims at historical lows, and a tightening of monetary policy and 80% of households heavily leveraged with little free cash flow and surging health care costs. Combined, these issues alone will likely offset most of the positive effects of tax cuts and deregulations.
Furthermore, while “bearish” concerns are often dismissed when markets are rising, it does not mean they aren’t valid. Unfortunately, by the time the “herd” is alerted to a shift in overall sentiment, the stampede for the exits will already be well underway.
Importantly, when discussing the “bull/bear” case it is worth remembering that the financial markets only make “record new highs” roughly 5% of the time. In other words, most investors spend a bulk of their time making up lost ground.
The process of “getting back to even” is not an investment strategy that will work over the long term. This is why there are basic investment rules all great investors follow:
- Sell positions that simply are not working. If they are not working in a strongly rising market, they will hurt you more when the market falls. Investment Rule: Cut losers short.
- Trim winning positions back to original portfolio weightings. This allows you to harvest profits but remain invested in positions that are working. Investment Rule: Let winners run.
- Retain cash raised from sales for opportunities to purchase investments later at a better price. Investment Rule: Sell High, Buy Low
These rules are hard to follow because:
- The bulk of financial advice only tells you to “buy”
- The vast majority of analysts ratings are “buy”
- And Wall Street needs you to “buy” so they have someone to sell their products to.
With everyone telling you to “buy” it is easy to understand why individuals have a such a difficult and poor track record of managing their money.
Trying to predict the markets is quite pointless. The risk for investors is “willful blindness” that builds when complacency reaches extremes. It is worth remembering that the bullish mantra we hear today is much the same as it was in both 1999 and 2007.
Again, I don’t need to remind you what happened next.
See you next week.
Market and Sector Analysis
Data Analysis Of The Market & Sectors For Traders
S&P 500 Tear Sheet
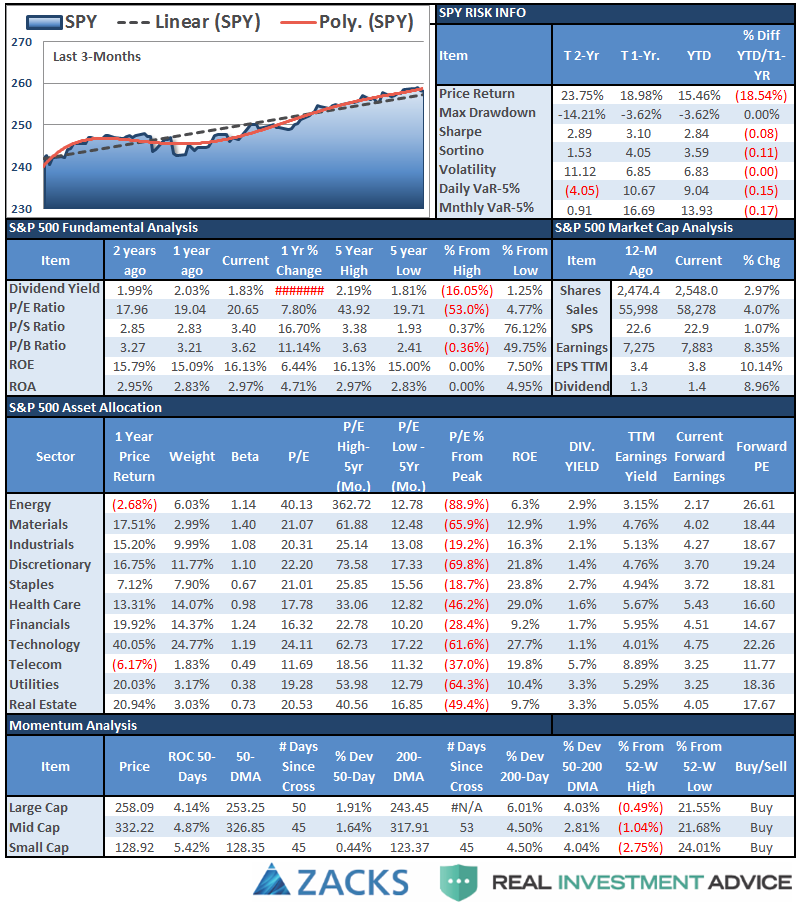
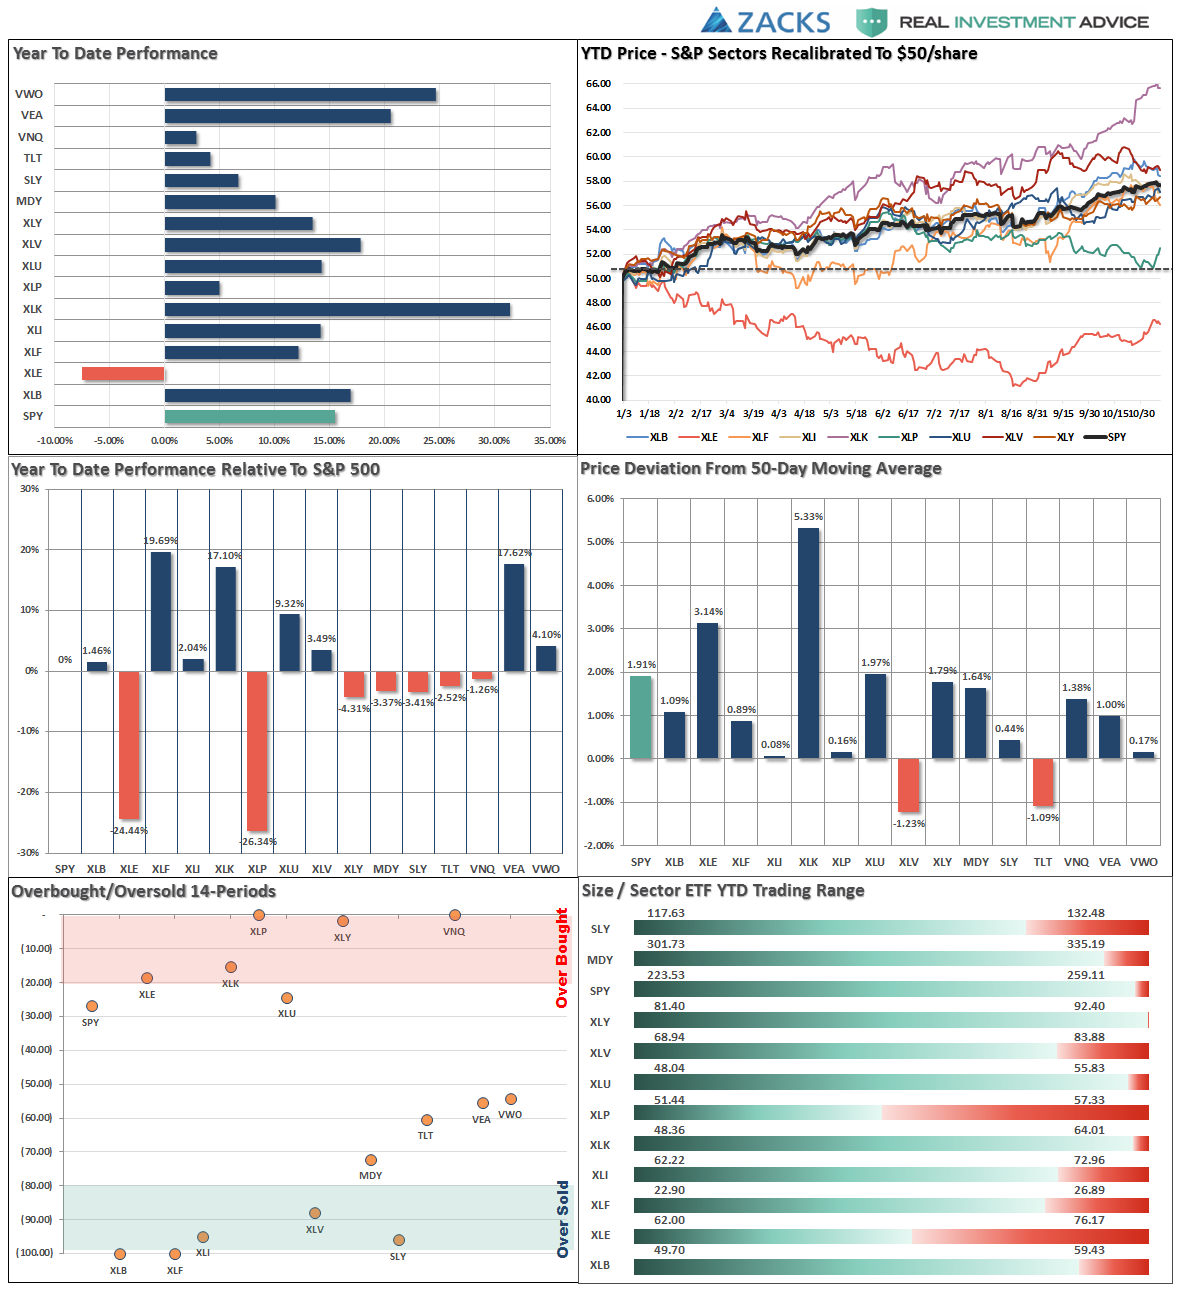
Performance Analysis
ETF Model Relative Performance Analysis
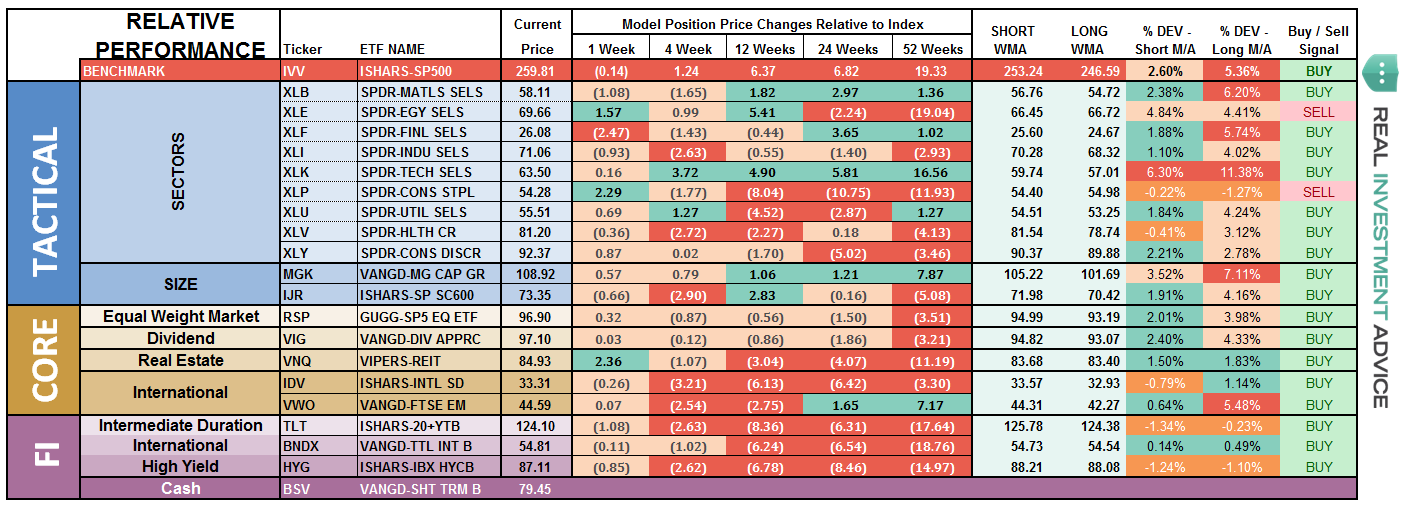
Weakness is showing up in “Risk” sectors and indices on a “relative performance basis” (compared to S&P 500) and shifting into more “Defensive” sectors such as Bonds, Real Estate, Staples, and Dividends.
Sector and Market Analysis:
This past week, the market stumbled slightly but did little to change the current trajectory of the market overall.
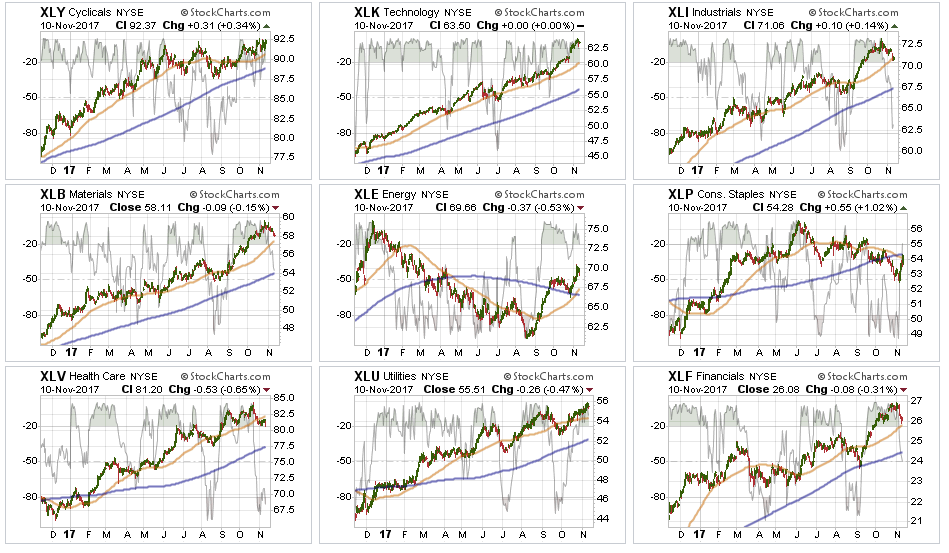
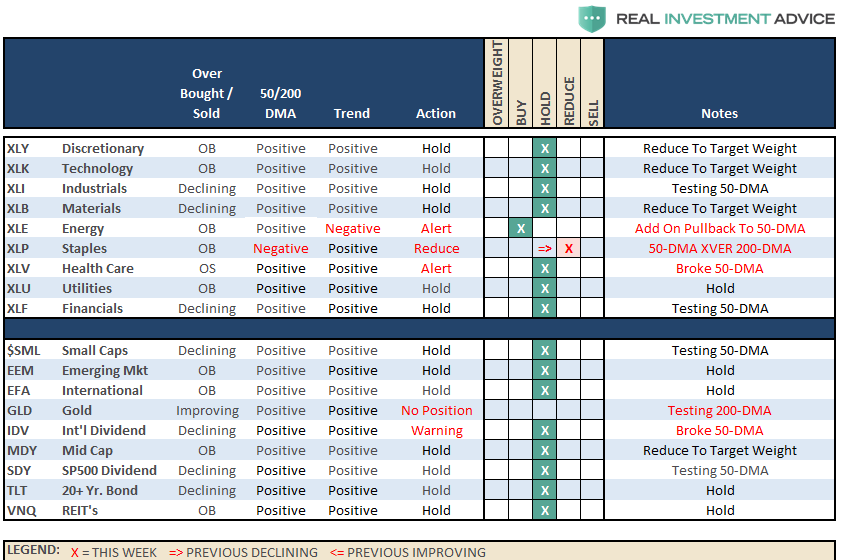
Technology – surged higher as money continues chasing a declining number of stocks. Given the massive weightings of FB, AMZN, GOOG, MSFT, AAPL, etc., their performance kept the overall indices afloat this past week. Given the extremely overbought condition currently, taking some profit and rebalancing holdings is warranted.
Staples have been under immense pressure recently, but had a sharp recovery this past week as investors “bought the dip.” The trend is becoming more negative with the 50-dma crossing the 200-dma. While the recovery last week was positive, underweighting the sector as recommended last week is prudent.
Basic Materials, Financials, and XLI gave up ground last week as the “Trump Trade” based on “tax reform” looks much less likely currently. Trends are still positive but there is a risk to these sectors if legislation fails to pass. Take profits and rebalance risks just in case.
Healthcare has slipped below its 50-day moving average and is testing that resistance as of Friday. While the trend remains positive, the violation of the support suggests profit taking and rebalancing is warranted to reduce risk. Keep stops at the September lows.
Energy bounced off of the 200-dma as oil prices finally broke above $52/bbl and climbed to $57. With the 50-dma having crossed above the 200-dma, we are now looking to add energy back into portfolios after having been out of the sector since 2014.
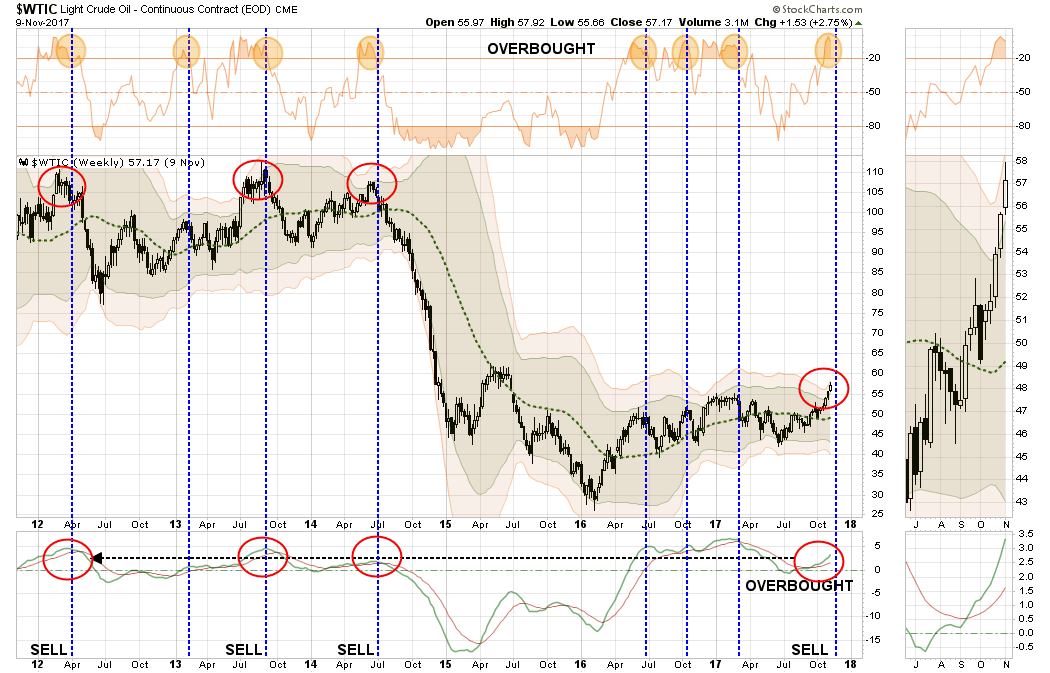
With oil extremely extended, and at 3-standard deviations above the long-term mean, a level that has previously denoted corrections in the past, we are looking for a correction that does NOT violate recent support levels to ADD exposure to portfolios. Patience will provide a more risk-adjusted entry point.
Utilities, we remain long the sector and have moved stops up to the 50-dma. Trends remain positive and interest rates have likely peaked for the current advance.
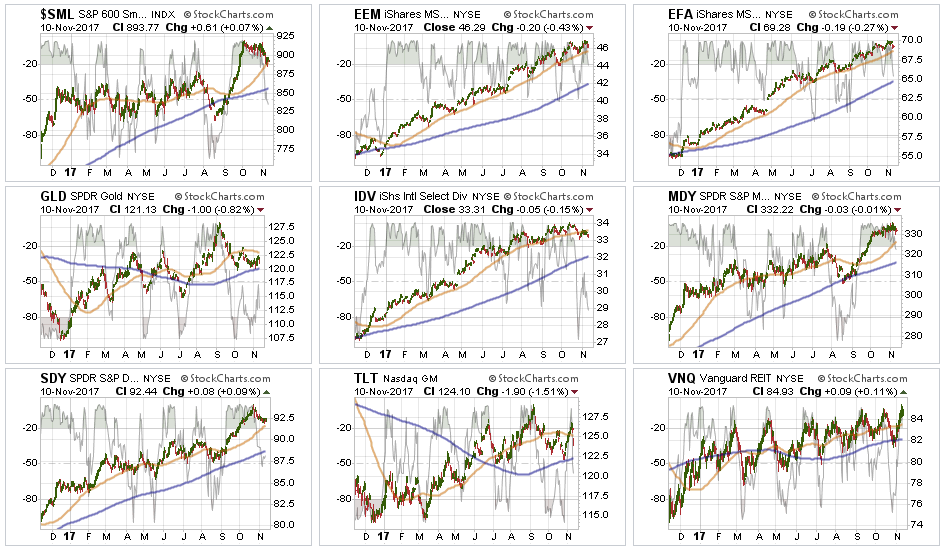
Small- and Mid-Cap stocks have stalled over the last couple of weeks and remain overbought. Stops should be moved up accordingly. We previously took some gains out of these sectors but remain long for now.
Emerging Markets and International Stocks have shown some weakness as of late in terms of momentum, but remain in a bullish trend overall. We remain long these markets for now but have moved up stops accordingly.
Gold – I noted previously the failure of precious metals to break back above the 50-dma. With the complete absence of FEAR of a potential crash, gold has temporarily “lost its luster” as a safe haven. We continue to watch the commodity currently, but remain on the sidelines for now.
S&P Dividend Stocks (IDV, SDY), after adding some additional exposure this summer, the index managed an extremely strong advance. We are holding our positions for now with stops moved up to $92. Take some profits and rebalance accordingly. Dividend stocks have gotten WAY ahead of themselves currently as the yield chase continues.
NASDAQ:TLT and REITs – bonds took a bit of a hit on Friday as rates jumped over hopes for “tax reform.” Such will likely be short-lived. We recently added a good bit of bond exposure to portfolios so we are holding positions for now. The bullish trend in REITs continue, so we are holding those positions as well and continue to look for pullbacks to add additional exposure.
Sector Recommendations:
The table below shows thoughts on specific actions related to the current market environment.
(These are not recommendations or solicitations to take any action. This is for informational purposes only related to market extremes and contrarian positioning within portfolios. Use at your own risk and peril.)
Portfolio Update:
No changes this past week.
We used the pop in interest rates to move cash management accounts, and larger cash holdings, into our cash allocation strategy providing for better yields. We also added some new bond exposure to accounts and are looking for additional opportunities if rates push higher over the next couple of weeks.
I am now looking to begin building “Short S&P 500 and NASDAQ” positions into portfolios over the next few weeks as a hedge against a January decline as noted above. I will keep you advised as to changes in portfolios ahead if my expectations begin to come to fruition.
We remain extremely vigilant of the risk that we are undertaking by chasing markets at such extended levels, but our job is to make money as opportunities present themselves. Importantly, each week we raise trailing stop levels and continue to look for ways to “de-risk” portfolios at this late stage of a bull market advance.
As always, we remain invested but are becoming highly concerned about the underlying risk. Our main goal remains capital preservation.
