Last week, I did a fairly extensive analysis on the release of the 9-page “Trump Tax Cut” plan.
The most important aspect of that discussion was the difference between 1982, the last time there was permanent tax reform, as compared to today.
“Comparing Trump’s economic policy proposals to those of Ronald Reagan. For those that deem that bullish, we remind you that the economic environment and potential growth of 1982 was vastly different than it is today. Consider the following table:‘”
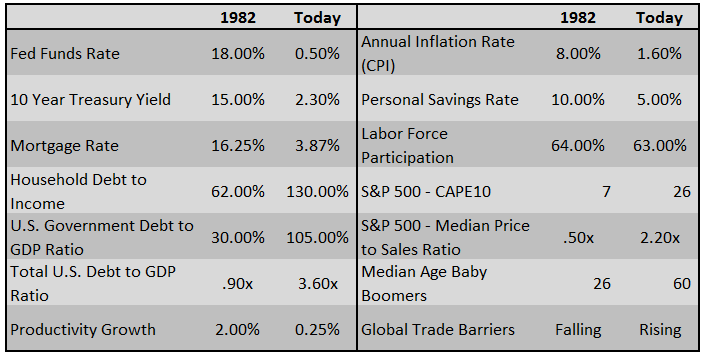
The differences between today’s economic and market environment could not be starker. The tailwinds provided by initial deregulation, consumer leveraging and declining interest rates and inflation provided huge tailwinds for corporate profitability growth.
Most importantly, when tax cuts were implemented in the mid-80’s, the U.S. economy was just coming out of back-t0-back recession versus being in the third longest economic expansion on record to date.
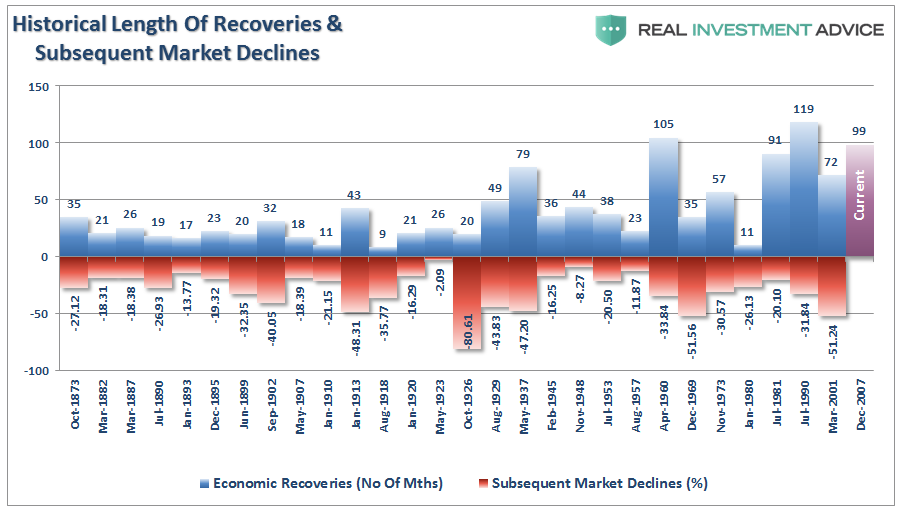
However, besides the fact the economic backdrop is diametrically opposed to what is was during the “Reagan years,” we also need to look at the backdrop of who actually pays taxes to begin with.
Who Pays Taxes
While the current tax plan has not defined actual income levels as of yet, we can make some assumptions from previous iterations of proposals. The entire premise behind the tax cuts is that it will unleash economic growth, generate millions of jobs, bring back manufacturing to America and lead to higher wage growth.
However, given that roughly 70% of economy is driven by personal consumption, the tax cuts will need to increase the amount of disposable incomes available to individuals to expand consumption further, thereby increasing overall economic growth.
So, here is the issue of tax cuts for the middle class. The chart below shows “who pays what in Federal taxes.”
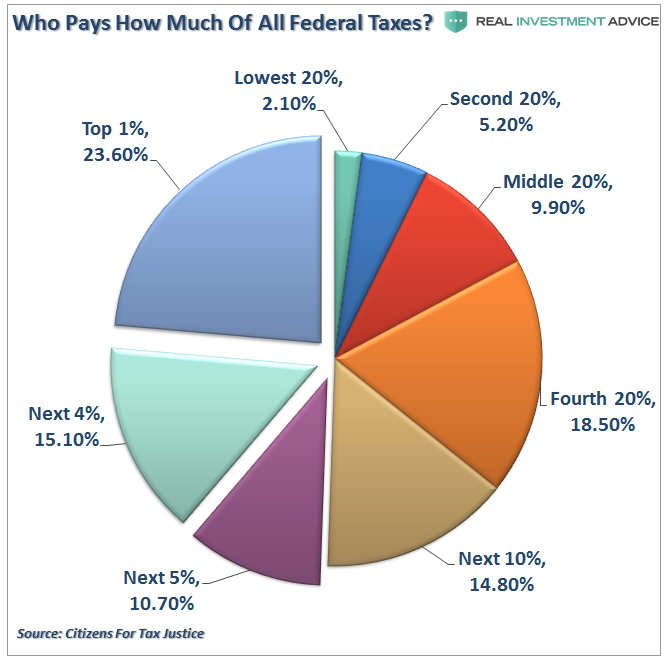
Look at that chart closely.
- 50% of ALL taxes are paid by the top 10% of income earners.
- The other 50% of ALL taxes are paid by remaining 90%.
- The BOTTOM 80% only pay 36% of ALL taxes.
But it is even more glaring when we look at the taxes paid by just the top 20% of income earners.
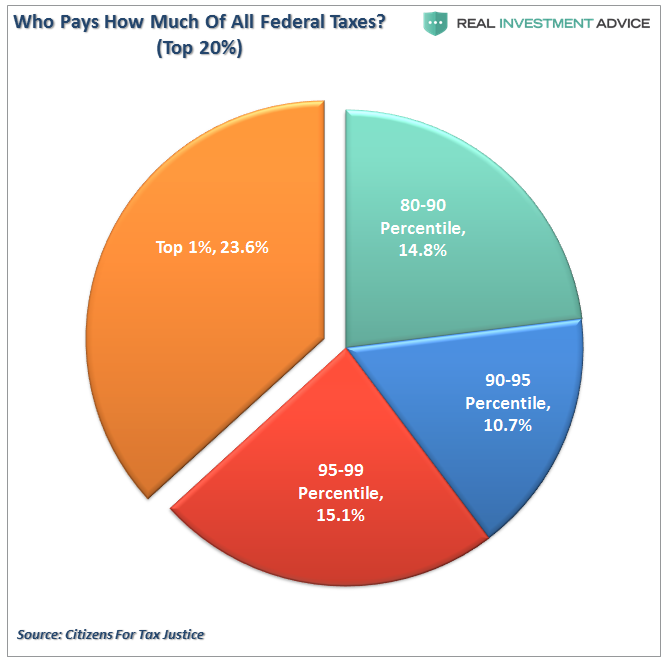
Given that roughly 2/3rds of income taxes are paid by the top 20%, the reality is that tax cuts will have their greatest impact in reducing the tax burden of those individuals.
The picture gets worse when you look at just INDIVIDUAL tax liabilities. The bottom 80% currently pay only about 18% of individual taxes with top 20% paying the rest. Furthermore, the bottom 40% currently have a NEGATIVE tax liability, and with the new tax plan cutting many of the deductions currently available for those in the bottom 40%, it could be the difference between a tax refund and actually paying taxes.
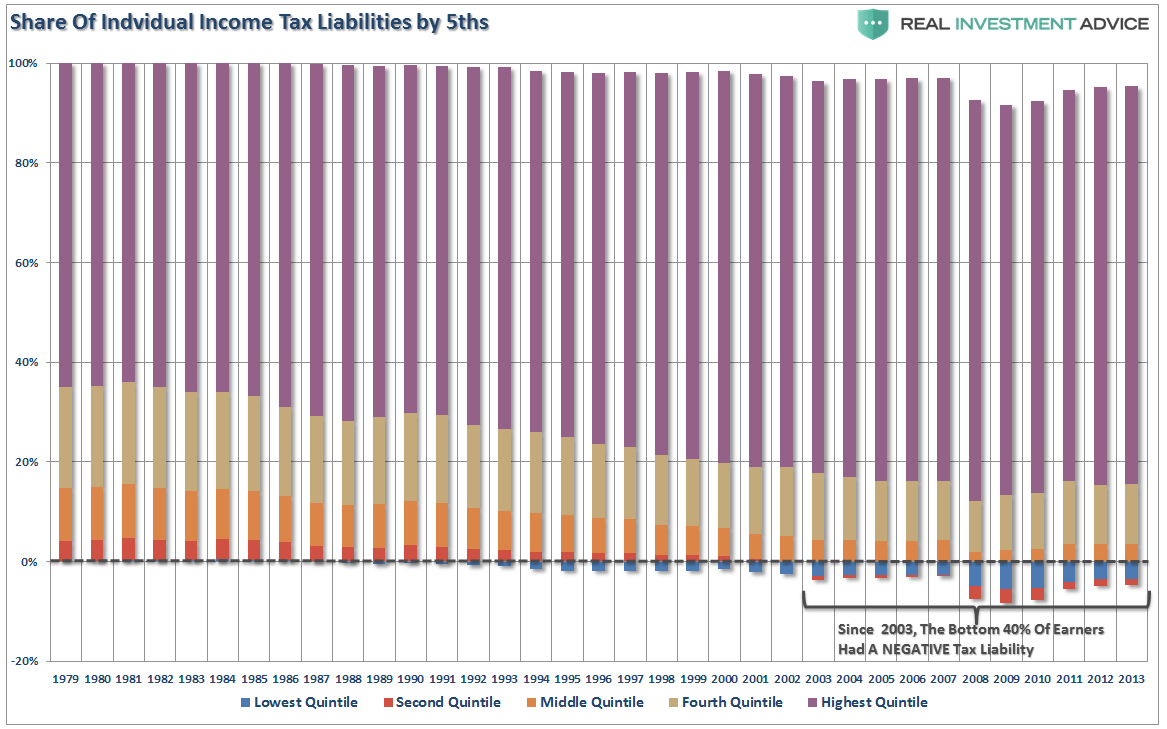
Of course, those in the top 20% of income earners are likely already consuming at a level with which they are satisfied. Therefore, a tax cut which delivers a few extra dollars to their bottom line, will likely have a negligible impact on their current levels of consumption.
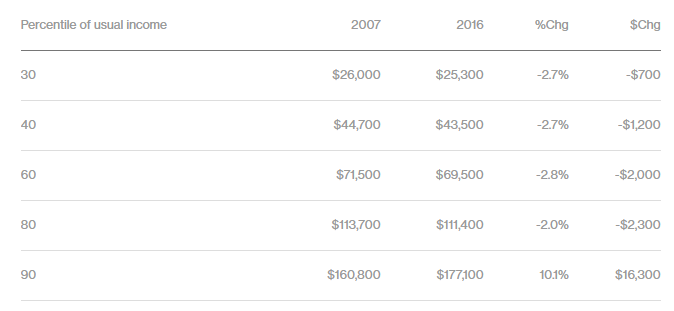
The problem, as I have detailed previously, is that the vast majority of Americans are living paycheck to paycheck. According to CNN, almost six out of every ten Americans do not have enough money saved to even cover a $500 emergency expense. That lack of savings can be directly contributed to the lack of income growth as noted recently by Bloomberg:
“Newly released income and wealth data from the Federal Reserve Board’s triennial Survey of Consumer Finances show that America’s richest families enjoyed gains in income and net worth over the last decade. Not part of the top 10 percent? Then your income probably fell. The data show that families ranked in the highest percentile saw an income gain of $16,300 from 2007 to 2016. Those below are still making less money.”
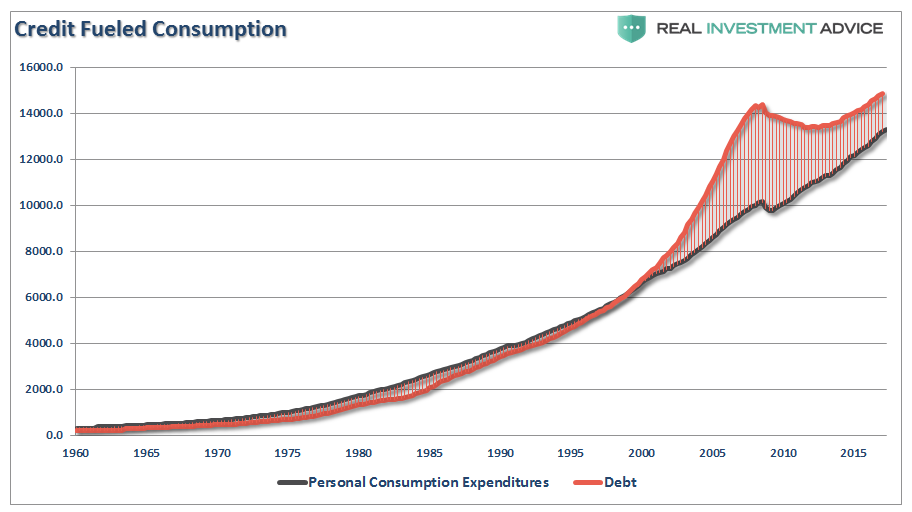
So, with 80% of Americans living paycheck-to-paycheck, the need to supplant debt to maintain the standard of living has led to interest payments consuming a bulk of actual disposable income. The chart below shows that debt has exceeded personal consumption expenditures. Therefore, any tax relief will most likely evaporate into the maintaining the current cost of living and debt service which will have an extremely limited, if any, impact on fostering a higher level of consumption in the economy.
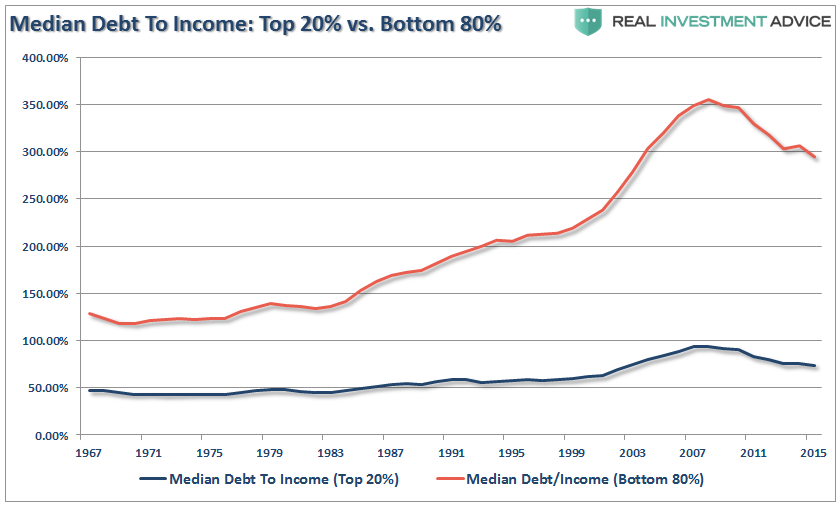
But again, there is a vast difference between the level of indebtedness (per household) for those in the bottom 80% versus those in the top 20%.
But Corporate Tax Cuts Are The Key, Right?
Yes, corporate tax cuts will immediately drop to the bottom lines of corporate income statements. When that earnings boost is combined with any repatriated dollars to buy back shares, there will be an earnings expansion for the first year. (You didn’t REALLY think they would use repatriated dollars to expand production and hire workers did you?)
Importantly, while there is a boost to bottom line earnings, there was NO increase in top-line revenues.
However, from an economic perspective, tax cuts for corporations will have only a minor impact in reality. The first chart below shows total federal tax revenue by source.
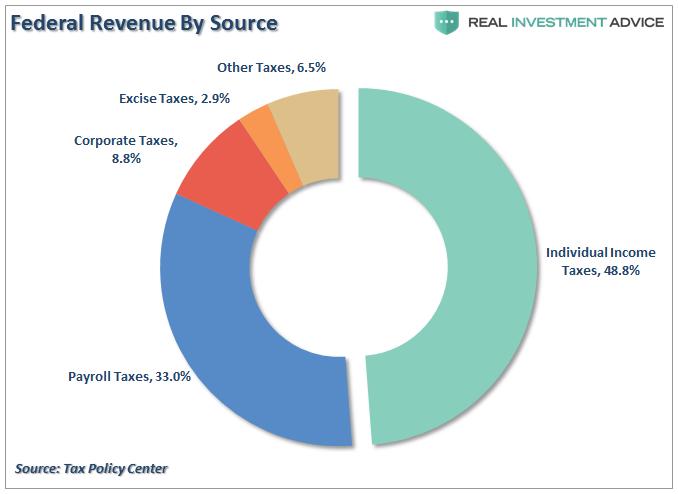
As you can see, corporate taxes are less than 10% of the total taxes collected by the Government.
But more importantly, it is the promise of cutting the corporate tax rate from 35% to 20% that has gotten the financial markets all excited.
There’s just one problem. Roughly 80% of all corporations already pay rates far lower than 20% and any reduction in deductions for corporations will actually lead to higher taxes being paid. As shown below, 90% of all corporations currently have a tax rate below 10%.
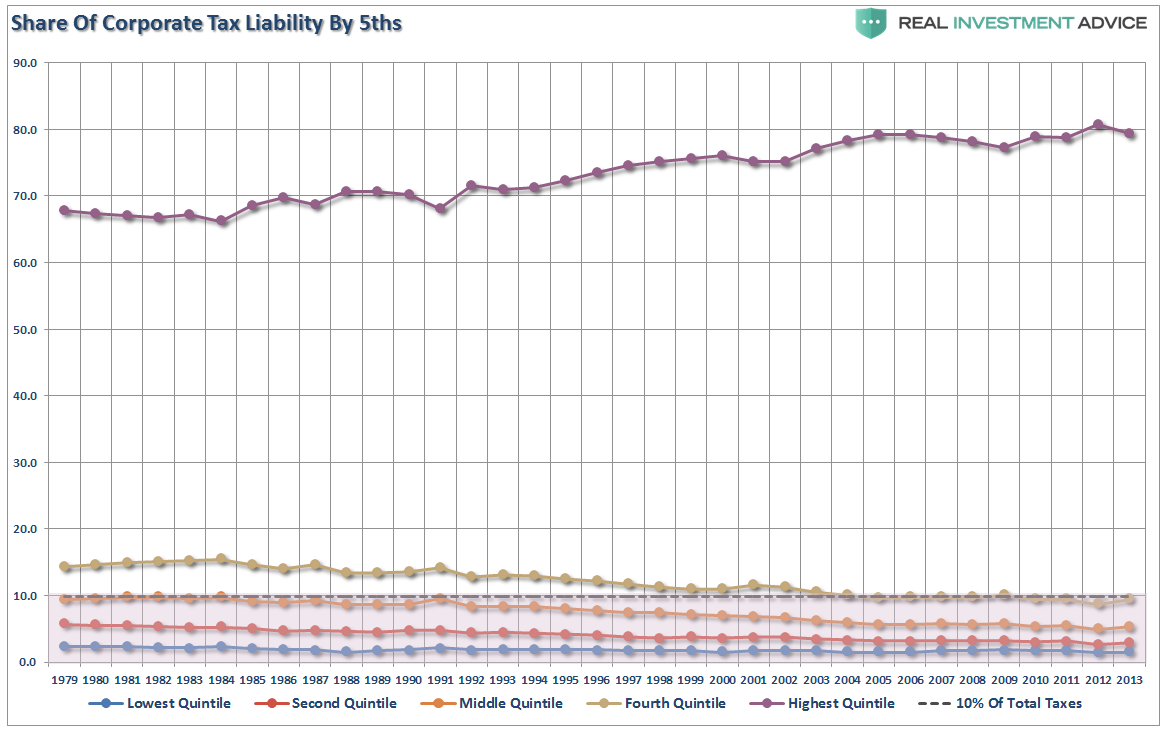
It is a myth that the U.S. has the highest corporate tax rate in the world. We simply don’t.
This was also an observation made by Dr. John Hussman this week:
“I’ll add that another feature of Wall Street’s blissful delusion is the notion that ‘U.S. corporate taxes are the highest in the world.’ It’s striking how disingenuous this claim is. The fact is that among all OECD countries, the U.S. is also the only country that does not levy any tax at all on corporate value-added in the production of goods and services.”
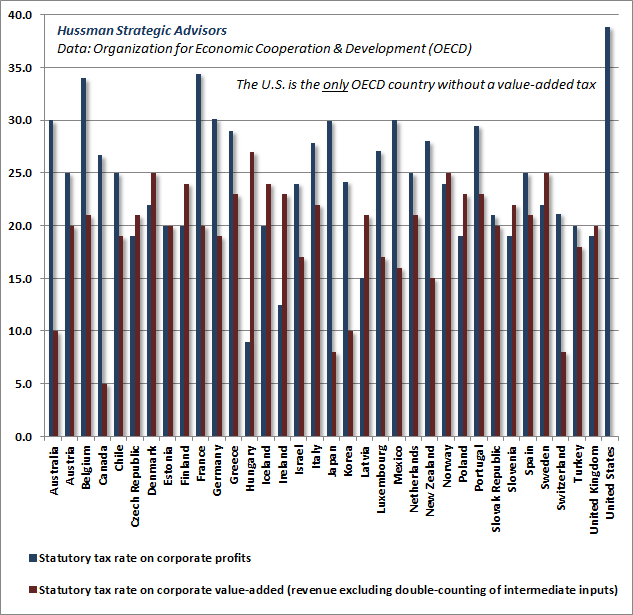
“The main point is this. The argument that U.S. taxes on corporate profits are somehow oppressive relative to other countries is an apples-to-oranges comparison. It wholly ignores that the U.S. levies no value-added tax on corporations at all, whereas the value-added tax is the principal revenue source for most other countries. The rhetoric on corporate taxes here is unfiltered effluvium.
The chart below presents a clearer picture of U.S. corporate profits taxation. Actual taxes paid by U.S. companies, as a share of pre-tax profits, have never been lower, outside of the depths of the global financial crisis.”
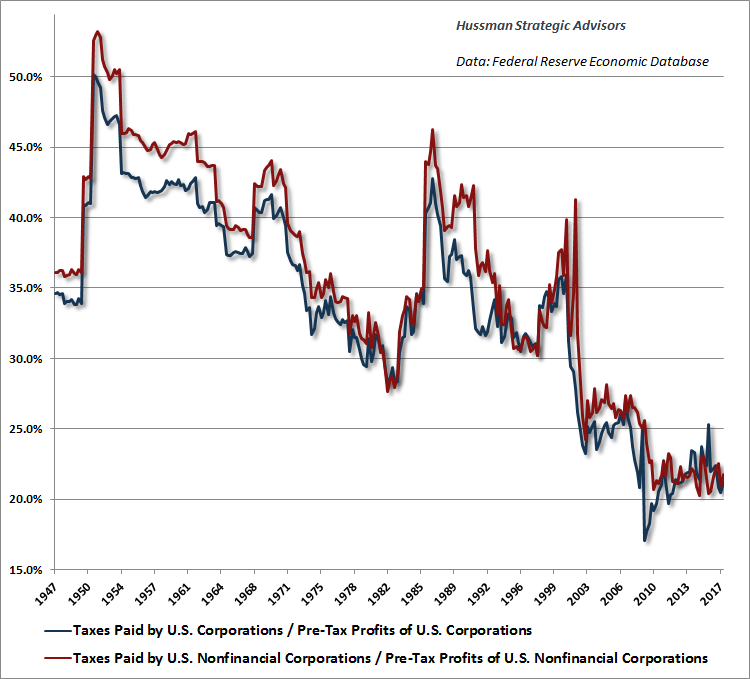
Again, as with individual taxes, today ain’t 1982 or 1986.
The effective outcome of tax cuts at this juncture will result in:
- Only a minimal impact to economic growth, if any at all.
- An expansion of the debt of between $2-5 Trillion depending on next recessionary drag.
- A ballooning of the budget deficit as entitlements rise with the expansion of child tax credits.
- A further divide in the “wealth gap” between those in the top 10% and the bottom 90%.
This issue of whether tax cuts lead to economic growth was examined in a 2014 study by William Gale and Andrew Samwick:
“The argument that income tax cuts raise growth is repeated so often that it is sometimes taken as gospel. However, theory, evidence, and simulation studies tell a different and more complicated story. Tax cuts offer the potential to raise economic growth by improving incentives to work, save, and invest. But they also create income effects that reduce the need to engage in productive economic activity, and they may subsidize old capital, which provides windfall gains to asset holders that undermine incentives for new activity.
In addition, tax cuts as a stand-alone policy (that is, not accompanied by spending cuts) will typically raise the federal budget deficit. The increase in the deficit will reduce national saving — and with it, the capital stock owned by Americans and future national income — and raise interest rates, which will negatively affect investment. The net effect of the tax cuts on growth is thus theoretically uncertain and depends on both the structure of the tax cut itself and the timing and structure of its financing.”
Again, the timing is not advantageous, the economic dynamics are not supportive and the structure of the tax cut itself is not self-supporting.
As Hussman concludes:
“The potential effect of even a substantial percentage reduction in statutory rates for several years is quite small when the present value of the tax reduction is compared with existing equity market capitalization. The likely cumulative impact comes to just a few percent of stock market value.
Against that, consider that the most reliable market valuation measures we identify (as measured by their correlation with actual subsequent S&P 500 total returns in market cycles across history) are currently between 2.5 and 2.7 times their historical norms (that is, 150% to 170% above those norms).
Put simply, it seems misguided to imagine that ‘tax reform’ will somehow make the most obscene speculative bubble in U.S. history something other than the most obscene speculative bubble in U.S. history.”
Put simply, you can’t solve a debt-problem with tax cuts.
