Monetary easing speculation is providing a boost for Asian markets today. Draghi’s intimation that the ECB may be forced to ease further at their March meeting, as well as fomenting expectations that the BoJ may ease further at their meeting next week, are all supporting the rally. Nowhere more so than in Japan, where the Nikkei 225 has not only recovered yesterday’s losses but has now gained over 3% on the day.
It is widely expected that the renewed selloff in oil over the past two months will see the BoJ lower their inflation forecasts. The Japanese yen has also continued to trade below 118 for much of 2016 hurting Japanese exporters and doing little to improve the inflation situation in Japan. These developments appear to be fueling the chatter around a potential easing by the BoJ next week. Of course, these sorts of leaks to the press could also be a way for other elements of the government to try and put pressure on the BoJ to act. And given the BoJ reluctance to act of late (apart from an underwhelming technical change in December), on the face of it, the most likely scenario would seem to be no change at next week’s meeting. Certainly, the yen does not appear to be showing any of the same ebullience seen in the Japanese equity market just yet.
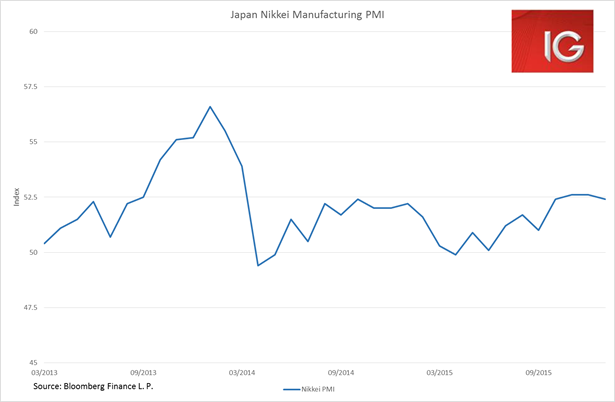
Japan’s flash manufacturing PMI for January weakened somewhat, but has remained at strong levels at 52.4. This is one aspect that may give the BoJ pause in that we have seen a slowly improving domestic economy situation in Japan. GDP was revised up in Q3, business investment is picking up and industrial production has been steadily rebounding. These are the sort of developments that BoJ hawks, such as Takahide Kiuchi, will be pointing to as making it unnecessary to see further easing by the BoJ.

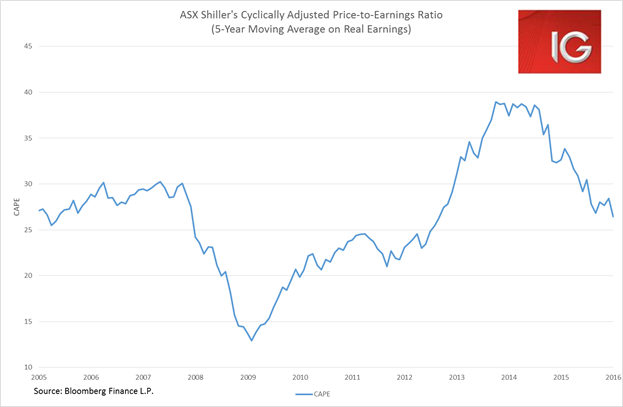
The bigger question everyone in the markets is asking is whether we have seen the bottom. In my opinion, the short answer is no and there are two major historical indicators worth noting. Nobel-Prize winner Robert Shiller argued that a long-term average of real earnings provided a good indication of future real dividends. Hence, using Shiller’s cyclically-adjusted price-to-earnings (CAPE) ratio one can gauge respective long-term valuations. I’ve just used a 5-year moving average on this as opposed to 10, and real earnings are deflated from 2000 from readily available ASX data. But the CAPE makes it fairly clear that the ASX is still trading at valuations well above where it was trading in 2011-2012. There’s certainly nothing discernible from the CAPE measure that would say we have necessarily hit a bottom. And we are still way above the GFC lows.

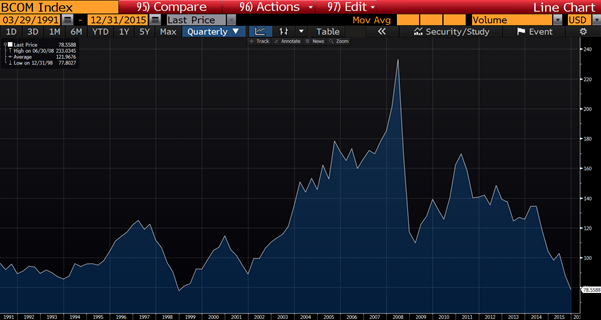
The other factor is we have not yet seen the end to the commodities slide. Major turning points in equity market turnarounds have always occurred in conjunction with a stabilization in commodity prices, and have often been led by copper prices in particular. When one looks at the Bloomberg commodities index there certainly does not look to be any discernible turnaround as of yet.

Ahead of the European open we are calling the:
FTSE 100 5776 +2
DAX 9576 +2
CAC 40 4204 -2
IBEX 35 8449 +5
