- Yesterday’s Fed warnings failed to deter investors in the face of a return to business
- The recent oil crash, followed by its forceful rally, demonstrates structural problems seen across all asset markets
- The Bank of England has a policy decision due on Thursday.
- Friday brings the much anticipated (and dreaded) U.S. Nonfarm Payrolls report for April. It's expected to show a 21 million plunge, the stark impact of the ongoing pandemic.
- Futures on the S&P 500 rose 0.7%.
- The STOXX Europe 600 Index slipped 0.1%.
- The MSCI Asia Pacific Index climbed 0.6%.
- The MSCI Emerging Markets Index rose 0.7%.
- The Dollar Index was little changed.
- The euro bought $1.0825, down 0.1%.
- The yen strengthened 0.2% to 106.32 per dollar.
- The yield on 10-year Treasuries rose two basis points to 0.69%.
- Germany’s 10-year yield rose two basis points to -0.56%.
- West Texas Intermediate crude slid 1.3% to $24.27 a barrel.
- Gold dipped less than 0.1% to $1,705.14 an ounce.
Key Events
All four major US contracts—for the S&P 500, Dow Jones, NASDAQ and Russell 2000—advanced on Wednesday while European shares slipped. Asian regional indices were mixed, as hopes of economic recoveries grow ahead of the easing of US lockdowns, while European shares were pressured by uneven earnings results and additional negative data.
Yields climbed on increased risk-off sentiment. The dollar was flat.
Global Financial Affairs
The pan-European STOXX 600, opened lower, but is now relatively flat. Mixed earnings results and ongoing US-China discord continue to weigh on markets. Still, it’s difficult to reconcile that narrative with the fact that both US futures and Chinese shares gained.
This morning, Asian stocks pushed higher after China allowed its yuan to rise. That was seen as a gesture of good will by Beijing to the US, a way, perhaps, of relieving renewed pandemic-related trade tensions.
South Korea’s KOSPI surged 1.75%, outperforming the region. Australia’s ASX 200 lagged, (-0.4%), as investors took profits after two days of robust gains.
Yesterday, US stocks pared gains in the final 45 minutes of Wall Street trading after Fed Vice Chairman Richard Clarida warned that all the stimulus thus far is insufficient to support the economy and the government will need to do more. St. Louis Fed President James Bullard admitted that the unprecedented Fed stimulus is “very much an experiment.”
President Donald Trump reiterated his charge that COVID-19 and the devastation it's brought is China’s fault, reawakening concerns of a trade war. The earlier rally reversed, but the S&P 500 Index still advanced 0.9% on a gap and the tech-heavy NASDAQ finished up 1.13%.
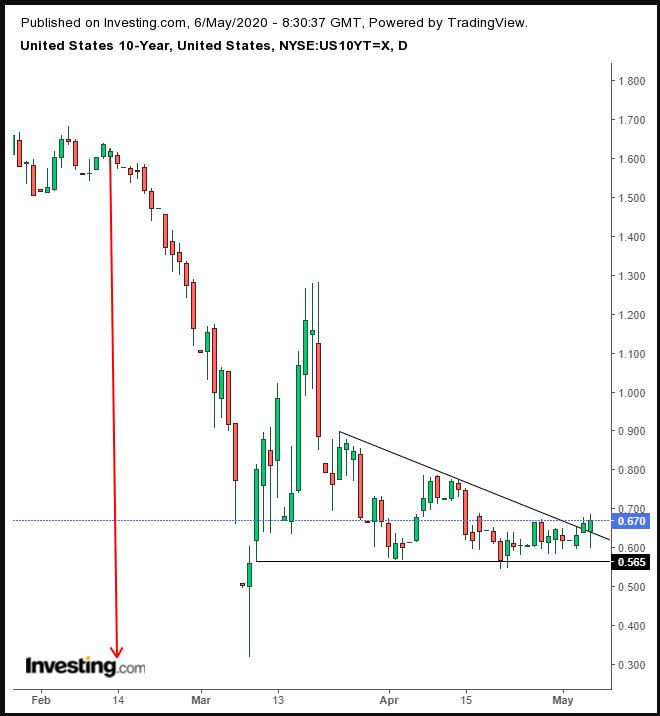
The yield on the U.S. 10-year note climbed for a third day and moved past 0.67%.

Investors are selling Treasurys in hopes of participating in the equity rally, fueled by the promise of the economy returning to normal. Technically, rates extended the penetration of an upside breakout to a possible ascending triangle. If this sovereign bond rally is sustained it will blow out a bearish pattern.
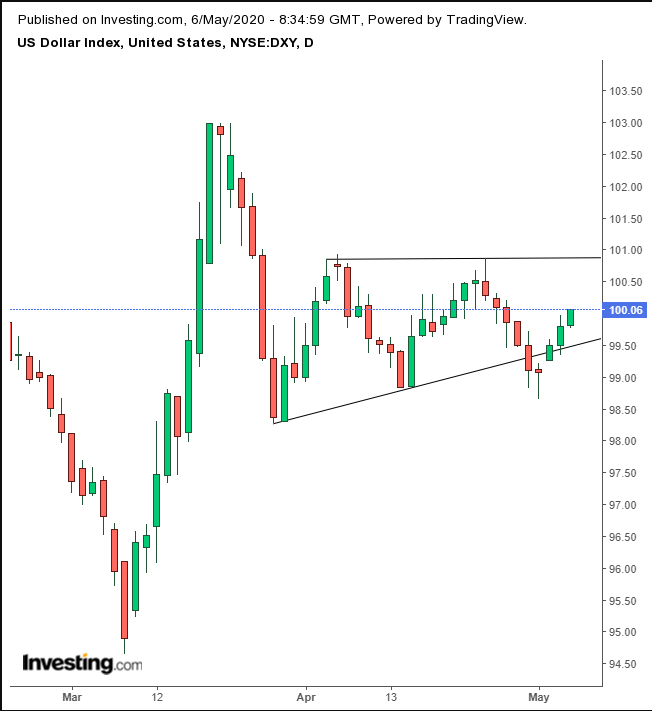
The dollar advanced for the third day yesterday and continued to rise in early Wednesday trade.

According to some analysts, “Since the onset of the coronavirus pandemic in March, the dollar has developed a positive correlation with US stocks,” in direct opposition to its normal, negative correlation. Technically, the three-day rally allowed the greenback to climb back into an ascending triangle, rendering its Thursday-Friday dip below the pattern a fakeout.
However, an ascending triangle is a structurally bullish pattern, as the demand line accelerates while the supply line remains flat. Counterintuitively this move follows a decline, demonstrating that the market is structurally out of whack.
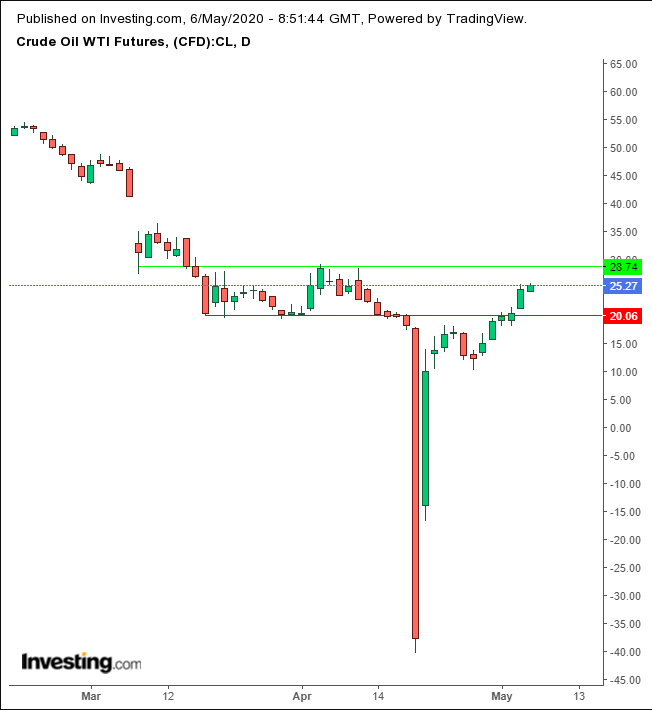
This has been manifesting in other ways as well. After oil made history by crashing well below zero just a few weeks ago, WTI is experiencing a tremendous rally, boosting demand for its base currency, the USD.

Crude fluctuated, struggling to keep its sharp advance alive, as investors weigh an inventory build in the face of optimism of restarting global economies. From a technical perspective, the $25 mark—which oil has now surpassed—is a psychological milestone, though we only consider the level firm on a closing basis.
Overall, oil is presumed to be ranging between $20, an important support-resistance level since March 18, and $30, the next supply and demand line since March 9. There are those, however, who think that oil has a lot more upside.
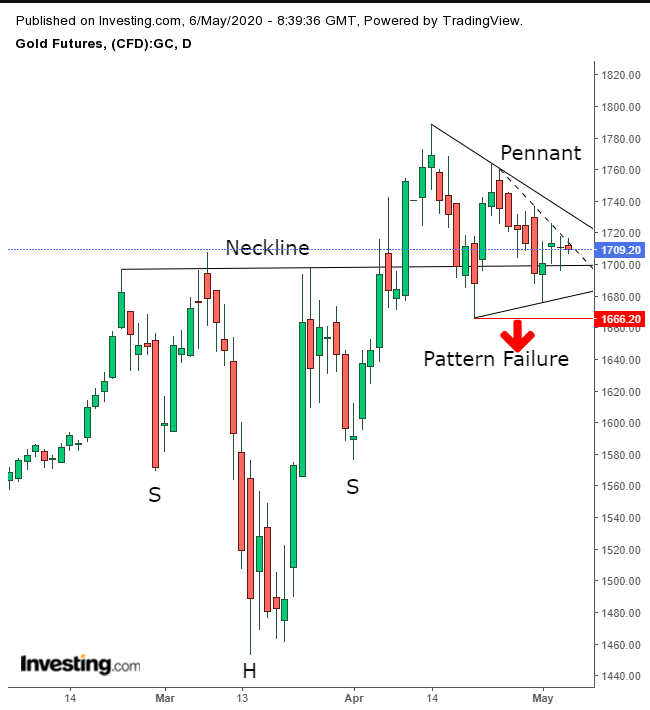
Gold fell for a second day as the dollar's rally made it more expensive.

The yellow metal resumed trading within a bullish pennant, which would be complete with an upside breakout. This would also complete the return move of a H&S continuation pattern.
Up Ahead
Market Moves
Stocks
Currencies
Bonds
Commodities
