- Asian stocks fall, though China equities spared
- Nikkei 225 completed Island Reversal pattern
- Europe falls a sixth straight day
- US S&P 500 futures pares earlier loss
- Dollar eases but falls against yen
- Bitcoin under $8,000; expected to keep falling
Key Events
This morning, stocks In both Europe and Asia tumbled, along with US futures, extending the biggest global equity market selloff since 2016, as Treasury yields—a principal culprit in this selloff—continued to creep higher. For a deeper drilldown into last week's US equity selloff, see yesterday's Week Ahead post.
As the trading week began, Asian stocks plunged. Both of Japan’s benchmark indices, the TOPIX and the Nikkei 225 fell the most in 14 months, since November 2016. Both also opened flatter: the TOPIX down 1.28 percent and the Nikkei, - 1.51 percent lower.
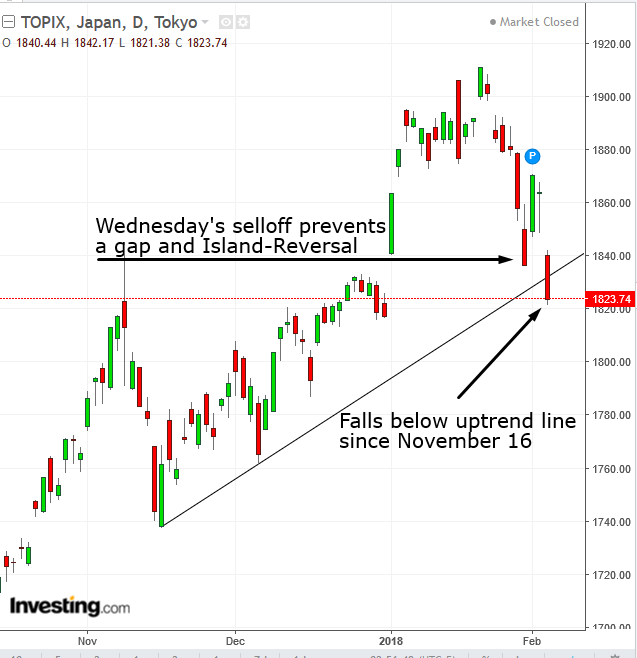
Of the two, however, only the Nikkei’s lower opening constitutes a gap, while the lower opening for the TOPIX overlapped with Wednesday’s selloff.
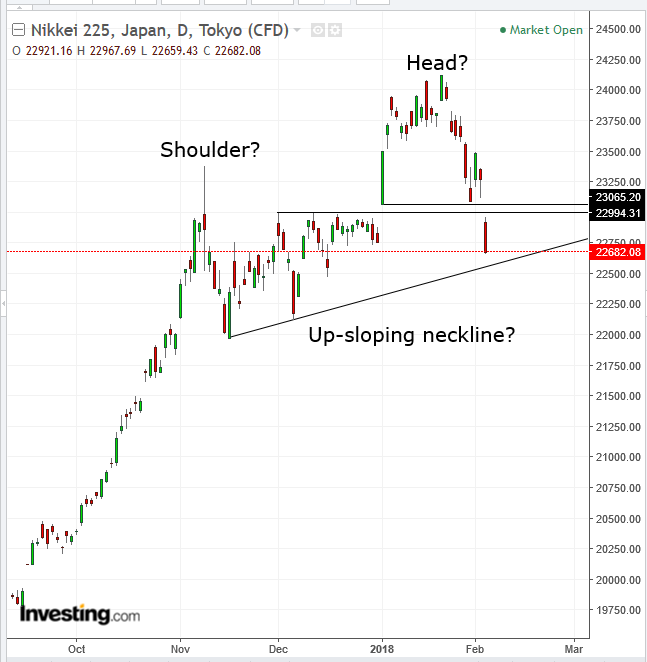
The falling gap on the Nikkei 225 is at the same price level of a rising gap on its first trading day of the year, January 4, potentially completing an Island Reversal. The pattern consists of a rising gap, followed by a falling gap, with a tight trading range in the interim. While not a major reversal, it tends to be part of larger pattern. In this case, it can turn into the head of a H&S top.
Global Financial Affairs
Shares listed on Hong Kong’s Hang Seng index and on mainland China's Shanghai Composite trimmed losses after China’s securities regulator urged brokerages to help stem the rout, according to Bloomberg. Though shares on the Hang Seng ended lower, losses were trimmed by dip buyers scooping up stocks in outperforming sectors such as banking and airlines. Sentiment was also lifted by a private survey showing China’s services sector got off to a flying start in 2018, expanding at its fastest pace in almost six years.
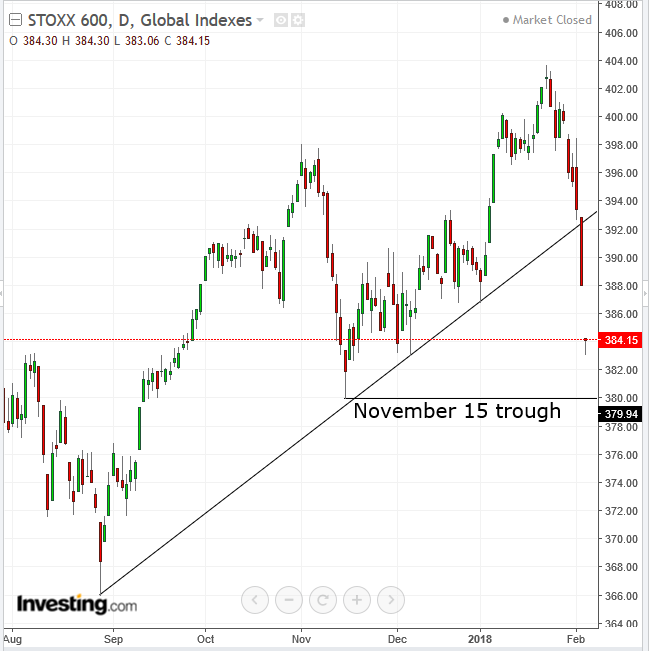
The STOXX Europe 600 Index Index was sucked into the global risk-off sentiment, retreating for a sixth straight day. It opened 0.95 percent lower, after crossing below its uptrend line since August 29 on Friday. The next test would be the November 15 trough.
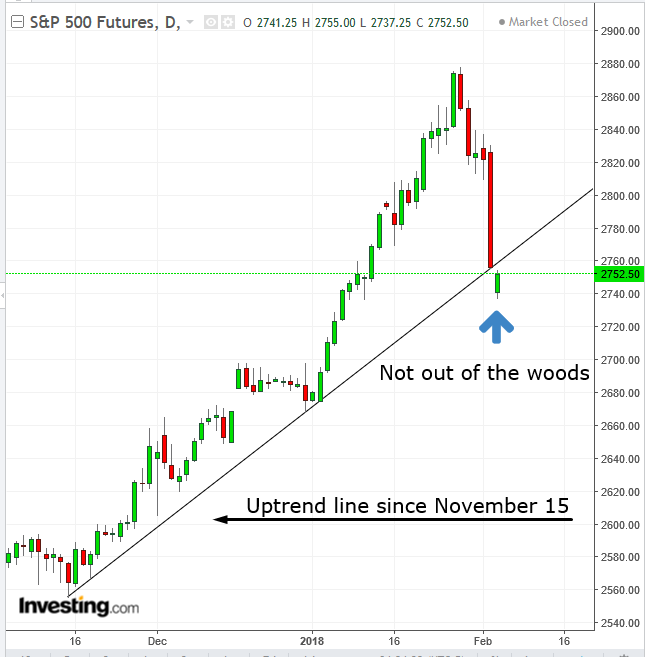
Ironically, while Europe and Asia followed the US, Wall Street appears to be easing its equity outlook, as S&P 500 Futures this morning pulled back from most of the index's earlier declines. Traders should note, however, that it is still below its uptrend line since November 15, which it crossed below today, signaling the benchmark's future index is not out of the woods yet.
The US 10-year Treasury yield continued higher after last week's selloff and core government bonds in Europe climbed. Investors are watching closely for signs on the direction of the bond rout that started in US Treasuries and spread across global markets last week, with some pointing to continued signs of economic growth as a reason to remain optimistic. European Central Bank President Mario Draghi could help stem further losses when he delivers an annual report to the European Parliament on Monday.
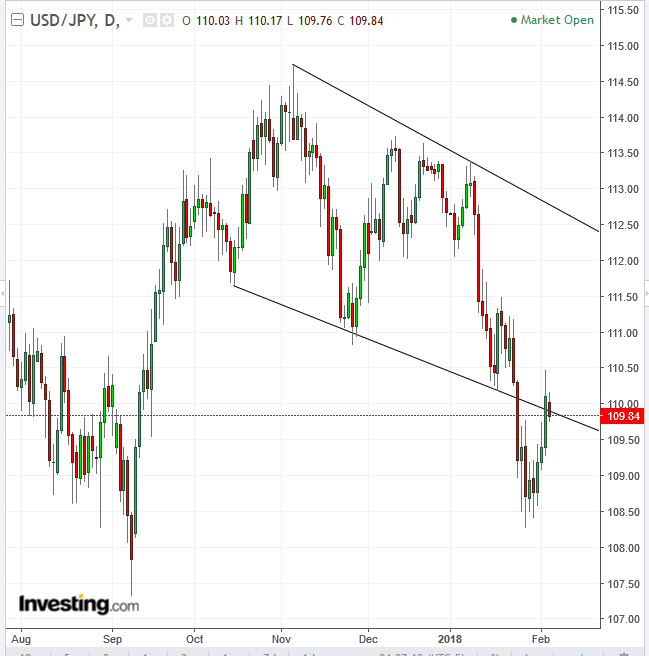
The dollar steadied against the British pound and euro, though it slipped against the yen at a technically crucial point, below the resistance of a falling channel, signaling an outlook for a steeper dollar-decline versus the safe haven yen.
Bitcoin can't seem to catch a break. It keeps getting hit by bad news. The latest: Lloyds Banking Group (NYSE:LYG) has banned customers from buying the leading cryptocurrency using credit cards. It fears the bank will be left holding the (empty) bag.
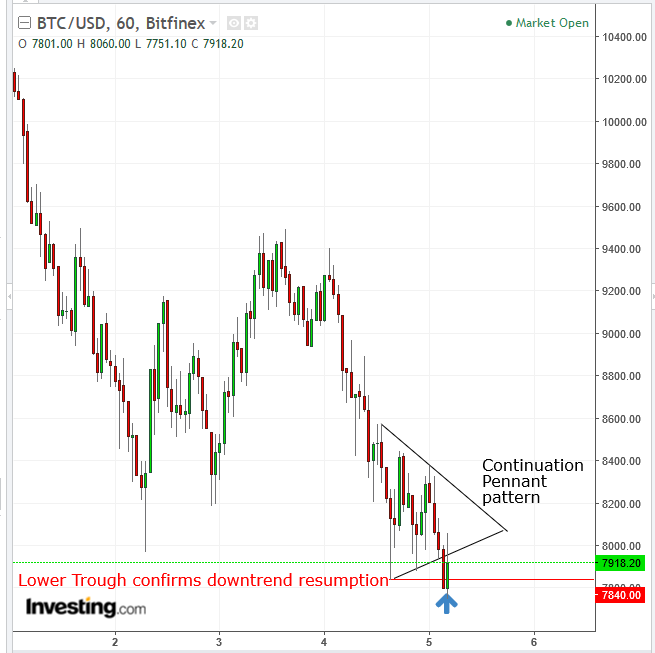
Technically, the price action completed a continuation pennant within a downtrend, as well as extending a trough below the $8,000 level.
Oil continued to slip after US explorers raised the rig count by six; the tally is now at 765, after climbing by 12 last week. This is the highest level since August.
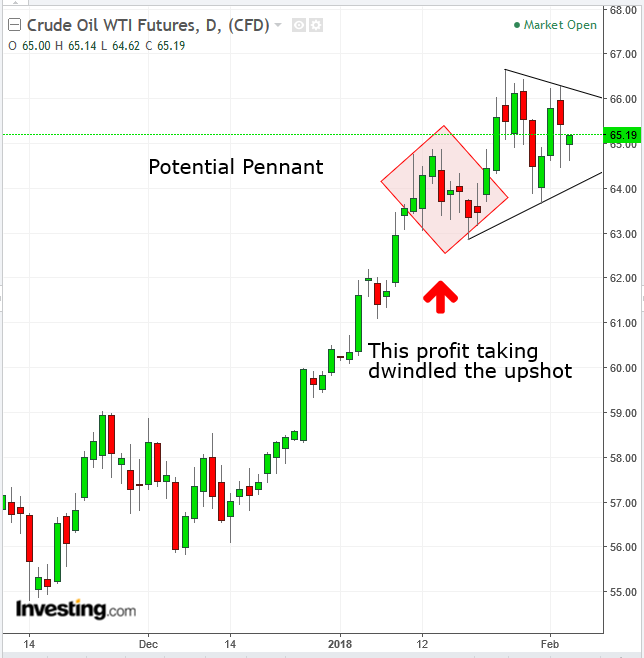
Technically, the commodity's price range may be forming a continuation Pennant pattern. An upside breakout would signal a resumption of the prior uptrend. A snag in the bullishness of this pattern within an uptrend is the rise in the first half of January toward $65 and the decline to $63. That allowed profit-taking, revitalizing the trading ranks, like the loosening of an overstretched rubber band, which otherwise would have provided a further upshot. After that move the rubber band's potential upshot has dwindled.
Up Ahead
- The dollar may get some help from today's US ISM Non-Manufacturing PMI release for January. It's forecast to rise from 56.3 to 55.9
- The Reserve Bank of Australia is expected to keep rates on hold at 22:30 EST this evening, due to persistently weak inflation.
- General Motors (NYSE:GM) is scheduled to release earnings before the market opens on Tuesday, for the fiscal quarter ending December 2017, with a consensus EPS forecast of $1.32, versus $1.28 year-over year. Here are five additional earnings reports to watch this week.
Market Moves
Stocks
- Japan’s TOPIX index declined 2.2 percent at the close and the Nikkei 225 Stock Average sank 2.6 percent, both chalking their biggest slides since November 2016.
- Hong Kong’s Hang Seng Index lost 0.9 percent and the Shanghai Composite Index rose 0.7 percent.
- South Korea’s KOSPI index fell 1.3 percent.
- Australia’s S&P/ASX 200 Index dropped 1.6 percent at the close and New Zealand’s S&P/NZX 50 Index sank 2.1 percent.
- The MSCI Asia Pacific Index fell 1.5 percent; it's set for its biggest decline since December 2016.
- The Stoxx Europe 600 Index dipped 1.1 percent as of 8:58 London time (3:58 EST), hitting the lowest in more than two months with its sixth consecutive decline.
- The U.K.’s FTSE 100 dipped 1.2 percent, reaching the lowest in two months on its fifth consecutive decline, the biggest decrease in six months.
- Germany’s DAX Index decreased 0.6 percent, hitting the lowest in almost 19 weeks with its sixth consecutive decline.
- Futures on the S&P 500 Index fell 0.3 percent to the lowest in four weeks.
Currencies
- The Dollar Index dipped 0.07 percent.
- The euro fell less than 0.05 percent to $1.2461.
- The British pound climbed 0.1 percent to $1.4131.
Bonds
- The yield on 10-year Treasuries advanced one basis point to 2.85 percent, the highest in about four years.
- Germany’s 10-year yield fell three basis points to 0.74 percent, the largest drop in almost six weeks.
- Britain’s 10-year yield fell one basis point to 1.57 percent, the first retreat in almost two weeks and the biggest fall in almost three weeks.
Commodities
- Gold advanced 0.2 percent to $1,335.08 an ounce.
- West Texas Intermediate crude decreased 0.9 percent to $64.87 a barrel.
